Eagle Pass, TX (Texas) Houses and Residents
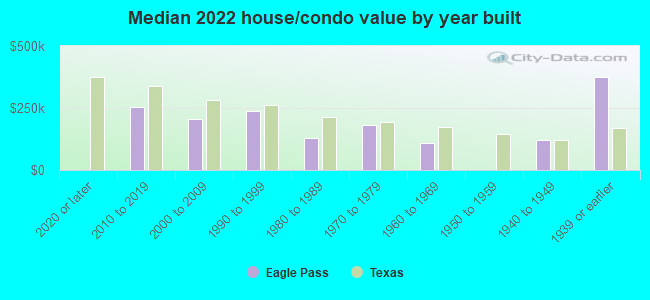
Estimated median house or condo value in 2022: $193,821 (it was $61,200 in 2000 )
Eagle Pass:
$193,821Texas:
$275,400
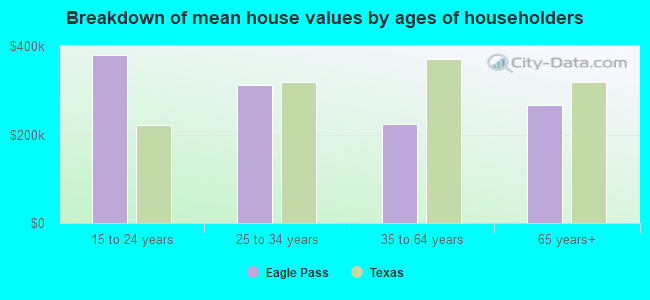
Lower value quartile - upper value quartile: $127,330 - $275,787Mean price in 2022: Detached houses: $214,121 Here:
$214,121State:
$369,058
Townhouses or other attached units: $141,892 Here:
$141,892State:
$327,631
In 3-to-4-unit structures: $138,704 Here:
$138,704State:
$209,652
Total population: 28,329 (Urban population: 22,746 (all inside urban clusters), Rural population: 90 (all nonfarm) )
Houses: 10,656 (9,527 occupied: 5,457 owner occupied, 4,212 renter occupied )
% of renters here:
44%State:
38%
Housing density: 1,441 houses/condos per square mile
Median price asked for vacant for-sale houses and condos in 2022: $177,575.
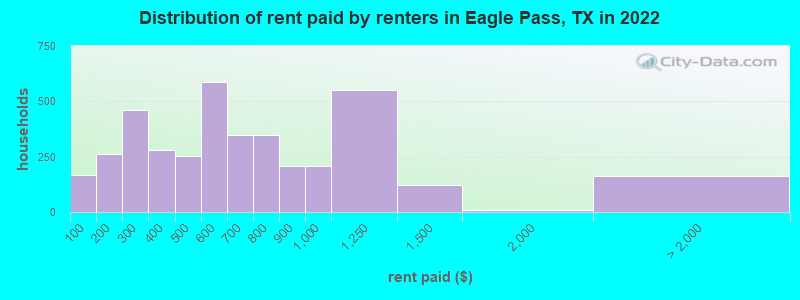
Median contract rent in 2022: $589 (lower quartile is $335, upper quartile is $899)
Median rent asked for vacant for-rent units in 2022: $661
Median gross rent in Eagle Pass, TX in 2022: $752
Housing units in Eagle Pass with a mortgage: 3,225 (64 second mortgage, 8 home equity loan, 27 both second mortgage and home equity loan )Houses without a mortgage: 0
Median household income for houses/condos with a mortgage: $92,146
Median household income for apartments without a mortgage: $59,848
Median monthly housing costs: $916
Data:
Median house or condo value ($)
Median house or condo value ($ change since 2000)
Median house or condo value ($) - White
Median house or condo value ($) - Black or African American
Median house or condo value ($) - Asian
Median house or condo value ($) - Hispanic or Latino
Median house or condo value ($) - American Indian and Alaska Native
Median house or condo value ($) - Multirace
Median house or condo value ($) - Other Race
Median price asked for mobile homes ($)
Household density (households per square mile)
Mean house or condo value by units in structure - 1, detached ($)
Mean house or condo value by units in structure - 1, attached ($)
Mean house or condo value by units in structure - 2 ($)
Mean house or condo value by units in structure by units in structure - 3 or 4 ($)
Mean house or condo value by units in structure - 5 or more ($)
Mean house or condo value by units in structure - Boat, RV, van, etc. ($)
Mean house or condo value by units in structure - Mobile home ($)
Median contract rent ($)
Median contract rent - Lower quartile ($)
Median contract rent - Upper quartile ($)
Median gross rent ($)
Urban houses (%)
Rural houses (%)
Houses occupied (%)
Houses occupied (% change since 2000)
Houses owner occupied (%)
Houses owner occupied (% change since 2000)
Houses renter occupied (%)
Houses renter occupied (% change since 2000)
Vacant housing units - For rent (%)
Vacant housing units - For rent (% change since 2000)
Vacant housing units - For sale only (%)
Vacant housing units - For sale only (% change since 2000)
Vacant housing units - Rented or sold, not occupied (%)
Vacant housing units - Rented or sold, not occupied (% change since 2000)
Vacant housing units - For seasonal, recreational, or occasional use (%)
Vacant housing units - For seasonal, recreational, or occasional use (% change since 2000)
Vacant housing units - For migrant workers (%)
Vacant housing units - For migrant workers (% change since 2000)
Vacant housing units - Other vacant (%)
Vacant housing units - Other vacant (% change since 2000)
Median monthly housing costs ($)
Median household income for houses/condos with a mortgage ($)
Median household income for houses/condos without a mortgage ($)
Median household income ($)
Median household income ($) - White
Median household income ($) - Black or African American
Median household income ($) - Asian
Median household income ($) - Hispanic or Latino
Median household income ($) - American Indian and Alaska Native
Median household income ($) - Multirace
Median household income ($) - Other Race
Mortgage status - with mortgage (%)
Mortgage status - with second mortgage (%)
Mortgage status - with home equity loan (%)
Mortgage status - with both second mortgage and home equity loan (%)
Mortgage status - without a mortgage (%)
Median year house/condo built
Median year apartment built
Household type by relationship - Male householder living alone (%)
Household type by relationship - Male householder not living alone (%)
Household type by relationship - Female householder living alone (%)
Household type by relationship - Female householder not living alone (%)
Household type by relationship - Opposite-Sex spouse (%)
Household type by relationship - Same-Sex spouse (%)
Household type by relationship - Opposite-Sex unmarried partner (%)
Household type by relationship - Same-Sex unmarried partner (%)
Household type by relationship - In group quarters (%)
Size of family households - 2-person household (%)
Size of family households - 3-person household (%)
Size of family households - 4-person household (%)
Size of family households - 5-person household (%)
Size of family households - 6-person household (%)
Size of family households - 7-or-more-person household (%)
Size of nonfamily households - 1-person household (%)
Size of nonfamily households - 2-person household (%)
Size of nonfamily households - 3-person household (%)
Size of nonfamily households - 4-person household (%)
Size of nonfamily households - 5-person household (%)
Size of nonfamily households - 6-person household (%)
Size of nonfamily households - 7-or-moreperson household (%)
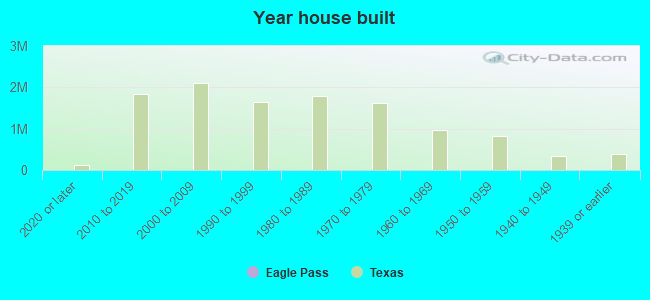
Year house built - Built 2010 or later (%)
Year house built - Built 2000 to 2009 (%)
Year house built - Built 1990 to 1999 (%)
Year house built - Built 1980 to 1989 (%)
Year house built - Built 1970 to 1979 (%)
Year house built - Built 1960 to 1969 (%)
Year house built - Built 1950 to 1959 (%)
Year house built - Built 1940 to 1949 (%)
Year house built - Built 1939 or earlier (%)
Median number of rooms in houses and condos
Median number of rooms in apartments
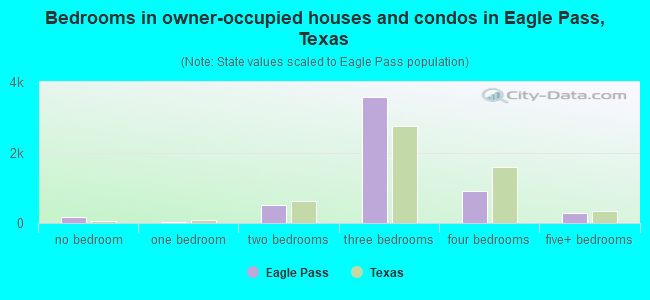
Median number of bedrooms in owner occupied houses
Mean number of bedrooms in owner occupied houses
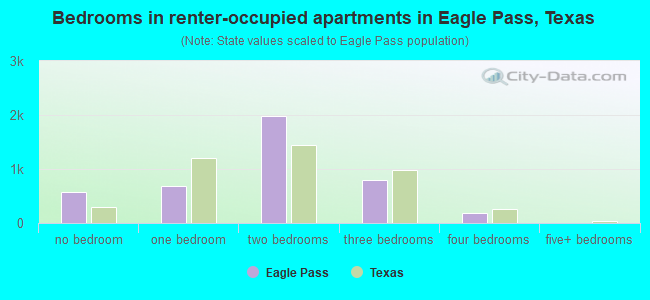
Median number of bedrooms in renter occupied houses
Mean number of bedrooms in renter occupied houses
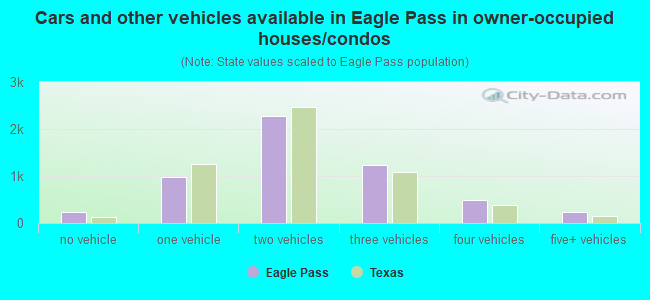
Median number of vehichles in owner occupied houses
Mean number of vehichles in owner occupied houses
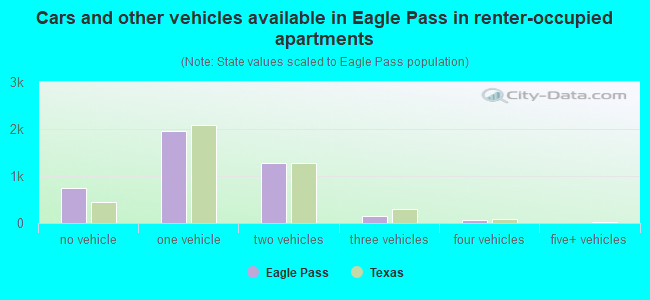
Median number of vehichles in renter occupied houses
Mean number of vehichles in renter occupied houses
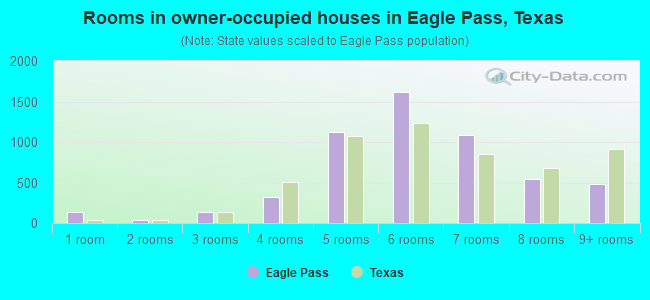
Rooms in owner-occupied houses - 1 room (%)
Rooms in owner-occupied houses - 2 rooms (%)
Rooms in owner-occupied houses - 3 rooms (%)
Rooms in owner-occupied houses - 4 rooms (%)
Rooms in owner-occupied houses - 5 rooms (%)
Rooms in owner-occupied houses - 6 rooms (%)
Rooms in owner-occupied houses - 7 rooms (%)
Rooms in owner-occupied houses - 8 rooms (%)
Rooms in owner-occupied houses - 9+ rooms (%)
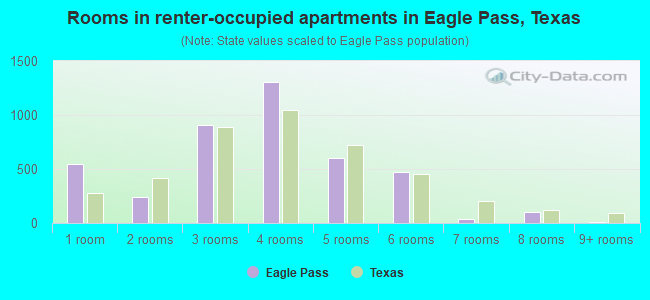
Rooms in renter-occupied houses - 1 room (%)
Rooms in renter-occupied houses - 2 rooms (%)
Rooms in renter-occupied houses - 3 rooms (%)
Rooms in renter-occupied houses - 4 rooms (%)
Rooms in renter-occupied houses - 5 rooms (%)
Rooms in renter-occupied houses - 6 rooms (%)
Rooms in renter-occupied houses - 7 rooms (%)
Rooms in renter-occupied houses - 8 rooms (%)
Rooms in renter-occupied houses - 9+ rooms (%)
Bedrooms in owner-occupied houses - no bedrooms (%)
Bedrooms in owner-occupied houses - 1 bedroom (%)
Bedrooms in owner-occupied houses - 2 bedrooms (%)
Bedrooms in owner-occupied houses - 3 bedrooms (%)
Bedrooms in owner-occupied houses - 4 bedrooms (%)
Bedrooms in owner-occupied houses - 5+ bedrooms (%)
Bedrooms in renter-occupied houses - no bedrooms (%)
Bedrooms in renter-occupied houses - 1 bedroom (%)
Bedrooms in renter-occupied houses - 2 bedrooms (%)
Bedrooms in renter-occupied houses - 3 bedrooms (%)
Bedrooms in renter-occupied houses - 4 bedrooms (%)
Bedrooms in renter-occupied houses - 5+ bedrooms (%)
Vehicles available in owner-occupied houses - no vehicle available (%)
Vehicles available in owner-occupied houses - 1 vehicle available(%)
Vehicles available in owner-occupied houses - 2 Vehicles available (%)
Vehicles available in owner-occupied houses - 3 Vehicles available (%)
Vehicles available in owner-occupied houses - 4 Vehicles available (%)
Vehicles available in owner-occupied houses - 5+ Vehicles available (%)
Vehicles available in renter-occupied houses - no vehicle available (%)
Vehicles available in renter-occupied houses - 1 vehicle available (%)
Vehicles available in renter-occupied houses - 2 Vehicles available (%)
Vehicles available in renter-occupied houses - 3 Vehicles available (%)
Vehicles available in renter-occupied houses - 4 Vehicles available (%)
Vehicles available in renter-occupied houses - 5+ Vehicles available (%)
Housing units in structures - 1, detached (%)
Housing units in structures - 1, attached (%)
Housing units in structures - 2 (%)
Housing units in structures - 3 or 4 (%)
Housing units in structures - 5 to 9 (%)
Housing units in structures - 10 to 19 (%)
Housing units in structures - 20 to 49 (%)
Housing units in structures - 50 or more (%)
Housing units in structures - Mobile home (%)
Housing units in structures - Boat, RV, van, etc. (%)
Housing units in structures - Owners - 1, detached (%)
Housing units in structures - Owners - 1, attached (%)
Housing units in structures - Owners - 2 (%)
Housing units in structures - Owners - 3 or 4 (%)
Housing units in structures - Owners - 5 to 9 (%)
Housing units in structures - Owners - 10 to 19 (%)
Housing units in structures - Owners - 20 to 49 (%)
Housing units in structures - Owners - 50 or more (%)
Housing units in structures - Owners - Mobile home (%)
Housing units in structures - Owners - Boat, RV, van, etc. (%)
Housing units in structures - Renters - 1, detached (%)
Housing units in structures - Renters - 1, attached (%)
Housing units in structures - Renters - 2 (%)
Housing units in structures - Renters - 3 or 4 (%)
Housing units in structures - Renters - 5 to 9 (%)
Housing units in structures - Renters - 10 to 19 (%)
Housing units in structures - Renters - 20 to 49 (%)
Housing units in structures - Renters - 50 or more (%)
Housing units in structures - Renters - Mobile home (%)
Housing units in structures - Renters - Boat, RV, van, etc. (%)
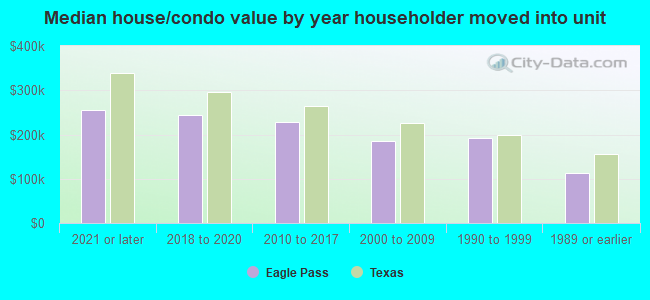
House/condo owner moved in on average (years ago)
Renter moved in on average (years ago)
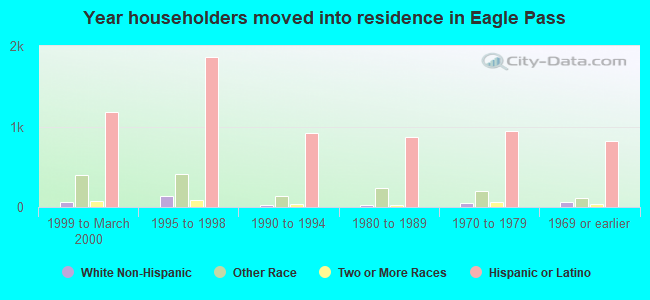
Year householder moved into unit - Moved in 1999 to March 2000 (%)
Year householder moved into unit - Moved in 1999 to March 2000 (%) - White
Year householder moved into unit - Moved in 1999 to March 2000 (%) - Black or African American
Year householder moved into unit - Moved in 1999 to March 2000 (%) - Asian
Year householder moved into unit - Moved in 1999 to March 2000 (%) - Hispanic or Latino
Year householder moved into unit - Moved in 1999 to March 2000 (%) - American Indian and Alaska Native
Year householder moved into unit - Moved in 1999 to March 2000 (%) - Multirace
Year householder moved into unit - Moved in 1999 to March 2000 (%) - Other Race
Year householder moved into unit - Moved in 1995 to 1998 (%)
Year householder moved into unit - Moved in 1995 to 1998 (%) - White
Year householder moved into unit - Moved in 1995 to 1998 (%) - Black or African American
Year householder moved into unit - Moved in 1995 to 1998 (%) - Asian
Year householder moved into unit - Moved in 1995 to 1998 (%) - Hispanic or Latino
Year householder moved into unit - Moved in 1995 to 1998 (%) - American Indian and Alaska Native
Year householder moved into unit - Moved in 1995 to 1998 (%) - Multirace
Year householder moved into unit - Moved in 1995 to 1998 (%) - Other Race
Year householder moved into unit - Moved in 1990 to 1994 (%)
Year householder moved into unit - Moved in 1990 to 1994 (%) - White
Year householder moved into unit - Moved in 1990 to 1994 (%) - Black or African American
Year householder moved into unit - Moved in 1990 to 1994 (%) - Asian
Year householder moved into unit - Moved in 1990 to 1994 (%) - Hispanic or Latino
Year householder moved into unit - Moved in 1990 to 1994 (%) - American Indian and Alaska Native
Year householder moved into unit - Moved in 1990 to 1994 (%) - Multirace
Year householder moved into unit - Moved in 1990 to 1994 (%) - Other Race
Year householder moved into unit - Moved in 1980 to 1989 (%)
Year householder moved into unit - Moved in 1980 to 1989 (%) - White
Year householder moved into unit - Moved in 1980 to 1989 (%) - Black or African American
Year householder moved into unit - Moved in 1980 to 1989 (%) - Asian
Year householder moved into unit - Moved in 1980 to 1989 (%) - Hispanic or Latino
Year householder moved into unit - Moved in 1980 to 1989 (%) - American Indian and Alaska Native
Year householder moved into unit - Moved in 1980 to 1989 (%) - Multirace
Year householder moved into unit - Moved in 1980 to 1989 (%) - Other Race
Year householder moved into unit - Moved in 1970 to 1979 (%)
Year householder moved into unit - Moved in 1970 to 1979 (%) - White
Year householder moved into unit - Moved in 1970 to 1979 (%) - Black or African American
Year householder moved into unit - Moved in 1970 to 1979 (%) - Asian
Year householder moved into unit - Moved in 1970 to 1979 (%) - Hispanic or Latino
Year householder moved into unit - Moved in 1970 to 1979 (%) - American Indian and Alaska Native
Year householder moved into unit - Moved in 1970 to 1979 (%) - Multirace
Year householder moved into unit - Moved in 1970 to 1979 (%) - Other Race
Year householder moved into unit - Moved in 1969 or earlier (%)
Year householder moved into unit - Moved in 1969 or earlier (%) - White
Year householder moved into unit - Moved in 1969 or earlier (%) - Black or African American
Year householder moved into unit - Moved in 1969 or earlier (%) - Asian
Year householder moved into unit - Moved in 1969 or earlier (%) - Hispanic or Latino
Year householder moved into unit - Moved in 1969 or earlier (%) - American Indian and Alaska Native
Year householder moved into unit - Moved in 1969 or earlier (%) - Multirace
Year householder moved into unit - Moved in 1969 or earlier (%) - Other Race
Housing units lacking complete plumbing facilities (%)
Housing units lacking complete kitchen facilities (%)
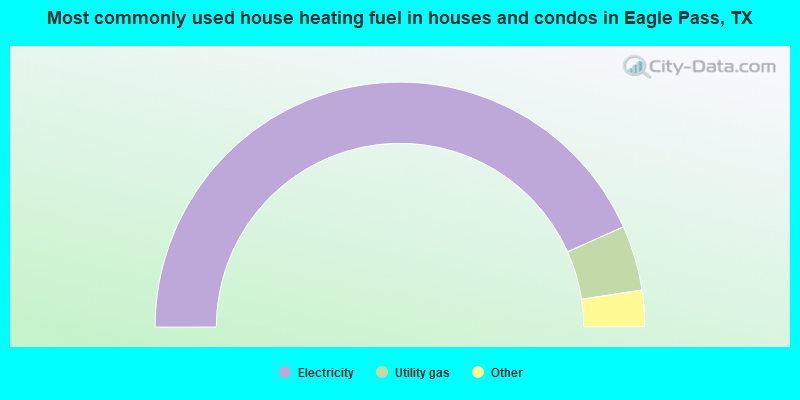
House heating fuel used in houses and condos - Utility gas (%)
House heating fuel used in houses and condos - Bottled, tank, or LP gas (%)
House heating fuel used in houses and condos - Electricity (%)
House heating fuel used in houses and condos - Fuel oil, kerosene, etc. (%)
House heating fuel used in houses and condos - Coal or coke (%)
House heating fuel used in houses and condos - Wood (%)
House heating fuel used in houses and condos - Solar energy (%)
House heating fuel used in houses and condos - Other fuel (%)
House heating fuel used in houses and condos - No fuel used (%)
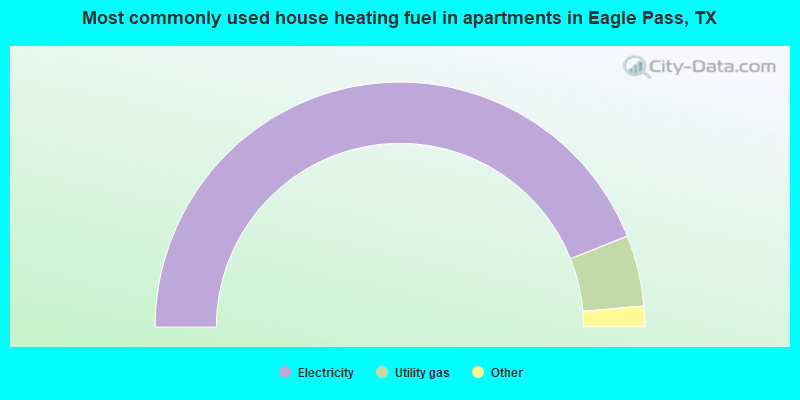
House heating fuel used in apartments - Utility gas (%)
House heating fuel used in apartments - Bottled, tank, or LP gas (%)
House heating fuel used in apartments - Electricity (%)
House heating fuel used in apartments - Fuel oil, kerosene, etc. (%)
House heating fuel used in apartments - Coal or coke (%)
House heating fuel used in apartments - Wood (%)
House heating fuel used in apartments - Solar energy (%)
House heating fuel used in apartments - Other fuel (%)
House heating fuel used in apartments - No fuel used (%)
Median year house/condo built: 1995Median year apartment built: 1982Household type by relationship:
Households: 28,923
Male householders: 4,338 (714 living alone ), Female householders: 5,057 (1,014 living alone )4,947 spouses (4,835 opposite-sex spouses ), 203 unmarried partners , (183 opposite-sex unmarried partners ), 11,488 children (11,127 natural , 26 adopted , 334 stepchildren ), 1,148 grandchildren , 256 brothers or sisters , 459 parents , 0 foster children , 618 other relatives , 94 non-relatives In group quarters: 311
Size of family households: 2,243 2-persons , 2,102 3-persons , 1,538 4-persons , 1,144 5-persons , 395 6-persons , 122 7-or-more-persons .
Size of nonfamily households: 1,822 1-person , 229 2-persons .
4,248 married couples with children. single-parent households (440 men , 2,520 women ).
13.5% of residents of Eagle Pass speak English at home. of residents speak Spanish at home (62% speak English very well , 17% speak English well , 10% speak English not well , 11% don't speak English at all ).of residents speak Asian or Pacific Island language at home (41% speak English very well , 59% speak English well ).
Foreign born population: 8,484 (29.3%)of them are naturalized citizens )
Median number of rooms in houses and condos:
Median number of rooms in apartments
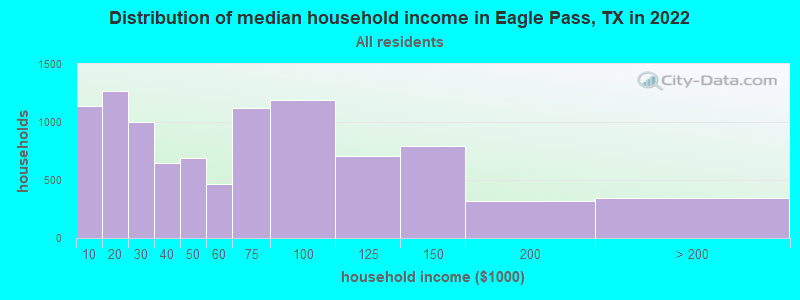
Eagle Pass, TX household income distribution 1,136 Less than $10,0001,266 $10,000 to $19,9991,001 $20,000 to $29,999649 $30,000 to $39,999689 $40,000 to $49,999468 $50,000 to $59,9991,118 $60,000 to $74,9991,191 $75,000 to $99,999708 $100,000 to $124,999792 $125,000 to $149,999323 $150,000 to $199,999342 $200,000 or more
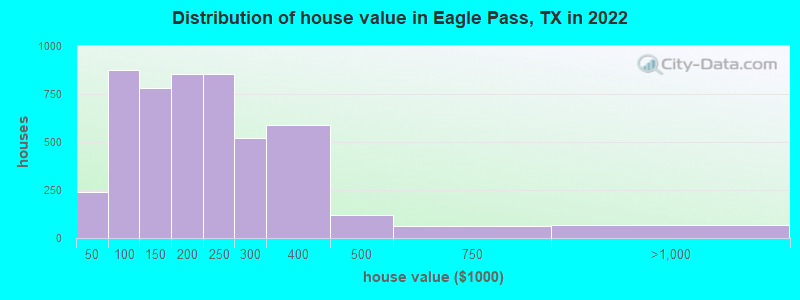
Home value of owner - occupied houses in 2022 in Eagle Pass, TX 7 Less than $10,00012 $10,000 to $14,9999 $15,000 to $19,9996 $20,000 to $24,99927 $30,000 to $34,99948 $35,000 to $39,999123 $40,000 to $49,9998 $50,000 to $59,99941 $60,000 to $69,999294 $70,000 to $79,999259 $80,000 to $89,999146 $90,000 to $99,999379 $100,000 to $124,999402 $125,000 to $149,999562 $150,000 to $174,999291 $175,000 to $199,999852 $200,000 to $249,999523 $250,000 to $299,999591 $300,000 to $399,999118 $400,000 to $499,99961 $500,000 to $749,99969 $750,000 to $999,999Rent paid by renters in 2022 in Eagle Pass, TX 168 Less than $100163 $100 to $14997 $150 to $199338 $200 to $249120 $250 to $29980 $300 to $349198 $350 to $399144 $400 to $449109 $450 to $499367 $500 to $549218 $550 to $599242 $600 to $649106 $650 to $699174 $700 to $749174 $750 to $799206 $800 to $899208 $900 to $999549 $1,000 to $1,249121 $1,250 to $1,49910 $1,500 to $1,999164 No cash rent
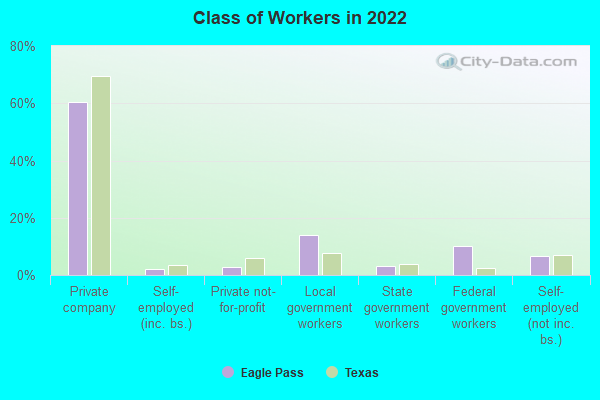
Percentage of workers working in this county: 86.8%Number of people working at home: 893 (7.2% of all workers )
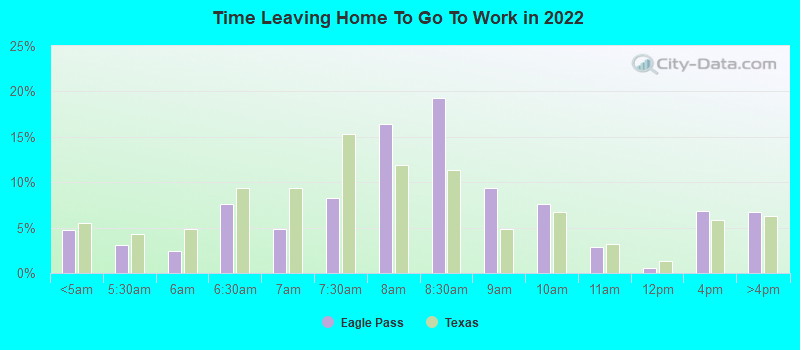
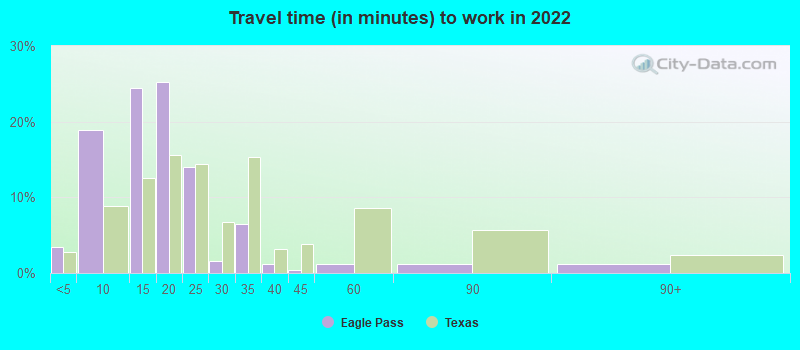
Travel time to work (commute)
Less than 5 minutes: 7115 to 9 minutes: 1,97310 to 14 minutes: 2,28715 to 19 minutes: 2,85720 to 24 minutes: 1,12625 to 29 minutes: 25030 to 34 minutes: 65735 to 39 minutes: 040 to 44 minutes: 11745 to 59 minutes: 30460 to 89 minutes: 43290 or more minutes: 467
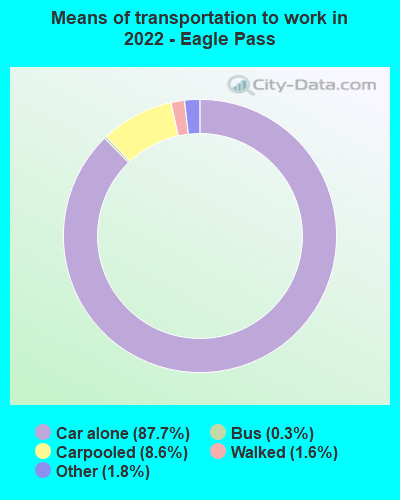
Means of transportation to work:
Drove a car alone: 12,287 (79.5%)Carpooled: 1,313 (8.5%)Bus : 31 (0.2%)Taxi: 318 (2.1%)Walked: 243 (1.6%)Worked at home: 893 (5.8%)
Unemployment by race in 2022
Unemployment rate for White non-Hispanic residents 2.9% FemalesUnemployment rate for other race residents 7.6% Males4.0% FemalesUnemployment rate for two or more race residents 6.8% Males6.3% FemalesUnemployment rate for Hispanic or Latino residents 6.4% Males5.1% Females
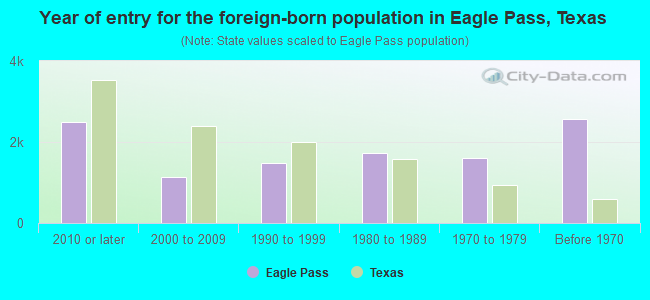
Year of entry for the foreign-born population in Eagle Pass, Texas
2,501 2010 or later 1,139 2000 to 2009 1,486 1990 to 1999 1,726 1980 to 1989 1,607 1970 to 1979 2,566 Before 1970
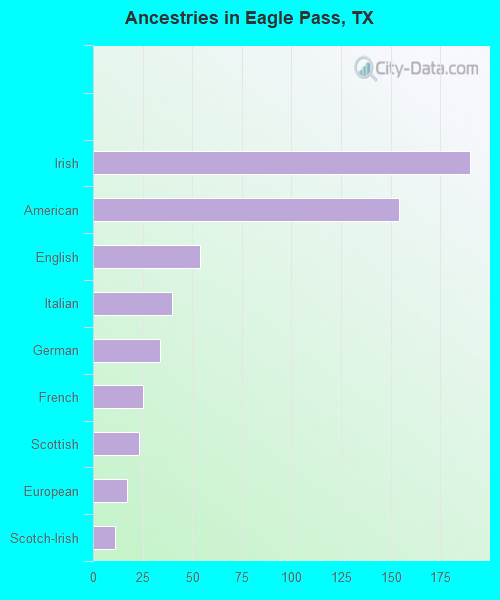
First ancestries reported:
Irish: 190 (0.8%)
American: 154 (0.6%)
English: 54 (0.2%)
Italian: 40 (0.2%)
German: 34 (0.1%)
French: 25 (0.1%)
Scottish: 23 (0.10%)
European: 17 (0.07%)
Scotch-Irish: 11 (0.05%) Most common places of birth for foreign-born residents (%): Mexico Eagle Pass:
92.7% (7,867)Texas:
48.4% (2,411,723)
Colombia Eagle Pass:
1.8% (149)Texas:
1.2% (61,555)
Place of birth for U.S.-born residents:
This state: 17,892Other state: 1,803Northeast: 22Midwest: 866South: 442West: 468 84.6% of Eagle Pass residents lived in the same house 1 years ago.
Out of people who lived in different houses, 34.5% lived in this county.
Out of people who lived in different counties, 95.5% lived in Texas.
Eagle Pass:
84.6%State average:
85.7%
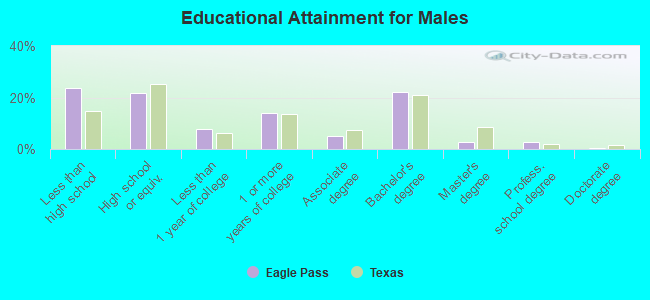
Education attainment for males 25 years and older:
No schooling: 299Nursery to 4th grade: 1815th and 6th grade: 3507th and 8th grade: 2549th grade: 26110th grade: 15411th grade: 12912th grade, no diploma: 278High school graduate (or equivalency): 1,728Less than 1 year of college: 627Some college more than 1 year, no degree: 1,116Associate degree: 406Bachelor's degree: 1,755Master's degree: 219Professional school degree: 202Doctorate degree: 34
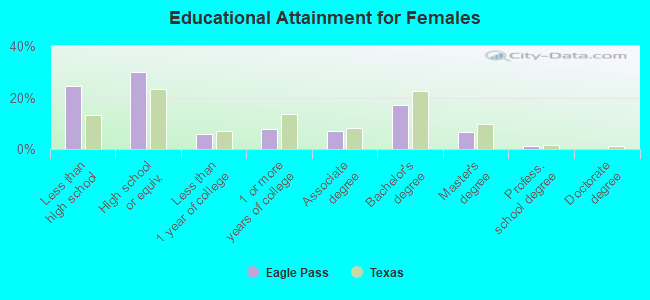
Education attainment for females 25 years and older:
No schooling: 249Nursery to 4th grade: 3385th and 6th grade: 2797th and 8th grade: 1629th grade: 40710th grade: 11411th grade: 38112th grade, no diploma: 250High school graduate (or equivalency): 2,676Less than 1 year of college: 523Some college more than 1 year, no degree: 706Associate degree: 608Bachelor's degree: 1,531Master's degree: 587Professional school degree: 101Doctorate degree: 1
Housing units in structures:
One, detached: 7,311One, attached: 315Two: 5613 or 4: 8475 to 9: 29410 to 19: 61120 to 49: 49150 or more: 122Mobile homes: 100Housing units lacking complete plumbing facilities in 2022: 3.5%Housing units lacking complete kitchen facilities in 2022: 4.5%House/condo owner moved in on average 15 years ago
Renter moved in on average 4 years ago
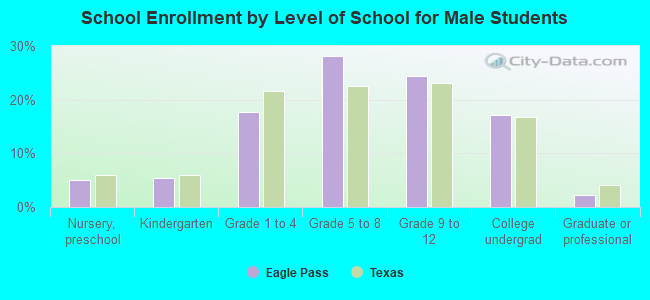
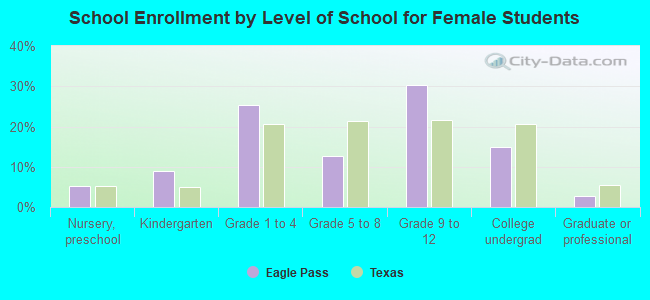
Private vs. public school enrollment:
Students in private schools in grades 1 to 8 (elementary and middle school): 11 Students in private schools in grades 9 to 12 (high school): 17 Students in private undergraduate colleges: 183