Everman, TX (Texas) Houses and Residents
| Everman: | $173,316 |
| Texas: | $275,400 |
Total population: 6,315 (Urban population: 5,790, Rural population: 57 (all nonfarm))
Houses: 2,485 (2,360 occupied: 1,363 owner occupied, 1,005 renter occupied)
| % of renters here: | 42% |
| State: | 38% |
Housing density: 1,253 houses/condos per square mile
Median price asked for vacant for-sale houses and condos in 2022 in this county: $307,354.
Median contract rent in 2022: $1,160
Median rent asked for vacant for-rent units in 2022: $4,041
Median gross rent in Everman, TX in 2022: $1,217
Housing units in Everman with a mortgage: 602 (8 second mortgage, 0 home equity loan, 0 both second mortgage and home equity loan)
Houses without a mortgage: 0
Median household income for houses/condos with a mortgage: $77,849
Median household income for apartments without a mortgage: $45,774
Median monthly housing costs: $1,082
Compare current foreclosures near Everman, TX:
| Photo | Address | Area | Beds / Baths | Price | Details |
|---|---|---|---|---|---|

|
#1
Bay Club Dr
Arlington, TX 76013
|
4,020 sq. feet
|
4 baths 4 beds |
$780,000
|
show details |

|
#2
Villa Milano Dr
Fort Worth, TX 76126
|
- sq. feet
|
4 baths 4 beds |
$999,900
|
show details |

|
#3
Juneau Rd
Fort Worth, TX 76116
|
2,302 sq. feet
|
2 baths 3 beds |
show details | |

|
#4
Matagorda Ln
Grand Prairie, TX 75052
|
3,670 sq. feet
|
2 baths 5 beds |
show details | |

|
#5
E Shaw St
Fort Worth, TX 76110
|
720 sq. feet
|
1 baths 3 beds |
show details | |

|
#6
Stonecreek Dr
Arlington, TX 76014
|
1,173 sq. feet
|
2 baths 3 beds |
show details | |

|
#7
Worthview Dr
Fort Worth, TX 76114
|
1,376 sq. feet
|
1 baths 3 beds |
show details | |

|
#8
Morningcrest Ct
Arlington, TX 76002
|
- sq. feet
|
2 baths 4 beds |
show details | |

|
#9
Derby Dr
Kennedale, TX 76060
|
2,447 sq. feet
|
2 baths 3 beds |
show details | |

|
#10
Meadowood Village Dr
Fort Worth, TX 76120
|
900 sq. feet
|
1 baths 2 beds |
show details |
| Photo | Address | Area | Beds / Baths | Price | Details |
|---|---|---|---|---|---|

|
#11
Winter Sunday Way
Arlington, TX 76012
|
2,264 sq. feet
|
2 baths 3 beds |
show details | |

|
#12
Springdale Ct
Fort Worth, TX 76148
|
2,002 sq. feet
|
2 baths 3 beds |
show details | |

|
#13
Sweet Flag Lane
Fort Worth, TX 76123
|
2,816 sq. feet
|
2 baths 4 beds |
show details | |

|
#14
Persimmon Dr
Grand Prairie, TX 75052
|
3,894 sq. feet
|
4 baths 5 beds |
show details | |

|
#15
Edgefield Rd
Fort Worth, TX 76107
|
2,660 sq. feet
|
3 baths 4 beds |
show details | |

|
#16
Wellington Dr
Grand Prairie, TX 75051
|
2,147 sq. feet
|
3 baths 4 beds |
show details | |

|
#17
Willoughby Ln Apt 4520
Arlington, TX 76011
|
1,025 sq. feet
|
2 baths 2 beds |
show details | |

|
#18
Lowe St
Fort Worth, TX 76110
|
1,348 sq. feet
|
2 baths 3 beds |
show details | |

|
#19
NE Rosamond St
Burleson, TX 76028
|
1,652 sq. feet
|
2 baths 3 beds |
show details | |

|
#20
Belle St
Bedford, TX 76022
|
1,462 sq. feet
|
2 baths 3 beds |
show details |
| Photo | Address | Area | Beds / Baths | Price | Details |
|---|---|---|---|---|---|

|
#21
Collins Rd
Burleson, TX 76028
|
- sq. feet
|
2 baths 3 beds |
show details | |

|
#22
Raptor Road
Alvarado, TX 76009
|
- sq. feet
|
2 baths 4 beds |
show details | |

|
#23
Forest Ln
Fort Worth, TX 76112
|
4,780 sq. feet
|
3 baths 5 beds |
show details | |

|
#24
Mayberry Ln
Fort Worth, TX 76123
|
3,468 sq. feet
|
3 baths 5 beds |
show details | |

|
#25
Waterlilly Dr
Arlington, TX 76002
|
1,936 sq. feet
|
2 baths 3 beds |
show details | |

|
#26
Perdido Dr
Fort Worth, TX 76148
|
- sq. feet
|
2 baths 3 beds |
show details | |

|
#27
Wilderness Trl
Grand Prairie, TX 75052
|
1,950 sq. feet
|
2 baths 3 beds |
show details | |

|
#28
Little Ranch Rd
North Richland Hills, TX 76182
|
2,889 sq. feet
|
2 baths 3 beds |
show details | |

|
#29
Shady Bend Dr
Kennedale, TX 76060
|
3,520 sq. feet
|
3 baths 4 beds |
show details | |

|
#30
Smilax Ave
Fort Worth, TX 76111
|
1,230 sq. feet
|
1 baths 3 beds |
show details |
| Photo | Address | Area | Beds / Baths | Price | Details |
|---|---|---|---|---|---|

|
#31
Melbourn St
Haltom City, TX 76117
|
968 sq. feet
|
1 baths 2 beds |
show details | |

|
#32
Aarons Ct
Venus, TX 76084
|
2,070 sq. feet
|
2 baths 5 beds |
show details | |

|
#33
Homewood Ln
Grand Prairie, TX 75050
|
1,600 sq. feet
|
3 baths 4 beds |
show details | |

|
#34
New Harbor Ln
Fort Worth, TX 76179
|
1,264 sq. feet
|
2 baths 3 beds |
show details | |

|
#35
S Meadow Dr E
Fort Worth, TX 76133
|
1,586 sq. feet
|
2 baths 3 beds |
show details | |

|
#36
Briley Dr
North Richland Hills, TX 76180
|
1,763 sq. feet
|
2 baths 3 beds |
show details | |

|
#37
Sagehill Dr
Fort Worth, TX 76123
|
1,916 sq. feet
|
2 baths 3 beds |
show details | |

|
#38
Southpark Ln
Fort Worth, TX 76133
|
- sq. feet
|
2 baths 4 beds |
show details | |

|
#39
Raintree Ct
Alvarado, TX 76009
|
2,171 sq. feet
|
2 baths 3 beds |
show details | |

|
#40
Grenada Dr
Fort Worth, TX 76119
|
3,141 sq. feet
|
2 baths 4 beds |
show details |
| Photo | Address | Area | Beds / Baths | Price | Details |
|---|---|---|---|---|---|

|
#41
Saddle Trl
Fort Worth, TX 76116
|
1,797 sq. feet
|
2 baths 3 beds |
show details | |

|
#42
Brazoria Trl
Fort Worth, TX 76126
|
1,893 sq. feet
|
2 baths 3 beds |
show details | |

|
#43
Vancil Ct
Arlington, TX 76018
|
2,741 sq. feet
|
3 baths 3 beds |
show details | |

|
#44
Baldwin St
Grand Prairie, TX 75052
|
2,056 sq. feet
|
2 baths 3 beds |
show details | |

|
#45
Pecan Chase Cir Apt 4
Arlington, TX 76012
|
558 sq. feet
|
1 baths 2 beds |
show details | |

|
#46
Walnut Ridge Dr
Midlothian, TX 76065
|
3,220 sq. feet
|
3 baths 5 beds |
show details | |

|
#47
Sunday St
Haltom City, TX 76117
|
1,160 sq. feet
|
1 baths 3 beds |
show details | |

|
#48
Sunday St
Haltom City, TX 76117
|
1,160 sq. feet
|
1 baths 3 beds |
show details | |

|
#49
Indian Hill Dr
Arlington, TX 76018
|
1,935 sq. feet
|
2 baths 3 beds |
show details | |

|
Check over 1 million property listings on Foreclosure.com!
|
browse all offers | |||

Latest news about housing in Everman, TX collected exclusively by city-data.com from local newspapers, TV, and radio stations

 | First time home buyer (most affordable town in the area) (6 replies) |
| General Relocation Advice! (37 replies) |
| Dallas Haters (153 replies) |
| potential nova/dc resident relocating to the area. What are the boundaries for the good and bad places to avoid living? (20 replies) |
| Relocating to Fort Worth and buy a house (9 replies) |
| Info on History Maker Homes (29 replies) |

Median year apartment built: 1974
Household type by relationship:
Households: 6,219- Male householders: 1,397 (383 living alone), Female householders: 918 (278 living alone)
1,041 spouses (1,041 opposite-sex spouses), 412 unmarried partners, (412 opposite-sex unmarried partners), 2,241 children (2,095 natural, 27 adopted, 118 stepchildren), 83 grandchildren, 26 brothers or sisters, 31 parents, 0 foster children, 0 other relatives, 45 non-relatives
- In group quarters: 20
Size of family households: 344 2-persons, 285 3-persons, 466 4-persons, 186 5-persons, 78 6-persons.
Size of nonfamily households: 716 1-person, 302 2-persons.
1,183 married couples with children.
439 single-parent households (75 men, 364 women).
61.4% of residents of Everman speak English at home.
39.4% of residents speak Spanish at home (67% speak English very well, 21% speak English well, 9% speak English not well, 2% don't speak English at all).
Foreign born population: 1,135 (18.3%)
(22.8% of them are naturalized citizens)
| Here: | 5.1 |
| State: | 6.3 |
| Here: | 4.7 |
| State: | 4.0 |

- Bedrooms in owner-occupied houses and condos in Everman, Texas
- 44no bedroom
- 01 bedroom
- 1812 bedrooms
- 9923 bedrooms
- 1464 bedrooms
- 05+ bedrooms

- Bedrooms in renter-occupied apartments in Everman, Texas
- 0no bedroom
- 2391 bedroom
- 3412 bedrooms
- 2963 bedrooms
- 1294 bedrooms
- 05+ bedrooms

- Cars and other vehicles available in Everman in owner-occupied houses/condos
- 39no vehicle
- 3901 vehicle
- 4252 vehicles
- 2973 vehicles
- 1684 vehicles
- 455+ vehicles

- Cars and other vehicles available in Everman in renter-occupied apartments
- 470no vehicle
- 2521 vehicle
- 1162 vehicles
- 1423 vehicles
- 254 vehicles
- 05+ vehicles

- Rooms in owner-occupied houses in Everman, Texas
- 441 room
- 02 rooms
- 403 rooms
- 2194 rooms
- 5165 rooms
- 3286 rooms
- 737 rooms
- 408 rooms
- 1049+ rooms

- Rooms in renter-occupied apartments in Everman, Texas
- 01 room
- 312 rooms
- 1223 rooms
- 1974 rooms
- 4375 rooms
- 1316 rooms
- 507 rooms
- 368 rooms
- 09+ rooms


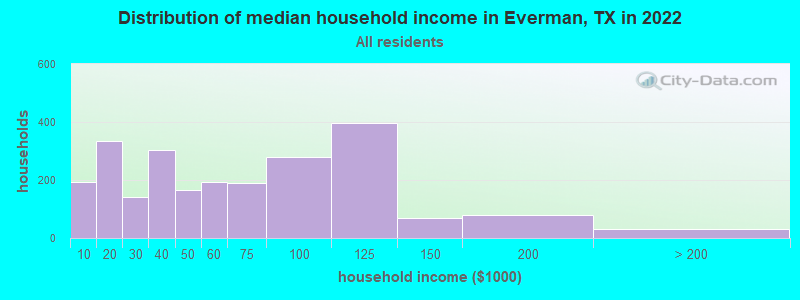
Everman, TX household income distribution

- 192Less than $10,000
- 334$10,000 to $19,999
- 141$20,000 to $29,999
- 304$30,000 to $39,999
- 164$40,000 to $49,999
- 194$50,000 to $59,999
- 188$60,000 to $74,999
- 281$75,000 to $99,999
- 396$100,000 to $124,999
- 69$125,000 to $149,999
- 78$150,000 to $199,999
- 31$200,000 or more
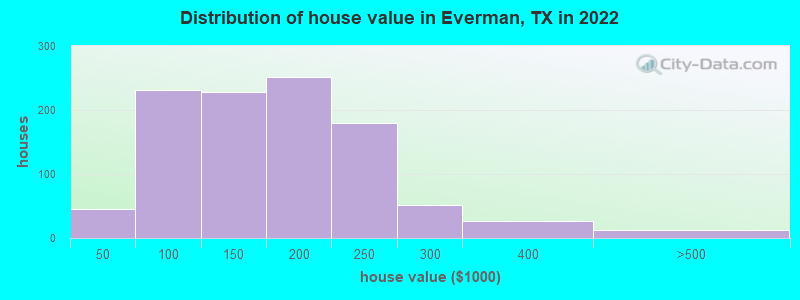
Home value of owner - occupied houses in 2022 in Everman, TX
-
- 45$40,000 to $49,999
- 26$50,000 to $59,999
- 22$60,000 to $69,999
- 16$70,000 to $79,999
- 59$80,000 to $89,999
- 61$90,000 to $99,999
- 87$100,000 to $124,999
- 139$125,000 to $149,999
- 122$150,000 to $174,999
- 127$175,000 to $199,999
- 179$200,000 to $249,999
- 51$250,000 to $299,999
- 27$300,000 to $399,999
- 12$400,000 to $499,999
Rent paid by renters in 2022 in Everman, TX
-
- 19$200 to $249
- 86$250 to $299
- 13$550 to $599
- 31$800 to $899
- 10$900 to $999
- 467$1,000 to $1,249
- 159$1,250 to $1,499
- 93$1,500 to $1,999
- 41No cash rent


Percentage of workers working in this county: 87.2%
Number of people working at home: 107 (4.3% of all workers)
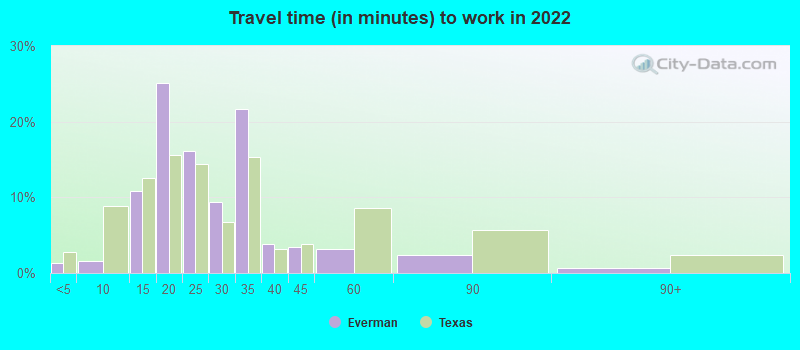
Travel time to work (commute)
- Less than 5 minutes: 0
- 5 to 9 minutes: 145
- 10 to 14 minutes: 347
- 15 to 19 minutes: 308
- 20 to 24 minutes: 562
- 25 to 29 minutes: 236
- 30 to 34 minutes: 268
- 35 to 39 minutes: 84
- 40 to 44 minutes: 96
- 45 to 59 minutes: 168
- 60 to 89 minutes: 88
- 90 or more minutes: 24
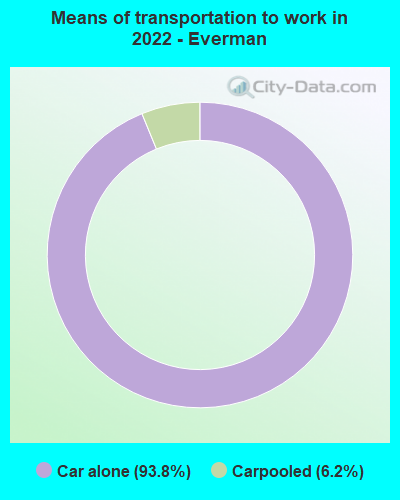
Means of transportation to work:
- Drove a car alone: 1,491 (84.9%)
- Carpooled: 102 (5.8%)
- Worked at home: 107 (6.1%)

- Unemployment by race in 2022
- Unemployment rate for White non-Hispanic residents
- 3.8%Males
- 6.8%Females
- Unemployment rate for Black residents
- 37.4%Males
- Unemployment rate for Hispanic or Latino residents
- 5.6%Females

- Year of entry for the foreign-born population in Everman, Texas
- 3302010 or later
- 2832000 to 2009
- 2651990 to 1999
- 2411980 to 1989
- 881970 to 1979
- 12Before 1970

First ancestries reported:
- American: 308 (7.5%)
- German: 79 (1.9%)
- Irish: 73 (1.8%)
- English: 72 (1.8%)
- European: 36 (0.9%)
- African: 26 (0.6%)
- Ukrainian: 23 (0.6%)
- Italian: 13 (0.3%)
- Polish: 11 (0.3%)
- Scottish: 8 (0.2%)
- Norwegian: 6 (0.1%)
Most common places of birth for foreign-born residents (%):
| Everman: | 87.3% (1,007) |
| Texas: | 48.4% (2,411,723) |
| Everman: | 3.7% (43) |
| Texas: | 0.0% (1,963) |
| Everman: | 2.9% (34) |
| Texas: | 0.2% (9,654) |
Place of birth for U.S.-born residents:
- This state: 4,091
- Other state: 840
- Northeast: 217
- Midwest: 237
- South: 244
- West: 131
86.2% of Everman residents lived in the same house 1 years ago.
Out of people who lived in different houses, 46.2% lived in this county.
Out of people who lived in different counties, 100.0% lived in Texas.
| Everman: | 86.2% |
| State average: | 85.7% |
Education attainment for males 25 years and older:
- No schooling: 241
- Nursery to 4th grade: 23
- 5th and 6th grade: 48
- 7th and 8th grade: 43
- 9th grade: 39
- 10th grade: 26
- 11th grade: 129
- 12th grade, no diploma: 18
- High school graduate (or equivalency): 730
- Less than 1 year of college: 111
- Some college more than 1 year, no degree: 315
- Associate degree: 52
- Bachelor's degree: 217
- Master's degree: 91
- Professional school degree: 0
- Doctorate degree: 0

Education attainment for females 25 years and older:
- No schooling: 126
- Nursery to 4th grade: 8
- 5th and 6th grade: 30
- 7th and 8th grade: 25
- 9th grade: 47
- 10th grade: 32
- 11th grade: 51
- 12th grade, no diploma: 26
- High school graduate (or equivalency): 719
- Less than 1 year of college: 199
- Some college more than 1 year, no degree: 409
- Associate degree: 161
- Bachelor's degree: 131
- Master's degree: 48
- Professional school degree: 0
- Doctorate degree: 0


Housing units in structures:
- One, detached: 1,821
- One, attached: 40
- 3 or 4: 46
- 5 to 9: 101
- 10 to 19: 124
- 20 to 49: 206
- 50 or more: 143
Housing units lacking complete kitchen facilities in 2022: 2.9%
House/condo owner moved in on average 18 years ago
Renter moved in on average 3 years ago

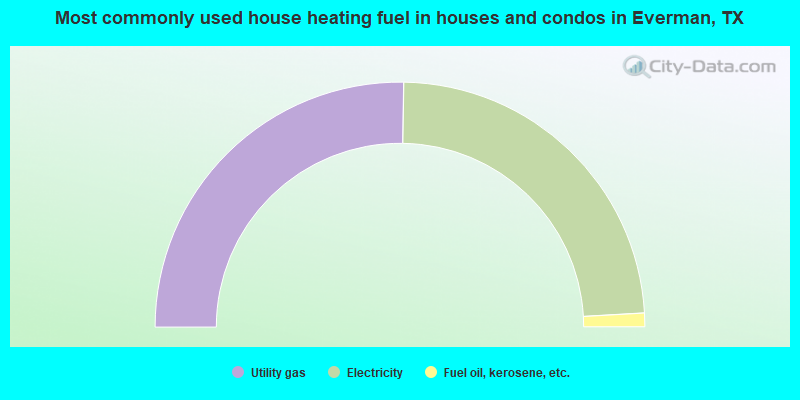
- 50.5%Utility gas
- 47.7%Electricity
- 1.8%Fuel oil, kerosene, etc.
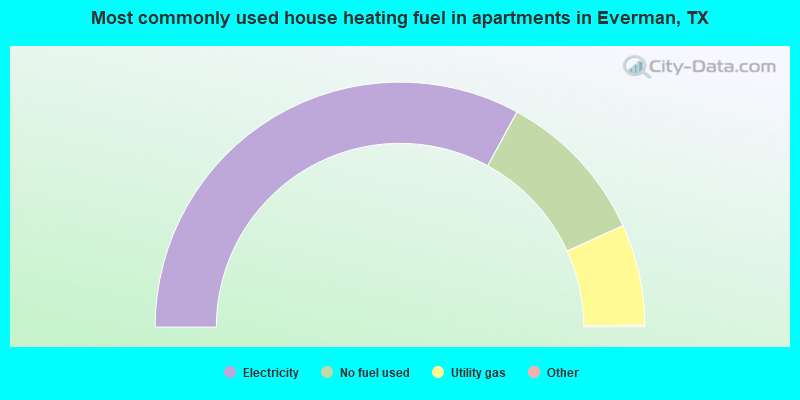
- 66.0%Electricity
- 20.6%No fuel used
- 13.4%Utility gas
Private vs. public school enrollment:
| Here: | 9.6% |
| Texas: | 8.8% |
| Here: | 8.7% |
| Texas: | 8.0% |
| Here: | 0.0% |
| Texas: | 16.2% |


