Gaithersburg, MD (Maryland) Houses and Residents
| Gaithersburg: | $513,800 |
| Maryland: | $398,100 |
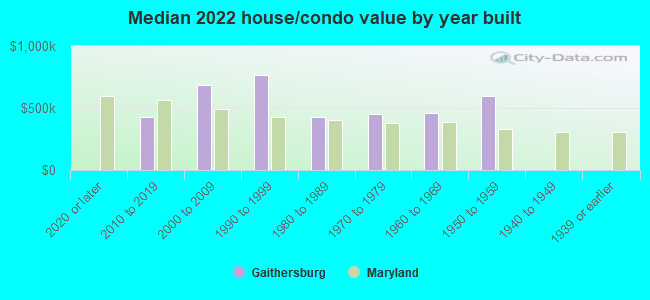
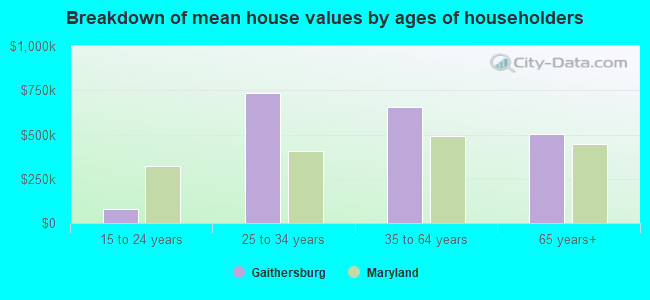
Mean price in 2022:
Detached houses: $682,672
Here: $682,672 State: $526,819 Townhouses or other attached units: $417,251
Here: $417,251 State: $328,305 In 2-unit structures: $400,848
Here: $400,848 State: $346,599 In 3-to-4-unit structures: $253,966
Here: $253,966 State: $295,378 In 5-or-more-unit structures: $295,733
Here: $295,733 State: $350,378
Total population: 66,816 (Urban population: 52,780, Rural population: 0)
Houses: 25,264 (24,523 occupied: 12,557 owner occupied, 11,966 renter occupied)
| % of renters here: | 49% |
| State: | 32% |
Housing density: 2,505 houses/condos per square mile
Median price asked for vacant for-sale houses and condos in 2022: $503,776.
Median contract rent in 2022: $1,770 (lower quartile is $1,421, upper quartile is over $2,000)
Median rent asked for vacant for-rent units in 2022: $1,519
Median gross rent in Gaithersburg, MD in 2022: $1,916
Housing units in Gaithersburg with a mortgage: 9,594 (1,493 second mortgage, 0 home equity loan, 1,156 both second mortgage and home equity loan)
Houses without a mortgage: 117
Median household income for houses/condos with a mortgage: $137,068
Median household income for apartments without a mortgage: $106,778
Median monthly housing costs: $1,946
Compare current foreclosures in Gaithersburg, MD:
| Photo | Address | Area | Beds / Baths | Price | Details |
|---|---|---|---|---|---|

|
#1
Brooke Knolls Rd
Gaithersburg, MD 20882
|
1,704 sq. feet
|
3 baths 4 beds |
$681,500
|
show details |

|
#2
Brink Rd
Gaithersburg, MD 20882
|
1,758 sq. feet
|
1 baths 2 beds |
show details | |

|
#3
Kildonan Dr
Gaithersburg, MD 20879
|
864 sq. feet
|
2 baths - beds |
show details | |

|
#4
Emory Grove Rd
Gaithersburg, MD 20877
|
1,608 sq. feet
|
3 baths - beds |
show details | |

|
#5
Stableview Ct
Gaithersburg, MD 20882
|
3,916 sq. feet
|
5 baths - beds |
show details | |

|
#6
Carlsbad Dr
Gaithersburg, MD 20879
|
1,584 sq. feet
|
4 baths - beds |
show details | |

|
#7
Whitcliff Ct
Gaithersburg, MD 20878
|
1,408 sq. feet
|
3 baths - beds |
show details | |

|
#8
Mayhill Ter
Gaithersburg, MD 20879
|
1,776 sq. feet
|
3 baths - beds |
show details | |

|
#9
Sullnick Way
Gaithersburg, MD 20878
|
1,386 sq. feet
|
4 baths - beds |
show details | |

|
#10
Bayridge Ter
Gaithersburg, MD 20878
|
1,360 sq. feet
|
3 baths - beds |
show details |
| Photo | Address | Area | Beds / Baths | Price | Details |
|---|---|---|---|---|---|

|
#11
E Deer Park Dr
Gaithersburg, MD 20877
|
2,297 sq. feet
|
2 baths - beds |
show details | |

|
#12
Jarl Dr
Gaithersburg, MD 20882
|
1,504 sq. feet
|
3 baths - beds |
show details | |

|
#13
Darnestown Rd
Gaithersburg, MD 20878
|
3,072 sq. feet
|
4 baths - beds |
show details | |

|
#14
Green Run Way
Gaithersburg, MD 20879
|
2,145 sq. feet
|
3 baths - beds |
show details | |

|
#15
Cedar Ave
Gaithersburg, MD 20877
|
1,064 sq. feet
|
2 baths - beds |
show details | |

|
#16
Hipsley Mill Rd
Gaithersburg, MD 20882
|
3,762 sq. feet
|
5 baths - beds |
show details | |

|
#17
Damson Ter
Gaithersburg, MD 20878
|
3,068 sq. feet
|
4 baths - beds |
show details | |

|
#18
Portside Ct
Gaithersburg, MD 20877
|
1,260 sq. feet
|
4 baths - beds |
show details | |

|
#19
Primula Dr
Gaithersburg, MD 20882
|
4,676 sq. feet
|
3 baths - beds |
show details | |

|
#20
Nightingale St
Gaithersburg, MD 20882
|
1,280 sq. feet
|
2 baths - beds |
show details |
| Photo | Address | Area | Beds / Baths | Price | Details |
|---|---|---|---|---|---|

|
#21
Stonecutter Ct
Gaithersburg, MD 20878
|
2,656 sq. feet
|
2 baths - beds |
show details | |

|
#22
Brink Rd
Gaithersburg, MD 20882
|
1,770 sq. feet
|
1 baths - beds |
show details | |

|
#23
Mountain Laurel Ln
Gaithersburg, MD 20879
|
1,544 sq. feet
|
2 baths - beds |
show details | |

|
#24
Flower Hill Ter
Gaithersburg, MD 20879
|
1,680 sq. feet
|
2 baths - beds |
show details | |

|
#25
Larchmont Ter
Gaithersburg, MD 20877
|
1,240 sq. feet
|
3 baths - beds |
show details | |

|
#26
Cottonwood Ter
Gaithersburg, MD 20877
|
1,320 sq. feet
|
2 baths - beds |
show details | |

|
#27
Dodie Dr
Gaithersburg, MD 20878
|
4,020 sq. feet
|
4 baths - beds |
show details | |

|
#28
Washington Grove Ln
Gaithersburg, MD 20877
|
2,304 sq. feet
|
4 baths - beds |
show details | |

|
#29
Emory Grove Rd
Gaithersburg, MD 20877
|
2,501 sq. feet
|
3 baths - beds |
show details | |

|
#30
Mountain Laurel Ter
Gaithersburg, MD 20879
|
1,120 sq. feet
|
2 baths - beds |
show details |
| Photo | Address | Area | Beds / Baths | Price | Details |
|---|---|---|---|---|---|

|
#31
Shady Spring Dr
Gaithersburg, MD 20877
|
1,008 sq. feet
|
1 baths - beds |
show details | |

|
#32
Palmspring Dr Apt 12
Gaithersburg, MD 20878
|
864 sq. feet
|
1 baths - beds |
show details | |

|
#33
Belle Grove Rd
Gaithersburg, MD 20877
|
1,973 sq. feet
|
2 baths - beds |
show details | |

|
#34
Filbert Ter
Gaithersburg, MD 20879
|
1,180 sq. feet
|
1 baths - beds |
show details | |

|
#35
Amber Tree Ct Apt 101
Gaithersburg, MD 20878
|
1,088 sq. feet
|
1 baths - beds |
show details | |

|
#36
Mourning Dove Ct
Gaithersburg, MD 20879
|
1,760 sq. feet
|
2 baths - beds |
show details | |

|
#37
Cross Tie Ct
Gaithersburg, MD 20879
|
1,670 sq. feet
|
3 baths - beds |
show details | |

|
#38
Alliston Hollow Way
Gaithersburg, MD 20879
|
2,468 sq. feet
|
2 baths - beds |
show details | |

|
#39
Griffith Rd
Gaithersburg, MD 20882
|
12,443 sq. feet
|
7 baths - beds |
show details | |

|
#40
Grosbeak Ter
Gaithersburg, MD 20879
|
1,426 sq. feet
|
2 baths - beds |
show details |
| Photo | Address | Area | Beds / Baths | Price | Details |
|---|---|---|---|---|---|

|
#41
Gardenia Way
Gaithersburg, MD 20879
|
1,760 sq. feet
|
2 baths - beds |
show details | |

|
#42
Midline Rd
Gaithersburg, MD 20878
|
1,280 sq. feet
|
2 baths - beds |
show details | |

|
#43
Hidden Ponds Way
Gaithersburg, MD 20878
|
6,217 sq. feet
|
4 baths - beds |
show details | |

|
#44
Hummingbird Ter
Gaithersburg, MD 20879
|
1,472 sq. feet
|
2 baths - beds |
show details | |

|
#45
Montgomery Ave
Gaithersburg, MD 20882
|
1,978 sq. feet
|
2 baths - beds |
show details | |

|
#46
Trams Way
Gaithersburg, MD 20879
|
1,928 sq. feet
|
3 baths - beds |
show details | |

|
#47
Gold Kettle Dr
Gaithersburg, MD 20878
|
1,400 sq. feet
|
2 baths - beds |
show details | |

|
#48
Cottonwood Ter
Gaithersburg, MD 20877
|
1,776 sq. feet
|
2 baths - beds |
show details | |

|
#49
Hallmark Pl
Gaithersburg, MD 20879
|
1,200 sq. feet
|
1 baths - beds |
show details | |

|
Check over 1 million property listings on Foreclosure.com!
|
browse all offers | |||

Latest news about housing in Gaithersburg, MD collected exclusively by city-data.com from local newspapers, TV, and radio stations


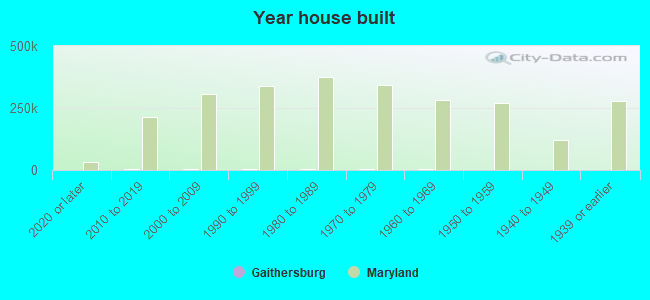
Median year apartment built: 1989
Household type by relationship:
Households: 68,952- Male householders: 12,357 (2,346 living alone), Female householders: 12,166 (4,887 living alone)
10,957 spouses (10,802 opposite-sex spouses), 1,875 unmarried partners, (1,683 opposite-sex unmarried partners), 19,324 children (18,883 natural, 108 adopted, 333 stepchildren), 933 grandchildren, 1,539 brothers or sisters, 1,860 parents, 0 foster children, 4,718 other relatives, 2,859 non-relatives
- In group quarters: 364
Size of family households: 5,544 2-persons, 3,578 3-persons, 2,394 4-persons, 2,089 5-persons, 888 6-persons, 840 7-or-more-persons.
Size of nonfamily households: 7,233 1-person, 1,616 2-persons, 154 3-persons, 187 4-persons.
11,095 married couples with children.
2,639 single-parent households (522 men, 2,117 women).
46.8% of residents of Gaithersburg speak English at home.
23.3% of residents speak Spanish at home (44% speak English very well, 20% speak English well, 24% speak English not well, 12% don't speak English at all).
12.4% of residents speak other Indo-European language at home (69% speak English very well, 19% speak English well, 10% speak English not well, 2% don't speak English at all).
14.6% of residents speak Asian or Pacific Island language at home (52% speak English very well, 23% speak English well, 20% speak English not well, 5% don't speak English at all).
3.4% of residents speak other language at home (82% speak English very well, 10% speak English well, 4% speak English not well, 4% don't speak English at all).
Foreign born population: 28,433 (41.2%)
(38.7% of them are naturalized citizens)
| Here: | 7.0 |
| State: | 7.3 |
| Here: | 4.3 |
| State: | 4.2 |
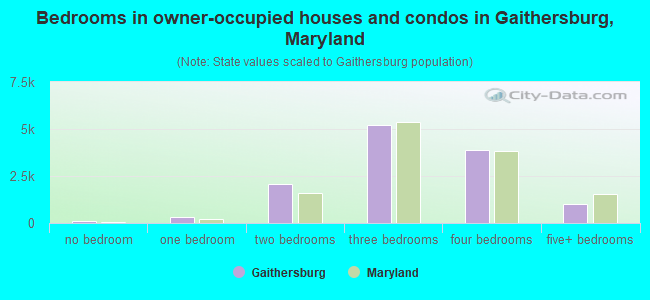
- Bedrooms in owner-occupied houses and condos in Gaithersburg, Maryland
- 91no bedroom
- 3051 bedroom
- 2,0552 bedrooms
- 5,2243 bedrooms
- 3,8644 bedrooms
- 1,0185+ bedrooms
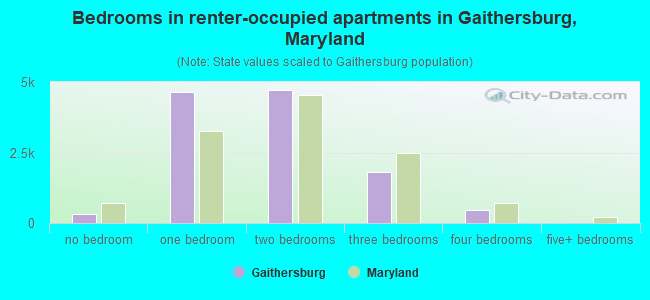
- Bedrooms in renter-occupied apartments in Gaithersburg, Maryland
- 323no bedroom
- 4,6521 bedroom
- 4,7042 bedrooms
- 1,8143 bedrooms
- 4734 bedrooms
- 05+ bedrooms
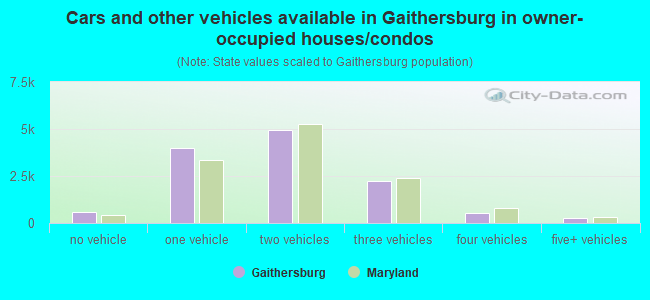
- Cars and other vehicles available in Gaithersburg in owner-occupied houses/condos
- 606no vehicle
- 3,9661 vehicle
- 4,9642 vehicles
- 2,2203 vehicles
- 5304 vehicles
- 2715+ vehicles
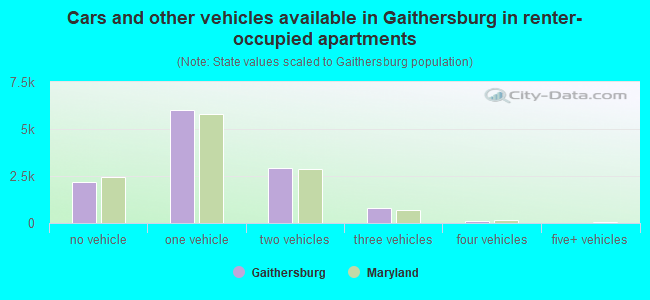
- Cars and other vehicles available in Gaithersburg in renter-occupied apartments
- 2,155no vehicle
- 6,0151 vehicle
- 2,9042 vehicles
- 7813 vehicles
- 1114 vehicles
- 05+ vehicles
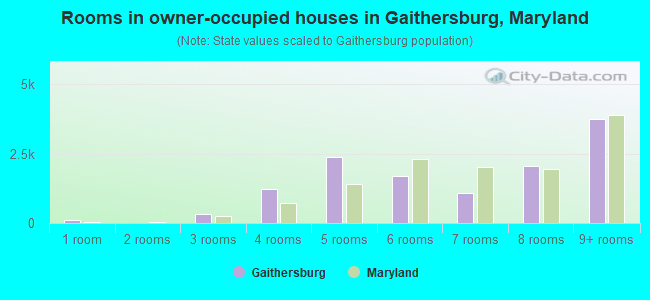
- Rooms in owner-occupied houses in Gaithersburg, Maryland
- 911 room
- 02 rooms
- 3173 rooms
- 1,2254 rooms
- 2,3735 rooms
- 1,7096 rooms
- 1,0667 rooms
- 2,0358 rooms
- 3,7419+ rooms
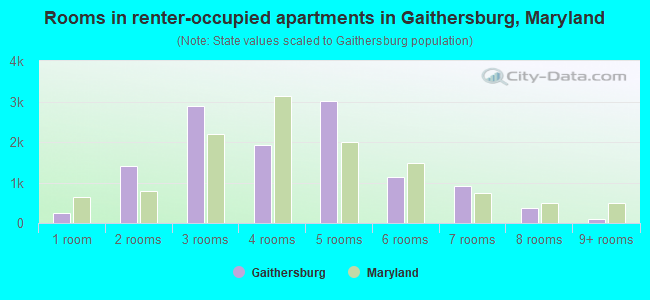
- Rooms in renter-occupied apartments in Gaithersburg, Maryland
- 2441 room
- 1,4122 rooms
- 2,8833 rooms
- 1,9154 rooms
- 3,0045 rooms
- 1,1326 rooms
- 9077 rooms
- 3618 rooms
- 1089+ rooms
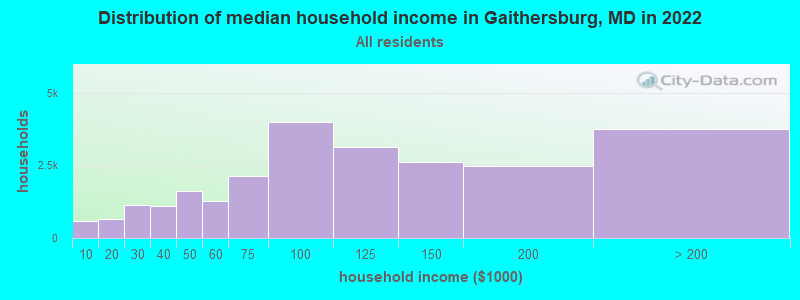
Gaithersburg, MD household income distribution

- 592Less than $10,000
- 655$10,000 to $19,999
- 1,140$20,000 to $29,999
- 1,087$30,000 to $39,999
- 1,636$40,000 to $49,999
- 1,279$50,000 to $59,999
- 2,139$60,000 to $74,999
- 3,998$75,000 to $99,999
- 3,140$100,000 to $124,999
- 2,636$125,000 to $149,999
- 2,480$150,000 to $199,999
- 3,741$200,000 or more
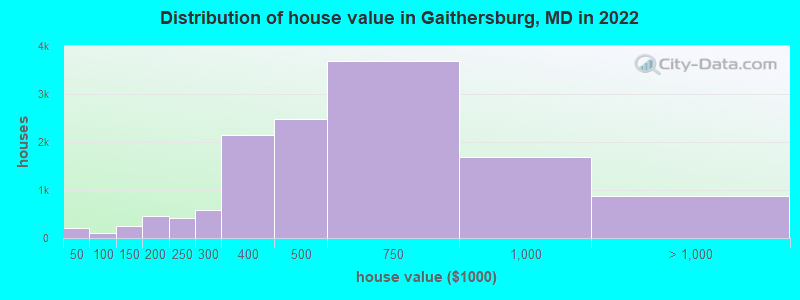
Home value of owner - occupied houses in 2022 in Gaithersburg, MD
-
- 128Less than $10,000
- 52$30,000 to $34,999
- 26$35,000 to $39,999
- 1$40,000 to $49,999
- 40$50,000 to $59,999
- 10$60,000 to $69,999
- 3$70,000 to $79,999
- 1$80,000 to $89,999
- 45$90,000 to $99,999
- 125$100,000 to $124,999
- 122$125,000 to $149,999
- 178$150,000 to $174,999
- 286$175,000 to $199,999
- 419$200,000 to $249,999
- 583$250,000 to $299,999
- 2,136$300,000 to $399,999
- 2,476$400,000 to $499,999
- 3,681$500,000 to $749,999
- 1,683$750,000 to $999,999
- 693$1,000,000 to $1,499,999
- 65$1,500,000 to $1,999,999
- 114$2,000,000 or more
Rent paid by renters in 2022 in Gaithersburg, MD
-
- 109Less than $100
- 5$100 to $149
- 65$150 to $199
- 7$200 to $249
- 75$250 to $299
- 58$300 to $349
- 16$400 to $449
- 9$450 to $499
- 48$500 to $549
- 69$600 to $649
- 31$650 to $699
- 252$800 to $899
- 52$900 to $999
- 843$1,000 to $1,249
- 2,755$1,250 to $1,499
- 5,113$1,500 to $1,999
- 1,968$2,000 to $2,499
- 524$2,500 to $2,999
- 433$3,000 to $3,499
- 272$3,500 or more
- 316No cash rent

Percentage of workers working in this county: 82.2%
Number of people working at home: 9,443 (25.5% of all workers)
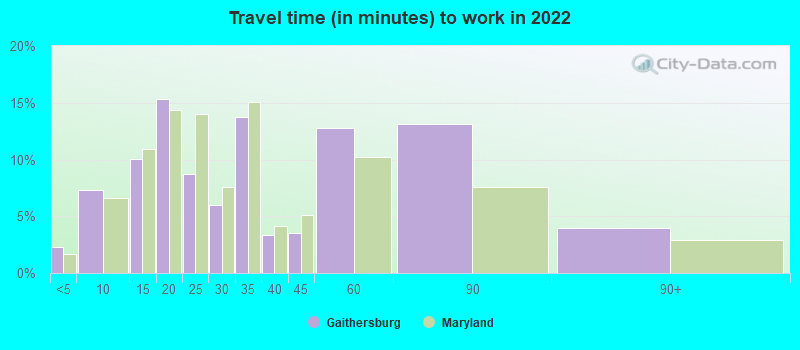
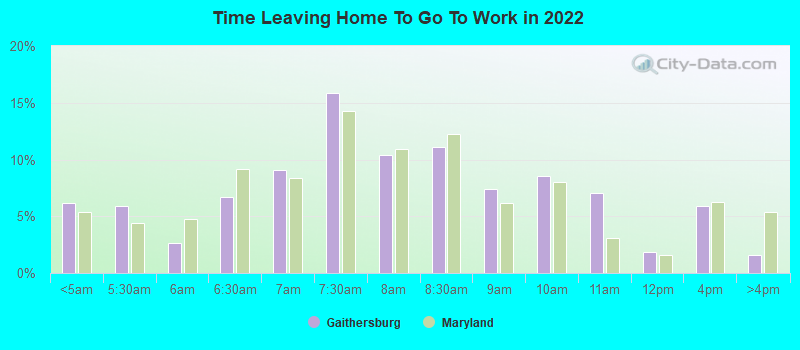
Travel time to work (commute)
- Less than 5 minutes: 1,220
- 5 to 9 minutes: 1,415
- 10 to 14 minutes: 3,369
- 15 to 19 minutes: 3,587
- 20 to 24 minutes: 3,145
- 25 to 29 minutes: 2,396
- 30 to 34 minutes: 3,853
- 35 to 39 minutes: 580
- 40 to 44 minutes: 796
- 45 to 59 minutes: 2,524
- 60 to 89 minutes: 3,423
- 90 or more minutes: 269
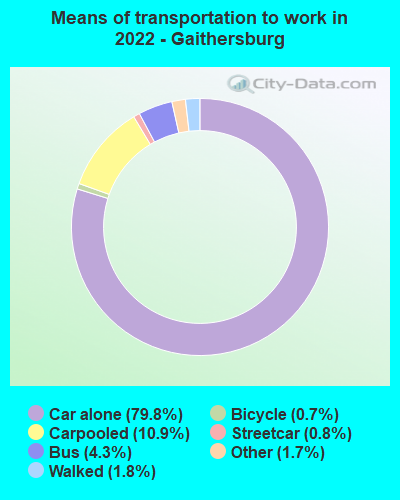
Means of transportation to work:
- Drove a car alone: 30,233 (62.6%)
- Carpooled: 4,401 (9.1%)
- Bus: 1,400 (2.9%)
- Subway or elevated rail: 251 (0.5%)
- Long-distance train or commuter rail: 30 (0.1%)
- Taxi: 674 (1.4%)
- Bicycle: 423 (0.9%)
- Walked: 568 (1.2%)
- Worked at home: 9,443 (19.6%)
- Unemployment by race in 2022
- Unemployment rate for White non-Hispanic residents
- 3.5%Males
- Unemployment rate for Black residents
- 7.0%Males
- 4.1%Females
- Unemployment rate for American Indian and Alaska Native residents
- 16.2%Males
- Unemployment rate for Asian residents
- 3.4%Males
- 4.9%Females
- Unemployment rate for other race residents
- 4.7%Males
- 8.4%Females
- Unemployment rate for two or more race residents
- 0.4%Males
- 5.3%Females
- Unemployment rate for Hispanic or Latino residents
- 3.7%Males
- 7.5%Females
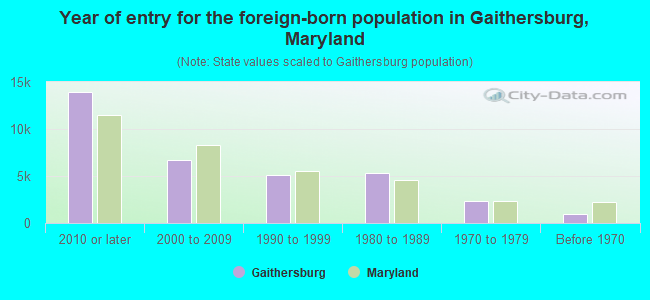
- Year of entry for the foreign-born population in Gaithersburg, Maryland
- 13,9272010 or later
- 6,7382000 to 2009
- 5,0871990 to 1999
- 5,3691980 to 1989
- 2,3441970 to 1979
- 968Before 1970
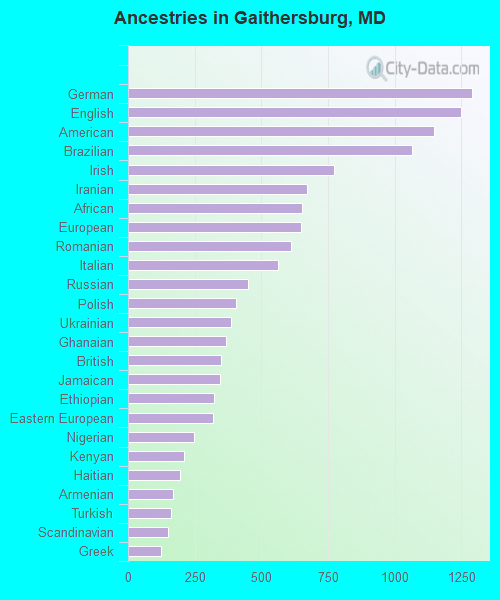
First ancestries reported:
- German: 1,290 (2.8%)
- English: 1,251 (2.7%)
- American: 1,148 (2.5%)
- Brazilian: 1,067 (2.3%)
- Irish: 774 (1.7%)
- Iranian: 670 (1.5%)
- African: 653 (1.4%)
- European: 649 (1.4%)
- Romanian: 610 (1.3%)
- Italian: 564 (1.2%)
- Russian: 452 (1.0%)
- Polish: 406 (0.9%)
- Ukrainian: 387 (0.9%)
- Ghanaian: 369 (0.8%)
- British: 350 (0.8%)
- Jamaican: 347 (0.8%)
- Ethiopian: 324 (0.7%)
- Eastern European: 319 (0.7%)
- Nigerian: 247 (0.5%)
- Kenyan: 210 (0.5%)
- Haitian: 194 (0.4%)
- Armenian: 167 (0.4%)
- Turkish: 163 (0.4%)
- Scandinavian: 151 (0.3%)
- Greek: 123 (0.3%)
- Scottish: 118 (0.3%)
- French: 111 (0.2%)
- Portuguese: 107 (0.2%)
- Norwegian: 106 (0.2%)
- Albanian: 104 (0.2%)
- Trinidadian and Tobagonian: 104 (0.2%)
- Scotch-Irish: 98 (0.2%)
- Swedish: 89 (0.2%)
- Slovak: 87 (0.2%)
- Australian: 65 (0.1%)
- Northern European: 52 (0.1%)
- Canadian: 48 (0.1%)
- Afghan: 46 (0.1%)
- Hungarian: 44 (0.10%)
- Austrian: 43 (0.09%)
- Danish: 41 (0.09%)
- Iraqi: 38 (0.08%)
- Lebanese: 35 (0.08%)
- Lithuanian: 35 (0.08%)
- British West Indian: 35 (0.08%)
- Bahamian: 34 (0.07%)
- Finnish: 31 (0.07%)
- Guyanese: 28 (0.06%)
- Barbadian: 27 (0.06%)
- Belgian: 26 (0.06%)
- Czechoslovakian: 25 (0.05%)
- Egyptian: 24 (0.05%)
- Moroccan: 23 (0.05%)
- Dutch: 20 (0.04%)
- French Canadian: 20 (0.04%)
- Slovene: 18 (0.04%)
- Yugoslavian: 12 (0.03%)
- Israeli: 12 (0.03%)
- South African: 11 (0.02%)
- Swiss: 8 (0.02%)
- Welsh: 8 (0.02%)
- Syrian: 7 (0.02%)
- Czech: 6 (0.01%)
- Bulgarian: 5 (0.01%)
- Liberian: 5 (0.01%)
Most common places of birth for foreign-born residents (%):
| Gaithersburg: | 14.0% (4,115) |
| Maryland: | 12.0% (115,412) |
| Gaithersburg: | 11.6% (3,429) |
| Maryland: | 6.4% (61,725) |
| Gaithersburg: | 10.0% (2,942) |
| Maryland: | 4.6% (44,742) |
| Gaithersburg: | 4.6% (1,358) |
| Maryland: | 2.5% (24,026) |
| Gaithersburg: | 3.9% (1,159) |
| Maryland: | 4.4% (42,350) |
| Gaithersburg: | 3.6% (1,059) |
| Maryland: | 1.8% (17,161) |
| Gaithersburg: | 3.4% (993) |
| Maryland: | 1.2% (11,980) |
| Gaithersburg: | 3.4% (988) |
| Maryland: | 0.5% (4,901) |
| Gaithersburg: | 2.6% (769) |
| Maryland: | 3.4% (32,635) |
| Gaithersburg: | 2.2% (643) |
| Maryland: | 3.8% (36,698) |
| Gaithersburg: | 2.1% (607) |
| Maryland: | 1.3% (12,898) |
| Gaithersburg: | 2.0% (597) |
| Maryland: | 1.3% (12,074) |
| Gaithersburg: | 1.9% (569) |
| Maryland: | 1.9% (18,716) |
| Gaithersburg: | 1.8% (523) |
| Maryland: | 2.5% (23,969) |
| Gaithersburg: | 1.7% (504) |
| Maryland: | 0.7% (7,000) |
| Gaithersburg: | 1.7% (504) |
| Maryland: | 1.0% (9,481) |
| Gaithersburg: | 1.5% (451) |
| Maryland: | 3.5% (34,065) |
Place of birth for U.S.-born residents:
- This state: 19,994
- Other state: 18,785
- Northeast: 5,320
- Midwest: 2,593
- South: 8,906
- West: 1,966
81.4% of Gaithersburg residents lived in the same house 1 years ago.
Out of people who lived in different houses, 43.2% lived in this county.
Out of people who lived in different counties, 27.1% lived in Maryland.
| Gaithersburg: | 81.4% |
| State average: | 88.5% |
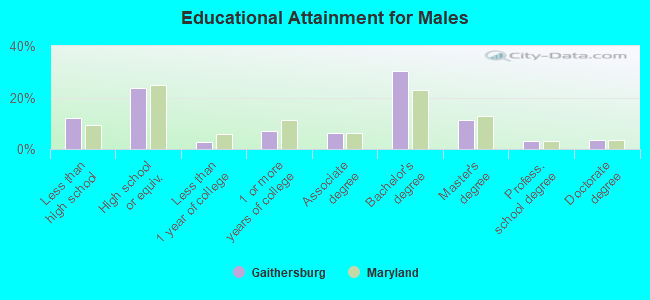
Education attainment for males 25 years and older:
- No schooling: 653
- Nursery to 4th grade: 841
- 5th and 6th grade: 381
- 7th and 8th grade: 415
- 9th grade: 206
- 10th grade: 5
- 11th grade: 29
- 12th grade, no diploma: 0
- High school graduate (or equivalency): 5,057
- Less than 1 year of college: 586
- Some college more than 1 year, no degree: 1,530
- Associate degree: 1,333
- Bachelor's degree: 6,498
- Master's degree: 2,389
- Professional school degree: 703
- Doctorate degree: 707
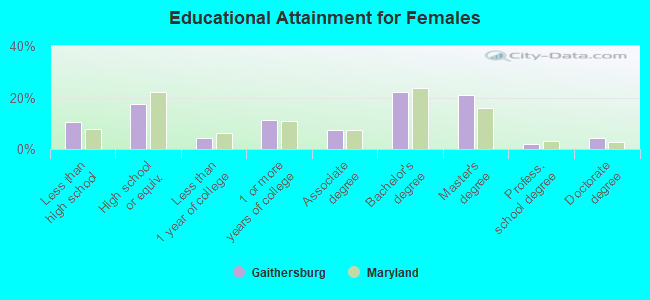
Education attainment for females 25 years and older:
- No schooling: 574
- Nursery to 4th grade: 395
- 5th and 6th grade: 489
- 7th and 8th grade: 121
- 9th grade: 283
- 10th grade: 136
- 11th grade: 431
- 12th grade, no diploma: 131
- High school graduate (or equivalency): 4,298
- Less than 1 year of college: 1,086
- Some college more than 1 year, no degree: 2,786
- Associate degree: 1,815
- Bachelor's degree: 5,438
- Master's degree: 5,144
- Professional school degree: 482
- Doctorate degree: 1,084


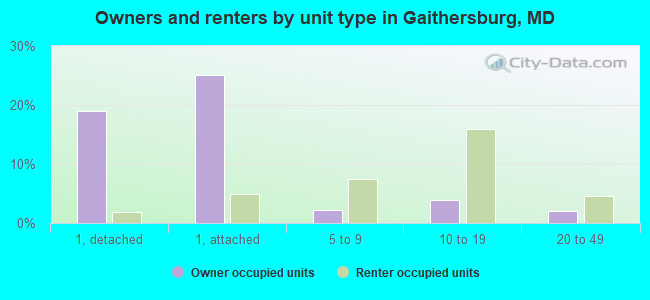
Housing units in structures:
- One, detached: 5,237
- One, attached: 7,152
- Two: 60
- 3 or 4: 266
- 5 to 9: 1,606
- 10 to 19: 4,668
- 20 to 49: 2,340
- 50 or more: 3,833
- Mobile homes: 102
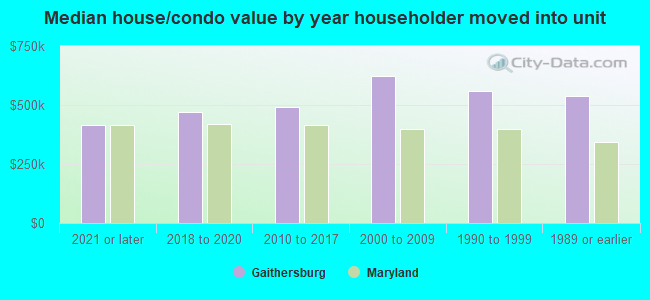
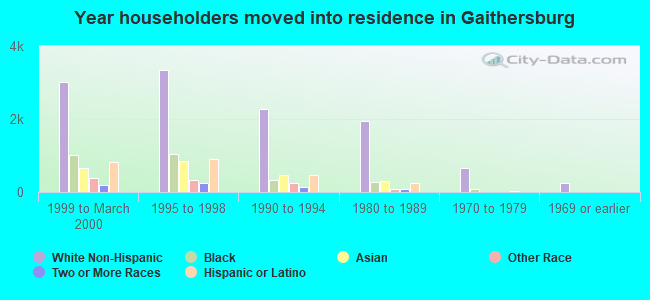
House/condo owner moved in on average 11 years ago
Renter moved in on average 2 years ago
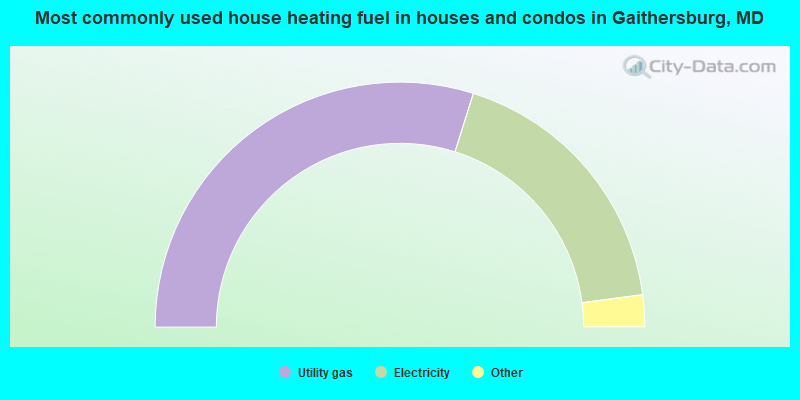
- 59.7%Utility gas
- 36.1%Electricity
- 2.3%Fuel oil, kerosene, etc.
- 1.2%Bottled, tank, or LP gas
- 0.3%No fuel used
- 0.3%Other fuel
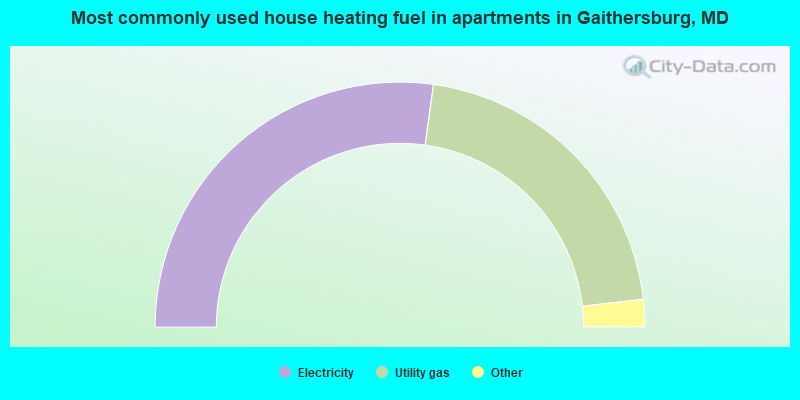
- 54.4%Electricity
- 42.0%Utility gas
- 1.2%Bottled, tank, or LP gas
- 1.2%No fuel used
- 0.5%Other fuel
- 0.5%Fuel oil, kerosene, etc.
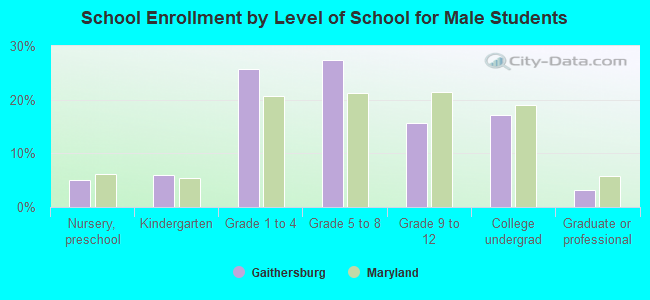
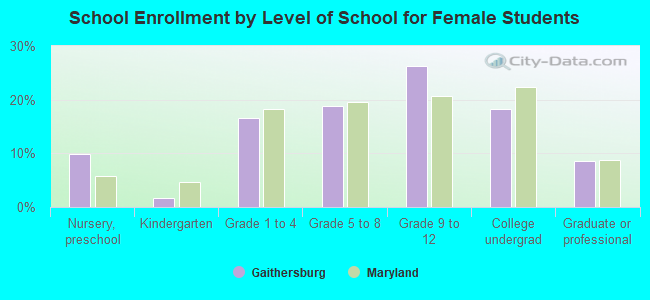
Private vs. public school enrollment:
| Here: | 4.4% |
| Maryland: | 15.2% |
| Here: | 7.6% |
| Maryland: | 14.4% |
| Here: | 6.9% |
| Maryland: | 20.2% |