Hinsdale, IL (Illinois) Houses and Residents
| Hinsdale: | $971,217 |
| Illinois: | $251,600 |
Total population: 17,446 (All urban)
Houses: 6,266 (5,773 occupied: 5,165 owner occupied, 613 renter occupied)
| % of renters here: | 11% |
| State: | 33% |
Housing density: 1,352 houses/condos per square mile
Median price asked for vacant for-sale houses and condos in 2022: $1,110,786.
Median contract rent in 2022: $1,798 (lower quartile is $1,379, upper quartile is over $2,000)
Median rent asked for vacant for-rent units in 2022: $1,151
Median gross rent in Hinsdale, IL in 2022: $1,800
Housing units in Hinsdale with a mortgage: 3,272 (462 second mortgage, 28 home equity loan, 406 both second mortgage and home equity loan)
Houses without a mortgage: 104
Median household income for houses/condos with a mortgage: $244,889
Median household income for apartments without a mortgage: $174,755
Median monthly housing costs: $3,219
Compare current foreclosures near Hinsdale, IL:
| Photo | Address | Area | Beds / Baths | Price | Details |
|---|---|---|---|---|---|

|
#1
Ashbury Dr
Hinsdale, IL 60521
|
2,405 sq. feet
|
3 baths 3 beds |
show details | |

|
#2
S Garfield St
Hinsdale, IL 60521
|
1,584 sq. feet
|
3 baths 2 beds |
show details | |

|
#3
W Grant Vlg
Hinsdale, IL 60521
|
1,890 sq. feet
|
3 baths 3 beds |
show details | |

|
#4
Harding Rd
Hinsdale, IL 60521
|
3,516 sq. feet
|
3 baths 5 beds |
show details | |

|
#5
N Garfield St
Hinsdale, IL 60521
|
3,384 sq. feet
|
5 baths - beds |
show details | |

|
#6
S Washington St
Hinsdale, IL 60521
|
2,964 sq. feet
|
3 baths - beds |
show details | |

|
#7
Justina St
Hinsdale, IL 60521
|
1,583 sq. feet
|
2 baths - beds |
show details | |

|
#8
N County Line Rd
Hinsdale, IL 60521
|
3,493 sq. feet
|
3 baths - beds |
show details | |

|
#9
E 6th St
Hinsdale, IL 60521
|
- sq. feet
|
- baths - beds |
show details | |

|
#10
Giddings Ave
Hinsdale, IL 60521
|
- sq. feet
|
- baths - beds |
show details |
| Photo | Address | Area | Beds / Baths | Price | Details |
|---|---|---|---|---|---|

|
#11
N County Line Rd Apt 303c
Hinsdale, IL 60521
|
- sq. feet
|
- baths - beds |
show details | |

|
#12
E Hinsdale Ave Lowr 1
Hinsdale, IL 60521
|
- sq. feet
|
- baths - beds |
show details | |

|
#13
W 63rd St
Chicago, IL 60638
|
1,250 sq. feet
|
2 baths 4 beds |
$385,000
|
show details |

|
#14
W 107th Pl
Chicago, IL 60628
|
1,579 sq. feet
|
2 baths 6 beds |
$40,000
|
show details |

|
#15
S Emerald Ave
Chicago, IL 60620
|
1,080 sq. feet
|
1 baths 2 beds |
$34,900
|
show details |

|
#16
S Main St
Hometown, IL 60456
|
744 sq. feet
|
1 baths 2 beds |
$175,000
|
show details |

|
#17
Newcastle Ave
Westchester, IL 60154
|
1,640 sq. feet
|
1 baths 2 beds |
$239,200
|
show details |

|
#18
W Arquilla Dr
Palos Heights, IL 60463
|
1,780 sq. feet
|
2 baths 2 beds |
$299,900
|
show details |

|
#19
N Austin Ave
Chicago, IL 60634
|
2,500 sq. feet
|
3 baths 4 beds |
$365,000
|
show details |

|
#20
W 100th Pl
Chicago, IL 60628
|
971 sq. feet
|
1 baths 2 beds |
$225,000
|
show details |
| Photo | Address | Area | Beds / Baths | Price | Details |
|---|---|---|---|---|---|

|
#21
W 108th St Apt D
Chicago, IL 60643
|
1,300 sq. feet
|
2 baths 3 beds |
$144,900
|
show details |

|
#22
Raymond Ave
Brookfield, IL 60513
|
1,020 sq. feet
|
1 baths 2 beds |
$219,900
|
show details |

|
#23
S Tripp Ave
Oak Lawn, IL 60453
|
1,591 sq. feet
|
1 baths 3 beds |
$212,000
|
show details |

|
#24
145th St
Midlothian, IL 60445
|
2,000 sq. feet
|
1 baths 3 beds |
$179,900
|
show details |

|
#25
S Vanderpoel Ave
Chicago, IL 60643
|
2,352 sq. feet
|
2 baths 7 beds |
$115,000
|
show details |

|
#26
W Van Buren St
Chicago, IL 60644
|
2,839 sq. feet
|
3 baths 8 beds |
$87,500
|
show details |

|
#27
N Olcott Ave
Chicago, IL 60634
|
2,161 sq. feet
|
2 baths 4 beds |
$559,000
|
show details |

|
#28
E Crest Ave
Addison, IL 60101
|
2,023 sq. feet
|
1 baths 5 beds |
$296,100
|
show details |

|
#29
Webster Ln
Des Plaines, IL 60018
|
1,608 sq. feet
|
3 baths 3 beds |
$515,000
|
show details |

|
#30
W Garfield Blvd
Chicago, IL 60636
|
2,820 sq. feet
|
2 baths 5 beds |
$132,500
|
show details |
| Photo | Address | Area | Beds / Baths | Price | Details |
|---|---|---|---|---|---|

|
#31
S Union Ave
Chicago, IL 60620
|
1,920 sq. feet
|
2 baths 4 beds |
$75,000
|
show details |

|
#32
W 25th Pl
Chicago, IL 60623
|
- sq. feet
|
2 baths 4 beds |
$199,900
|
show details |

|
#33
S 13th Ave
Maywood, IL 60153
|
1,176 sq. feet
|
1 baths 3 beds |
$279,900
|
show details |

|
#34
S Meade Ave
Palos Heights, IL 60463
|
1,656 sq. feet
|
1 baths 3 beds |
$289,900
|
show details |

|
#35
N Garfield Ave
Hinsdale, IL 60521
|
- sq. feet
|
- baths - beds |
show details | |

|
#36
N Garfield Ave
Hinsdale, IL 60521
|
- sq. feet
|
- baths - beds |
show details | |

|
#37
Chanticleer Ln
Hinsdale, IL 60521
|
- sq. feet
|
- baths - beds |
show details | |

|
#38
S Madison St
Hinsdale, IL 60521
|
- sq. feet
|
- baths - beds |
show details | |

|
#39
Washington Blvd Apt 1
Oak Park, IL 60302
|
- sq. feet
|
1 baths 2 beds |
$134,900
|
show details |

|
#40
W Arthington St
Chicago, IL 60612
|
969 sq. feet
|
1 baths - beds |
$20,000
|
show details |
| Photo | Address | Area | Beds / Baths | Price | Details |
|---|---|---|---|---|---|

|
#41
S Charles St
Chicago, IL 60643
|
- sq. feet
|
4 baths 6 beds |
$349,900
|
show details |

|
#42
Fairfax Ave
Romeoville, IL 60446
|
- sq. feet
|
1 baths 3 beds |
$229,900
|
show details |

|
#43
W Quincy St
Chicago, IL 60644
|
960 sq. feet
|
1 baths - beds |
$19,000
|
show details |

|
#44
Avenida Serra Test
Des Plaines, IL 60018
|
- sq. feet
|
2 baths 3 beds |
$100,000
|
show details |

|
#45
S Wabash Ave
Chicago, IL 60637
|
3,870 sq. feet
|
3 baths 6 beds |
show details | |

|
#46
S Paulina St
Chicago, IL 60609
|
2,982 sq. feet
|
4 baths 8 beds |
show details | |

|
#47
S Ada St
Chicago, IL 60620
|
3,040 sq. feet
|
4 baths 6 beds |
show details | |

|
#48
Lathrop Ave Apt 404
Forest Park, IL 60130
|
675 sq. feet
|
1 baths 1 beds |
show details | |

|
#49
Scarsdale Ct Unit C2
Schaumburg, IL 60193
|
950 sq. feet
|
1 baths 2 beds |
show details | |

|
Check over 1 million property listings on Foreclosure.com!
|
browse all offers | |||

Latest news about housing in Hinsdale, IL collected exclusively by city-data.com from local newspapers, TV, and radio stations

 | Hinsdale homes (21 replies) |
| Hinsdale Home Search (21 replies) |
| Ashbury Woods Townhomes in Hinsdale (9 replies) |
| Chicago Suburbs Real Estate (111 replies) |
| Deciding between north shore villages for our "forever ish" home (15 replies) |
| Why so many homes for sale in Glen Ellyn? (2 replies) |

Median year apartment built: 1965
Household type by relationship:
Households: 16,990- Male householders: 3,213 (266 living alone), Female householders: 2,471 (545 living alone)
4,338 spouses (4,320 opposite-sex spouses), 101 unmarried partners, (101 opposite-sex unmarried partners), 6,263 children (6,074 natural, 83 adopted, 105 stepchildren), 20 grandchildren, 45 brothers or sisters, 75 parents, 9 foster children, 53 other relatives, 89 non-relatives
- In group quarters: 308
Size of family households: 1,641 2-persons, 1,228 3-persons, 1,215 4-persons, 551 5-persons, 91 6-persons, 42 7-or-more-persons.
Size of nonfamily households: 841 1-person, 96 2-persons.
4,902 married couples with children.
359 single-parent households (118 men, 241 women).
79.7% of residents of Hinsdale speak English at home.
4.1% of residents speak Spanish at home (86% speak English very well, 10% speak English well, 4% speak English not well).
7.4% of residents speak other Indo-European language at home (86% speak English very well, 5% speak English well, 9% speak English not well).
7.1% of residents speak Asian or Pacific Island language at home (67% speak English very well, 27% speak English well, 4% speak English not well, 2% don't speak English at all).
1.0% of residents speak other language at home (97% speak English very well, 3% speak English well).
Foreign born population: 2,509 (14.8%)
(69.4% of them are naturalized citizens)
| Here: | 9.9 |
| State: | 6.4 |
| Here: | 5.4 |
| State: | 4.1 |

- Bedrooms in owner-occupied houses and condos in Hinsdale, Illinois
- 11no bedroom
- 31 bedroom
- 4992 bedrooms
- 8663 bedrooms
- 1,9704 bedrooms
- 1,8165+ bedrooms

- Bedrooms in renter-occupied apartments in Hinsdale, Illinois
- 14no bedroom
- 901 bedroom
- 2182 bedrooms
- 1463 bedrooms
- 804 bedrooms
- 655+ bedrooms

- Cars and other vehicles available in Hinsdale in owner-occupied houses/condos
- 83no vehicle
- 1,0781 vehicle
- 2,8452 vehicles
- 9283 vehicles
- 1454 vehicles
- 885+ vehicles

- Cars and other vehicles available in Hinsdale in renter-occupied apartments
- 24no vehicle
- 2801 vehicle
- 1722 vehicles
- 703 vehicles
- 374 vehicles
- 305+ vehicles

- Rooms in owner-occupied houses in Hinsdale, Illinois
- 111 room
- 02 rooms
- 03 rooms
- 1234 rooms
- 2565 rooms
- 4986 rooms
- 6267 rooms
- 5758 rooms
- 3,0789+ rooms

- Rooms in renter-occupied apartments in Hinsdale, Illinois
- 141 room
- 02 rooms
- 683 rooms
- 604 rooms
- 1635 rooms
- 866 rooms
- 527 rooms
- 408 rooms
- 1309+ rooms


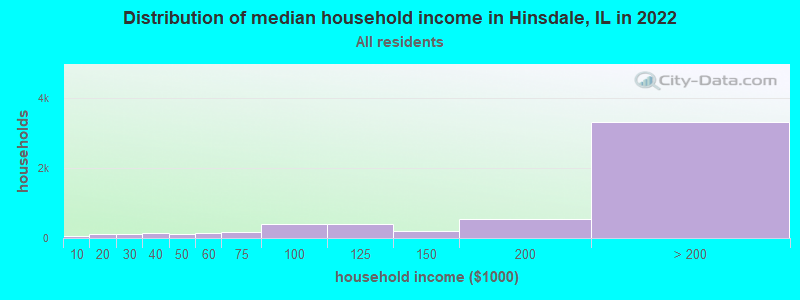
Hinsdale, IL household income distribution

- 63Less than $10,000
- 114$10,000 to $19,999
- 104$20,000 to $29,999
- 138$30,000 to $39,999
- 101$40,000 to $49,999
- 156$50,000 to $59,999
- 185$60,000 to $74,999
- 387$75,000 to $99,999
- 396$100,000 to $124,999
- 211$125,000 to $149,999
- 540$150,000 to $199,999
- 3,307$200,000 or more
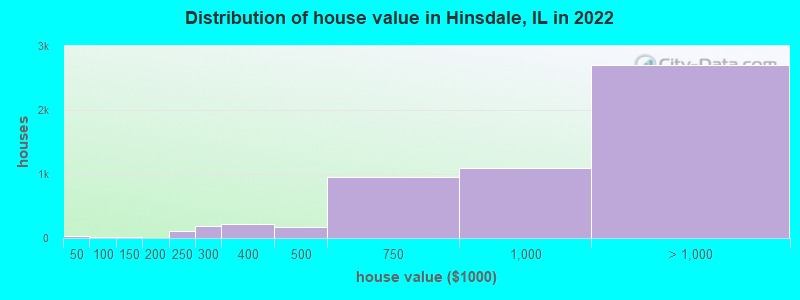
Home value of owner - occupied houses in 2022 in Hinsdale, IL
-
- 27Less than $10,000
- 17$50,000 to $59,999
- 8$100,000 to $124,999
- 6$125,000 to $149,999
- 5$175,000 to $199,999
- 108$200,000 to $249,999
- 193$250,000 to $299,999
- 219$300,000 to $399,999
- 169$400,000 to $499,999
- 947$500,000 to $749,999
- 1,095$750,000 to $999,999
- 1,336$1,000,000 to $1,499,999
- 556$1,500,000 to $1,999,999
- 818$2,000,000 or more
Rent paid by renters in 2022 in Hinsdale, IL
-
- 6$550 to $599
- 22$750 to $799
- 30$800 to $899
- 27$1,000 to $1,249
- 104$1,250 to $1,499
- 138$1,500 to $1,999
- 124$2,000 to $2,499
- 7$2,500 to $2,999
- 40$3,000 to $3,499
- 85$3,500 or more
- 16No cash rent


Percentage of workers working in this county: 62.8%
Number of people working at home: 2,515 (33.8% of all workers)
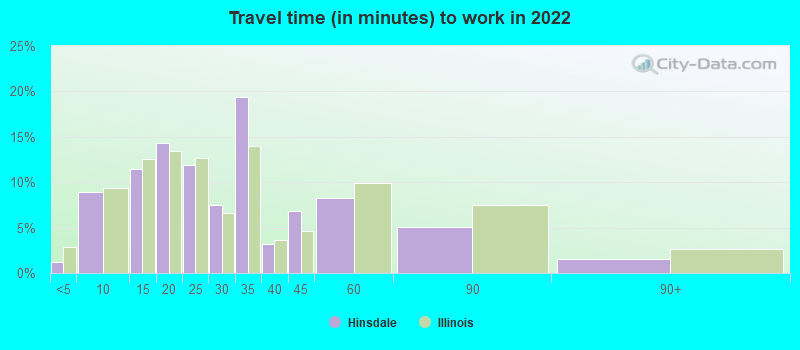
Travel time to work (commute)
- Less than 5 minutes: 109
- 5 to 9 minutes: 416
- 10 to 14 minutes: 473
- 15 to 19 minutes: 544
- 20 to 24 minutes: 634
- 25 to 29 minutes: 386
- 30 to 34 minutes: 503
- 35 to 39 minutes: 195
- 40 to 44 minutes: 329
- 45 to 59 minutes: 818
- 60 to 89 minutes: 489
- 90 or more minutes: 168
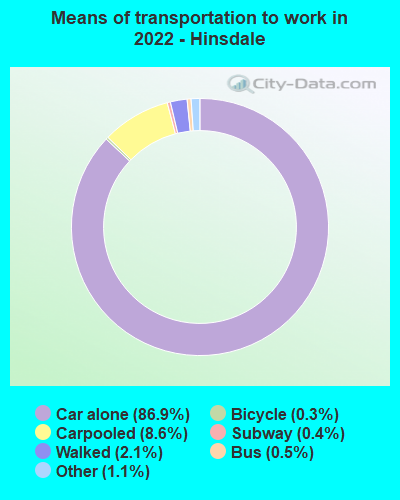
Means of transportation to work:
- Drove a car alone: 7,168 (66.3%)
- Carpooled: 872 (8.1%)
- Bus: 63 (0.6%)
- Long-distance train or commuter rail: 30 (0.3%)
- Taxi: 108 (1.0%)
- Bicycle: 22 (0.2%)
- Walked: 162 (1.5%)
- Worked at home: 2,515 (23.3%)

- Unemployment by race in 2022
- Unemployment rate for White non-Hispanic residents
- 2.5%Males
- 2.1%Females
- Unemployment rate for Asian residents
- 1.4%Females
- Unemployment rate for two or more race residents
- 0.9%Males
- Unemployment rate for Hispanic or Latino residents
- 1.9%Females

- Year of entry for the foreign-born population in Hinsdale, Illinois
- 7282010 or later
- 7092000 to 2009
- 3011990 to 1999
- 3741980 to 1989
- 2331970 to 1979
- 368Before 1970
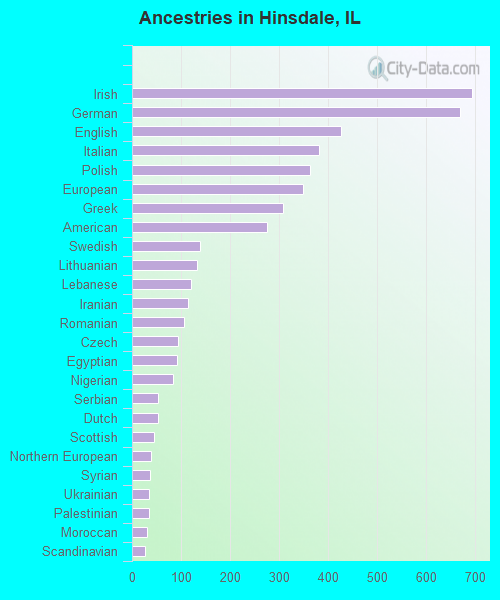
First ancestries reported:
- Irish: 693 (9.5%)
- German: 669 (9.2%)
- English: 425 (5.8%)
- Italian: 381 (5.2%)
- Polish: 362 (5.0%)
- European: 348 (4.8%)
- Greek: 308 (4.2%)
- American: 276 (3.8%)
- Swedish: 138 (1.9%)
- Lithuanian: 133 (1.8%)
- Lebanese: 121 (1.7%)
- Iranian: 114 (1.6%)
- Romanian: 105 (1.4%)
- Czech: 93 (1.3%)
- Egyptian: 92 (1.3%)
- Nigerian: 84 (1.2%)
- Serbian: 54 (0.7%)
- Dutch: 52 (0.7%)
- Scottish: 45 (0.6%)
- Northern European: 38 (0.5%)
- Syrian: 36 (0.5%)
- Ukrainian: 35 (0.5%)
- Palestinian: 34 (0.5%)
- Moroccan: 30 (0.4%)
- Scandinavian: 26 (0.4%)
- British: 26 (0.4%)
- Hungarian: 25 (0.3%)
- Eastern European: 23 (0.3%)
- Turkish: 23 (0.3%)
- Czechoslovakian: 21 (0.3%)
- French: 18 (0.2%)
- Norwegian: 16 (0.2%)
- Croatian: 15 (0.2%)
- Russian: 15 (0.2%)
- Portuguese: 13 (0.2%)
- Brazilian: 13 (0.2%)
- French Canadian: 12 (0.2%)
- Armenian: 7 (0.10%)
- Bulgarian: 7 (0.10%)
- Belgian: 7 (0.10%)
- Welsh: 7 (0.10%)
- Danish: 6 (0.08%)
- South African: 6 (0.08%)
- Yugoslavian: 6 (0.08%)
- Scotch-Irish: 5 (0.07%)
- Swiss: 5 (0.07%)
- Jordanian: 4 (0.05%)
- Finnish: 4 (0.05%)
- Luxembourger: 2 (0.03%)
Most common places of birth for foreign-born residents (%):
| Hinsdale: | 18.2% (458) |
| Illinois: | 4.1% (74,364) |
| Hinsdale: | 9.7% (245) |
| Illinois: | 9.2% (166,409) |
| Hinsdale: | 6.8% (171) |
| Illinois: | 0.5% (8,235) |
| Hinsdale: | 5.7% (145) |
| Illinois: | 6.9% (124,474) |
| Hinsdale: | 5.2% (130) |
| Illinois: | 34.7% (626,958) |
| Hinsdale: | 3.6% (92) |
| Illinois: | 0.9% (16,553) |
| Hinsdale: | 3.6% (90) |
| Illinois: | 0.8% (14,736) |
| Hinsdale: | 3.5% (89) |
| Illinois: | 0.2% (2,988) |
| Hinsdale: | 3.1% (79) |
| Illinois: | 0.6% (10,249) |
| Hinsdale: | 3.1% (78) |
| Illinois: | 0.4% (6,922) |
| Hinsdale: | 2.9% (73) |
| Illinois: | 0.5% (8,574) |
| Hinsdale: | 2.3% (57) |
| Illinois: | 0.1% (1,187) |
| Hinsdale: | 2.1% (54) |
| Illinois: | 0.4% (7,117) |
| Hinsdale: | 2.0% (50) |
| Illinois: | 0.3% (5,762) |
| Hinsdale: | 1.9% (49) |
| Illinois: | 0.2% (3,080) |
| Hinsdale: | 1.9% (48) |
| Illinois: | 2.2% (40,393) |
| Hinsdale: | 1.9% (48) |
| Illinois: | 0.3% (4,823) |
| Hinsdale: | 1.8% (46) |
| Illinois: | 5.2% (93,003) |
| Hinsdale: | 1.7% (43) |
| Illinois: | 1.1% (19,306) |
Place of birth for U.S.-born residents:
- This state: 9,663
- Other state: 4,677
- Northeast: 950
- Midwest: 2,311
- South: 828
- West: 596
84.5% of Hinsdale residents lived in the same house 1 years ago.
Out of people who lived in different houses, 26.1% lived in this county.
Out of people who lived in different counties, 80.3% lived in Illinois.
| Hinsdale: | 84.5% |
| State average: | 88.3% |
Education attainment for males 25 years and older:
- No schooling: 46
- Nursery to 4th grade: 0
- 5th and 6th grade: 0
- 7th and 8th grade: 21
- 9th grade: 31
- 10th grade: 13
- 11th grade: 9
- 12th grade, no diploma: 7
- High school graduate (or equivalency): 170
- Less than 1 year of college: 51
- Some college more than 1 year, no degree: 246
- Associate degree: 104
- Bachelor's degree: 1,705
- Master's degree: 1,827
- Professional school degree: 843
- Doctorate degree: 316

Education attainment for females 25 years and older:
- No schooling: 50
- Nursery to 4th grade: 0
- 5th and 6th grade: 5
- 7th and 8th grade: 9
- 9th grade: 9
- 10th grade: 8
- 11th grade: 0
- 12th grade, no diploma: 8
- High school graduate (or equivalency): 444
- Less than 1 year of college: 269
- Some college more than 1 year, no degree: 298
- Associate degree: 195
- Bachelor's degree: 2,235
- Master's degree: 1,370
- Professional school degree: 614
- Doctorate degree: 277


Housing units in structures:
- One, detached: 5,287
- One, attached: 352
- Two: 19
- 3 or 4: 58
- 5 to 9: 67
- 10 to 19: 88
- 20 to 49: 192
- 50 or more: 179
- Mobile homes: 9
- Boats, RVs, vans, etc.: 11
Housing units lacking complete kitchen facilities in 2022: 0.7%
House/condo owner moved in on average 10 years ago
Renter moved in on average 5 years ago

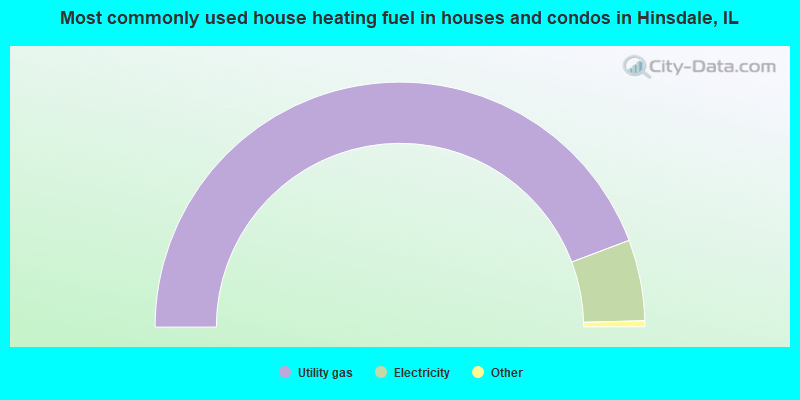
- 88.5%Utility gas
- 10.7%Electricity
- 0.3%Coal or coke
- 0.3%Bottled, tank, or LP gas
- 0.2%No fuel used
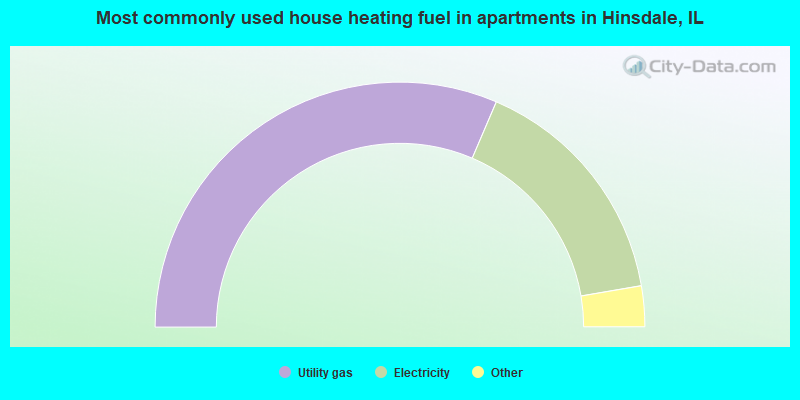
- 63.0%Utility gas
- 31.8%Electricity
- 3.8%Bottled, tank, or LP gas
- 1.5%No fuel used
Private vs. public school enrollment:
| Here: | 12.7% |
| Illinois: | 13.3% |
| Here: | 4.7% |
| Illinois: | 9.9% |
| Here: | 55.2% |
| Illinois: | 27.4% |


