Hoffman Estates, IL (Illinois) Houses and Residents
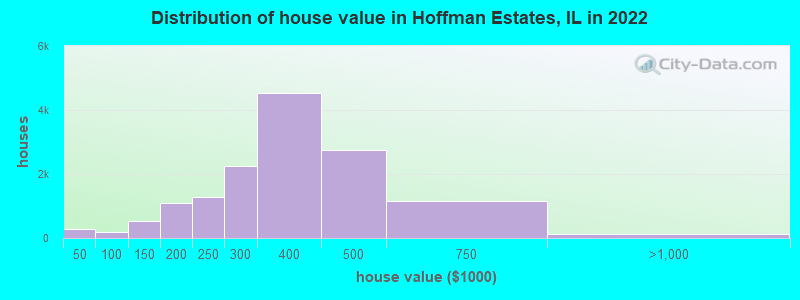
Estimated median house or condo value in 2022: $338,960 (it was $176,500 in 2000 )
Hoffman Estates:
$338,960Illinois:
$251,600
Lower value quartile - upper value quartile: $255,553 - $421,942Total population: 52,347 (Urban population: 50,275, Rural population: 77 (all nonfarm) )
Houses: 19,394 (18,450 occupied: 13,895 owner occupied, 4,870 renter occupied )
% of renters here:
26%State:
33%
Housing density: 984 houses/condos per square mile
Median price asked for vacant for-sale houses and condos in 2022: $186,815.
Median contract rent in 2022: $1,450 (lower quartile is $1,226, upper quartile is $1,837)
Median rent asked for vacant for-rent units in 2022: $1,731
Median gross rent in Hoffman Estates, IL in 2022: $1,653
Housing units in Hoffman Estates with a mortgage: 9,343 (645 second mortgage, 21 home equity loan, 511 both second mortgage and home equity loan )Houses without a mortgage: 269
Median household income for houses/condos with a mortgage: $128,533
Median household income for apartments without a mortgage: $112,392
Median monthly housing costs: $1,666
Data:
Median house or condo value ($)
Median house or condo value ($ change since 2000)
Median house or condo value ($) - White
Median house or condo value ($) - Black or African American
Median house or condo value ($) - Asian
Median house or condo value ($) - Hispanic or Latino
Median house or condo value ($) - American Indian and Alaska Native
Median house or condo value ($) - Multirace
Median house or condo value ($) - Other Race
Median price asked for mobile homes ($)
Household density (households per square mile)
Mean house or condo value by units in structure - 1, detached ($)
Mean house or condo value by units in structure - 1, attached ($)
Mean house or condo value by units in structure - 2 ($)
Mean house or condo value by units in structure by units in structure - 3 or 4 ($)
Mean house or condo value by units in structure - 5 or more ($)
Mean house or condo value by units in structure - Boat, RV, van, etc. ($)
Mean house or condo value by units in structure - Mobile home ($)
Median contract rent ($)
Median contract rent - Lower quartile ($)
Median contract rent - Upper quartile ($)
Median gross rent ($)
Urban houses (%)
Rural houses (%)
Houses occupied (%)
Houses occupied (% change since 2000)
Houses owner occupied (%)
Houses owner occupied (% change since 2000)
Houses renter occupied (%)
Houses renter occupied (% change since 2000)
Vacant housing units - For rent (%)
Vacant housing units - For rent (% change since 2000)
Vacant housing units - For sale only (%)
Vacant housing units - For sale only (% change since 2000)
Vacant housing units - Rented or sold, not occupied (%)
Vacant housing units - Rented or sold, not occupied (% change since 2000)
Vacant housing units - For seasonal, recreational, or occasional use (%)
Vacant housing units - For seasonal, recreational, or occasional use (% change since 2000)
Vacant housing units - For migrant workers (%)
Vacant housing units - For migrant workers (% change since 2000)
Vacant housing units - Other vacant (%)
Vacant housing units - Other vacant (% change since 2000)
Median monthly housing costs ($)
Median household income for houses/condos with a mortgage ($)
Median household income for houses/condos without a mortgage ($)
Median household income ($)
Median household income ($) - White
Median household income ($) - Black or African American
Median household income ($) - Asian
Median household income ($) - Hispanic or Latino
Median household income ($) - American Indian and Alaska Native
Median household income ($) - Multirace
Median household income ($) - Other Race
Mortgage status - with mortgage (%)
Mortgage status - with second mortgage (%)
Mortgage status - with home equity loan (%)
Mortgage status - with both second mortgage and home equity loan (%)
Mortgage status - without a mortgage (%)
Median year house/condo built
Median year apartment built
Household type by relationship - Male householder living alone (%)
Household type by relationship - Male householder not living alone (%)
Household type by relationship - Female householder living alone (%)
Household type by relationship - Female householder not living alone (%)
Household type by relationship - Opposite-Sex spouse (%)
Household type by relationship - Same-Sex spouse (%)
Household type by relationship - Opposite-Sex unmarried partner (%)
Household type by relationship - Same-Sex unmarried partner (%)
Household type by relationship - In group quarters (%)
Size of family households - 2-person household (%)
Size of family households - 3-person household (%)
Size of family households - 4-person household (%)
Size of family households - 5-person household (%)
Size of family households - 6-person household (%)
Size of family households - 7-or-more-person household (%)
Size of nonfamily households - 1-person household (%)
Size of nonfamily households - 2-person household (%)
Size of nonfamily households - 3-person household (%)
Size of nonfamily households - 4-person household (%)
Size of nonfamily households - 5-person household (%)
Size of nonfamily households - 6-person household (%)
Size of nonfamily households - 7-or-moreperson household (%)
Year house built - Built 2010 or later (%)
Year house built - Built 2000 to 2009 (%)
Year house built - Built 1990 to 1999 (%)
Year house built - Built 1980 to 1989 (%)
Year house built - Built 1970 to 1979 (%)
Year house built - Built 1960 to 1969 (%)
Year house built - Built 1950 to 1959 (%)
Year house built - Built 1940 to 1949 (%)
Year house built - Built 1939 or earlier (%)
Median number of rooms in houses and condos
Median number of rooms in apartments
Median number of bedrooms in owner occupied houses
Mean number of bedrooms in owner occupied houses
Median number of bedrooms in renter occupied houses
Mean number of bedrooms in renter occupied houses
Median number of vehichles in owner occupied houses
Mean number of vehichles in owner occupied houses
Median number of vehichles in renter occupied houses
Mean number of vehichles in renter occupied houses
Rooms in owner-occupied houses - 1 room (%)
Rooms in owner-occupied houses - 2 rooms (%)
Rooms in owner-occupied houses - 3 rooms (%)
Rooms in owner-occupied houses - 4 rooms (%)
Rooms in owner-occupied houses - 5 rooms (%)
Rooms in owner-occupied houses - 6 rooms (%)
Rooms in owner-occupied houses - 7 rooms (%)
Rooms in owner-occupied houses - 8 rooms (%)
Rooms in owner-occupied houses - 9+ rooms (%)
Rooms in renter-occupied houses - 1 room (%)
Rooms in renter-occupied houses - 2 rooms (%)
Rooms in renter-occupied houses - 3 rooms (%)
Rooms in renter-occupied houses - 4 rooms (%)
Rooms in renter-occupied houses - 5 rooms (%)
Rooms in renter-occupied houses - 6 rooms (%)
Rooms in renter-occupied houses - 7 rooms (%)
Rooms in renter-occupied houses - 8 rooms (%)
Rooms in renter-occupied houses - 9+ rooms (%)
Bedrooms in owner-occupied houses - no bedrooms (%)
Bedrooms in owner-occupied houses - 1 bedroom (%)
Bedrooms in owner-occupied houses - 2 bedrooms (%)
Bedrooms in owner-occupied houses - 3 bedrooms (%)
Bedrooms in owner-occupied houses - 4 bedrooms (%)
Bedrooms in owner-occupied houses - 5+ bedrooms (%)
Bedrooms in renter-occupied houses - no bedrooms (%)
Bedrooms in renter-occupied houses - 1 bedroom (%)
Bedrooms in renter-occupied houses - 2 bedrooms (%)
Bedrooms in renter-occupied houses - 3 bedrooms (%)
Bedrooms in renter-occupied houses - 4 bedrooms (%)
Bedrooms in renter-occupied houses - 5+ bedrooms (%)
Vehicles available in owner-occupied houses - no vehicle available (%)
Vehicles available in owner-occupied houses - 1 vehicle available(%)
Vehicles available in owner-occupied houses - 2 Vehicles available (%)
Vehicles available in owner-occupied houses - 3 Vehicles available (%)
Vehicles available in owner-occupied houses - 4 Vehicles available (%)
Vehicles available in owner-occupied houses - 5+ Vehicles available (%)
Vehicles available in renter-occupied houses - no vehicle available (%)
Vehicles available in renter-occupied houses - 1 vehicle available (%)
Vehicles available in renter-occupied houses - 2 Vehicles available (%)
Vehicles available in renter-occupied houses - 3 Vehicles available (%)
Vehicles available in renter-occupied houses - 4 Vehicles available (%)
Vehicles available in renter-occupied houses - 5+ Vehicles available (%)
Housing units in structures - 1, detached (%)
Housing units in structures - 1, attached (%)
Housing units in structures - 2 (%)
Housing units in structures - 3 or 4 (%)
Housing units in structures - 5 to 9 (%)
Housing units in structures - 10 to 19 (%)
Housing units in structures - 20 to 49 (%)
Housing units in structures - 50 or more (%)
Housing units in structures - Mobile home (%)
Housing units in structures - Boat, RV, van, etc. (%)
Housing units in structures - Owners - 1, detached (%)
Housing units in structures - Owners - 1, attached (%)
Housing units in structures - Owners - 2 (%)
Housing units in structures - Owners - 3 or 4 (%)
Housing units in structures - Owners - 5 to 9 (%)
Housing units in structures - Owners - 10 to 19 (%)
Housing units in structures - Owners - 20 to 49 (%)
Housing units in structures - Owners - 50 or more (%)
Housing units in structures - Owners - Mobile home (%)
Housing units in structures - Owners - Boat, RV, van, etc. (%)
Housing units in structures - Renters - 1, detached (%)
Housing units in structures - Renters - 1, attached (%)
Housing units in structures - Renters - 2 (%)
Housing units in structures - Renters - 3 or 4 (%)
Housing units in structures - Renters - 5 to 9 (%)
Housing units in structures - Renters - 10 to 19 (%)
Housing units in structures - Renters - 20 to 49 (%)
Housing units in structures - Renters - 50 or more (%)
Housing units in structures - Renters - Mobile home (%)
Housing units in structures - Renters - Boat, RV, van, etc. (%)
House/condo owner moved in on average (years ago)
Renter moved in on average (years ago)
Year householder moved into unit - Moved in 1999 to March 2000 (%)
Year householder moved into unit - Moved in 1999 to March 2000 (%) - White
Year householder moved into unit - Moved in 1999 to March 2000 (%) - Black or African American
Year householder moved into unit - Moved in 1999 to March 2000 (%) - Asian
Year householder moved into unit - Moved in 1999 to March 2000 (%) - Hispanic or Latino
Year householder moved into unit - Moved in 1999 to March 2000 (%) - American Indian and Alaska Native
Year householder moved into unit - Moved in 1999 to March 2000 (%) - Multirace
Year householder moved into unit - Moved in 1999 to March 2000 (%) - Other Race
Year householder moved into unit - Moved in 1995 to 1998 (%)
Year householder moved into unit - Moved in 1995 to 1998 (%) - White
Year householder moved into unit - Moved in 1995 to 1998 (%) - Black or African American
Year householder moved into unit - Moved in 1995 to 1998 (%) - Asian
Year householder moved into unit - Moved in 1995 to 1998 (%) - Hispanic or Latino
Year householder moved into unit - Moved in 1995 to 1998 (%) - American Indian and Alaska Native
Year householder moved into unit - Moved in 1995 to 1998 (%) - Multirace
Year householder moved into unit - Moved in 1995 to 1998 (%) - Other Race
Year householder moved into unit - Moved in 1990 to 1994 (%)
Year householder moved into unit - Moved in 1990 to 1994 (%) - White
Year householder moved into unit - Moved in 1990 to 1994 (%) - Black or African American
Year householder moved into unit - Moved in 1990 to 1994 (%) - Asian
Year householder moved into unit - Moved in 1990 to 1994 (%) - Hispanic or Latino
Year householder moved into unit - Moved in 1990 to 1994 (%) - American Indian and Alaska Native
Year householder moved into unit - Moved in 1990 to 1994 (%) - Multirace
Year householder moved into unit - Moved in 1990 to 1994 (%) - Other Race
Year householder moved into unit - Moved in 1980 to 1989 (%)
Year householder moved into unit - Moved in 1980 to 1989 (%) - White
Year householder moved into unit - Moved in 1980 to 1989 (%) - Black or African American
Year householder moved into unit - Moved in 1980 to 1989 (%) - Asian
Year householder moved into unit - Moved in 1980 to 1989 (%) - Hispanic or Latino
Year householder moved into unit - Moved in 1980 to 1989 (%) - American Indian and Alaska Native
Year householder moved into unit - Moved in 1980 to 1989 (%) - Multirace
Year householder moved into unit - Moved in 1980 to 1989 (%) - Other Race
Year householder moved into unit - Moved in 1970 to 1979 (%)
Year householder moved into unit - Moved in 1970 to 1979 (%) - White
Year householder moved into unit - Moved in 1970 to 1979 (%) - Black or African American
Year householder moved into unit - Moved in 1970 to 1979 (%) - Asian
Year householder moved into unit - Moved in 1970 to 1979 (%) - Hispanic or Latino
Year householder moved into unit - Moved in 1970 to 1979 (%) - American Indian and Alaska Native
Year householder moved into unit - Moved in 1970 to 1979 (%) - Multirace
Year householder moved into unit - Moved in 1970 to 1979 (%) - Other Race
Year householder moved into unit - Moved in 1969 or earlier (%)
Year householder moved into unit - Moved in 1969 or earlier (%) - White
Year householder moved into unit - Moved in 1969 or earlier (%) - Black or African American
Year householder moved into unit - Moved in 1969 or earlier (%) - Asian
Year householder moved into unit - Moved in 1969 or earlier (%) - Hispanic or Latino
Year householder moved into unit - Moved in 1969 or earlier (%) - American Indian and Alaska Native
Year householder moved into unit - Moved in 1969 or earlier (%) - Multirace
Year householder moved into unit - Moved in 1969 or earlier (%) - Other Race
Housing units lacking complete plumbing facilities (%)
Housing units lacking complete kitchen facilities (%)
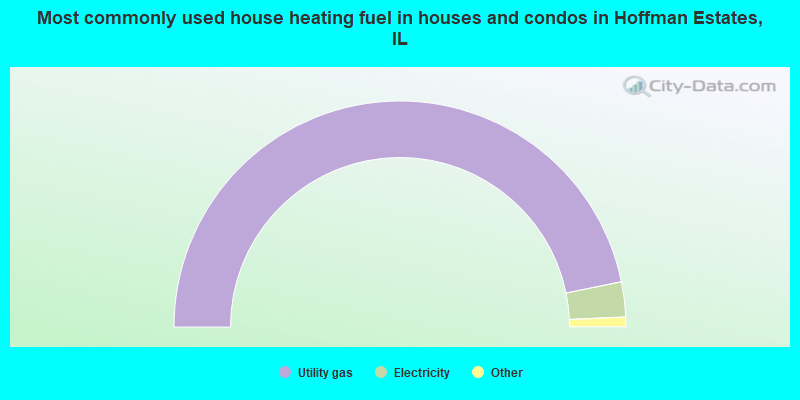
House heating fuel used in houses and condos - Utility gas (%)
House heating fuel used in houses and condos - Bottled, tank, or LP gas (%)
House heating fuel used in houses and condos - Electricity (%)
House heating fuel used in houses and condos - Fuel oil, kerosene, etc. (%)
House heating fuel used in houses and condos - Coal or coke (%)
House heating fuel used in houses and condos - Wood (%)
House heating fuel used in houses and condos - Solar energy (%)
House heating fuel used in houses and condos - Other fuel (%)
House heating fuel used in houses and condos - No fuel used (%)
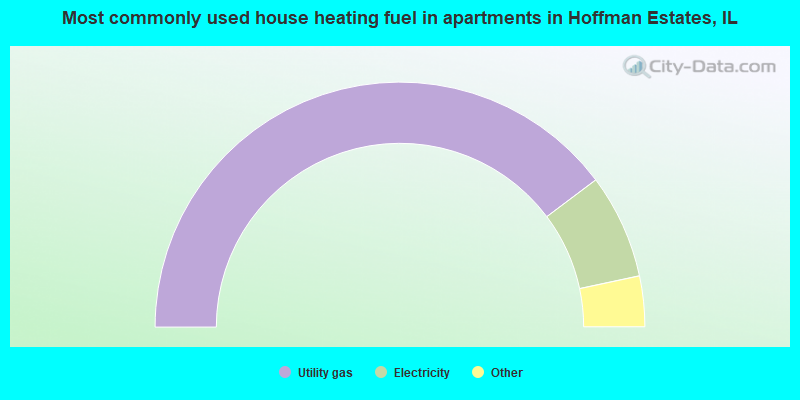
House heating fuel used in apartments - Utility gas (%)
House heating fuel used in apartments - Bottled, tank, or LP gas (%)
House heating fuel used in apartments - Electricity (%)
House heating fuel used in apartments - Fuel oil, kerosene, etc. (%)
House heating fuel used in apartments - Coal or coke (%)
House heating fuel used in apartments - Wood (%)
House heating fuel used in apartments - Solar energy (%)
House heating fuel used in apartments - Other fuel (%)
House heating fuel used in apartments - No fuel used (%)
Median year house/condo built: 1976Median year apartment built: 1979Household type by relationship:
Households: 50,594
Male householders: 10,192 (1,619 living alone ), Female householders: 7,771 (1,424 living alone )10,988 spouses (10,884 opposite-sex spouses ), 991 unmarried partners , (925 opposite-sex unmarried partners ), 16,304 children (15,570 natural , 329 adopted , 404 stepchildren ), 813 grandchildren , 462 brothers or sisters , 1,163 parents , 0 foster children , 956 other relatives , 726 non-relatives In group quarters: 223
Size of family households: 5,566 2-persons , 3,321 3-persons , 3,762 4-persons , 927 5-persons , 534 6-persons , 214 7-or-more-persons .
Size of nonfamily households: 3,269 1-person , 938 2-persons , 54 3-persons , 14 4-persons .
8,373 married couples with children. single-parent households (571 men , 1,305 women ).
53.8% of residents of Hoffman Estates speak English at home. of residents speak Spanish at home (67% speak English very well , 18% speak English well , 7% speak English not well , 8% don't speak English at all ).of residents speak other Indo-European language at home (64% speak English very well , 18% speak English well , 11% speak English not well , 6% don't speak English at all ).of residents speak Asian or Pacific Island language at home (65% speak English very well , 25% speak English well , 9% speak English not well , 2% don't speak English at all ).of residents speak other language at home (82% speak English very well , 7% speak English well , 8% speak English not well , 3% don't speak English at all ).
Foreign born population: 16,964 (33.5%)of them are naturalized citizens )
Median number of rooms in houses and condos:
Median number of rooms in apartments
Owner-occupied Renter-occupied
Rooms in owner-occupied houses in Hoffman Estates, Illinois
8 1 room 21 2 rooms 330 3 rooms 1,120 4 rooms 2,199 5 rooms 2,630 6 rooms 2,498 7 rooms 2,357 8 rooms 2,730 9+ rooms
Rooms in renter-occupied apartments in Hoffman Estates, Illinois
124 1 room 161 2 rooms 1,124 3 rooms 1,212 4 rooms 705 5 rooms 828 6 rooms 585 7 rooms 75 8 rooms 56 9+ rooms
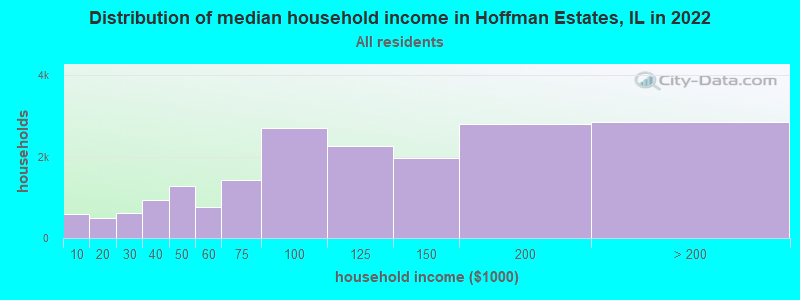
Hoffman Estates, IL household income distribution 582 Less than $10,000485 $10,000 to $19,999612 $20,000 to $29,999922 $30,000 to $39,9991,268 $40,000 to $49,999755 $50,000 to $59,9991,426 $60,000 to $74,9992,710 $75,000 to $99,9992,251 $100,000 to $124,9991,956 $125,000 to $149,9992,792 $150,000 to $199,9992,849 $200,000 or more
Home value of owner - occupied houses in 2022 in Hoffman Estates, IL 40 Less than $10,00034 $15,000 to $19,99910 $20,000 to $24,999120 $30,000 to $34,99938 $35,000 to $39,99923 $40,000 to $49,99916 $60,000 to $69,99927 $70,000 to $79,99977 $80,000 to $89,99931 $90,000 to $99,999290 $100,000 to $124,999252 $125,000 to $149,999609 $150,000 to $174,999493 $175,000 to $199,9991,290 $200,000 to $249,9992,259 $250,000 to $299,9994,537 $300,000 to $399,9992,760 $400,000 to $499,9991,158 $500,000 to $749,99943 $750,000 to $999,99977 $2,000,000 or moreRent paid by renters in 2022 in Hoffman Estates, IL 19 $350 to $39914 $500 to $5497 $700 to $7492 $750 to $799152 $800 to $899122 $900 to $999975 $1,000 to $1,2491,223 $1,250 to $1,4991,551 $1,500 to $1,999439 $2,000 to $2,499123 $2,500 to $2,99913 $3,000 to $3,499134 $3,500 or more91 No cash rent
Percentage of workers working in this county: 74.6%Number of people working at home: 5,321 (19.1% of all workers )
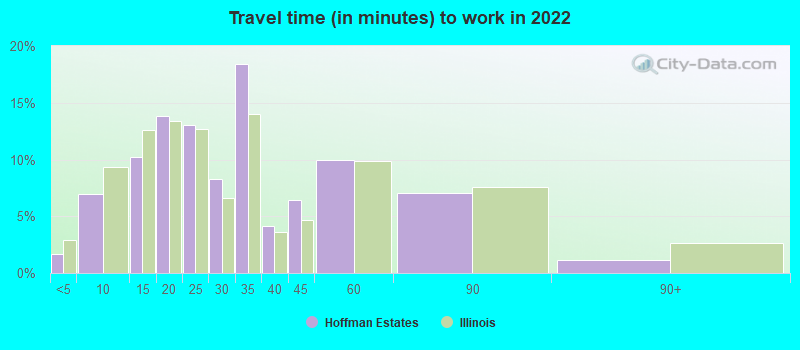
Travel time to work (commute)
Less than 5 minutes: 2715 to 9 minutes: 1,32110 to 14 minutes: 2,75215 to 19 minutes: 3,82620 to 24 minutes: 3,09025 to 29 minutes: 1,70930 to 34 minutes: 3,29135 to 39 minutes: 91240 to 44 minutes: 1,14845 to 59 minutes: 2,23660 to 89 minutes: 1,49590 or more minutes: 651
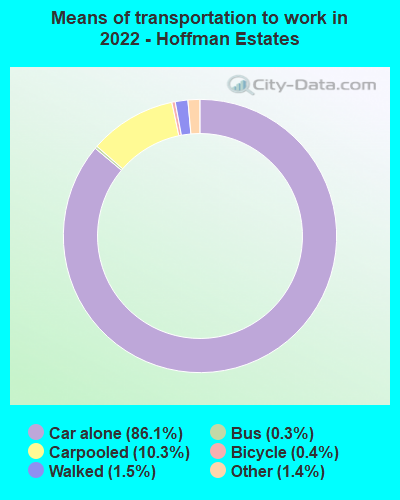
Means of transportation to work:
Drove a car alone: 16,566 (69.6%)Carpooled: 2,120 (8.9%)Bus : 62 (0.3%)Taxi: 273 (1.1%)Bicycle: 73 (0.3%)Walked: 302 (1.3%)Worked at home: 5,321 (22.4%)
Unemployment by race in 2022
Unemployment rate for White non-Hispanic residents 3.7% Males2.6% FemalesUnemployment rate for Black residents 6.2% Males2.5% FemalesUnemployment rate for Asian residents 2.8% Males3.2% FemalesUnemployment rate for other race residents 1.9% MalesUnemployment rate for two or more race residents 1.7% MalesUnemployment rate for Hispanic or Latino residents 1.7% Males0.5% Females
Year of entry for the foreign-born population in Hoffman Estates, Illinois
5,872 2010 or later 4,411 2000 to 2009 3,624 1990 to 1999 2,915 1980 to 1989 1,938 1970 to 1979 1,331 Before 1970
First ancestries reported:
Polish: 2,032 (7.1%)
German: 1,366 (4.8%)
Italian: 1,088 (3.8%)
Irish: 805 (2.8%)
American: 726 (2.5%)
English: 636 (2.2%)
Romanian: 590 (2.1%)
Assyrian: 484 (1.7%)
Serbian: 336 (1.2%)
European: 315 (1.1%)
Nigerian: 286 (1.0%)
Syrian: 245 (0.9%)
Greek: 240 (0.8%)
Bulgarian: 225 (0.8%)
African: 173 (0.6%)
Swedish: 170 (0.6%)
Ukrainian: 154 (0.5%)
Albanian: 120 (0.4%)
Russian: 118 (0.4%)
West Indian: 112 (0.4%)
Palestinian: 110 (0.4%)
Eastern European: 101 (0.4%)
Norwegian: 90 (0.3%)
Czech: 88 (0.3%)
Haitian: 87 (0.3%)
Turkish: 79 (0.3%)
French: 65 (0.2%)
Scottish: 62 (0.2%)
Jamaican: 60 (0.2%)
Croatian: 58 (0.2%)
Iranian: 58 (0.2%)
Egyptian: 53 (0.2%)
Scandinavian: 47 (0.2%)
Scotch-Irish: 43 (0.1%)
Moroccan: 39 (0.1%)
Arab: 35 (0.1%)
Estonian: 33 (0.1%)
Armenian: 30 (0.1%)
French Canadian: 27 (0.09%)
Luxembourger: 26 (0.09%)
Dutch: 22 (0.08%)
Lithuanian: 21 (0.07%)
Czechoslovakian: 18 (0.06%)
Iraqi: 16 (0.06%)
Welsh: 15 (0.05%)
British: 14 (0.05%)
Yugoslavian: 11 (0.04%)
Slovak: 10 (0.03%)
Hungarian: 10 (0.03%)
Macedonian: 10 (0.03%)
Canadian: 6 (0.02%)
Danish: 5 (0.02%)
Austrian: 4 (0.01%)
Most common places of birth for foreign-born residents (%): India Hoffman Estates:
28.9% (4,907)Illinois:
9.2% (166,409)
Mexico Hoffman Estates:
18.2% (3,094)Illinois:
34.7% (626,958)
Philippines Hoffman Estates:
9.5% (1,620)Illinois:
5.2% (93,003)
Poland Hoffman Estates:
5.2% (885)Illinois:
6.9% (124,474)
Japan Hoffman Estates:
4.6% (776)Illinois:
0.6% (10,943)
Korea Hoffman Estates:
4.3% (722)Illinois:
2.2% (40,393)
China, excluding Hong Kong and Taiwan Hoffman Estates:
3.2% (550)Illinois:
4.1% (74,364)
Serbia Hoffman Estates:
1.9% (329)Illinois:
0.5% (8,574)
Nigeria Hoffman Estates:
1.8% (304)Illinois:
1.2% (21,186)
Syria Hoffman Estates:
1.6% (268)Illinois:
0.4% (6,781)
Place of birth for U.S.-born residents:
This state: 26,854Other state: 5,856Northeast: 1,160Midwest: 2,525South: 1,018West: 1,181 91.2% of Hoffman Estates residents lived in the same house 1 years ago.
Out of people who lived in different houses, 43.4% lived in this county.
Out of people who lived in different counties, 74.0% lived in Illinois.
Hoffman Estates:
91.2%State average:
88.3%
Education attainment for males 25 years and older:
No schooling: 244Nursery to 4th grade: 1995th and 6th grade: 2147th and 8th grade: 1439th grade: 11210th grade: 10211th grade: 13212th grade, no diploma: 350High school graduate (or equivalency): 2,774Less than 1 year of college: 1,004Some college more than 1 year, no degree: 1,903Associate degree: 1,212Bachelor's degree: 5,622Master's degree: 2,602Professional school degree: 557Doctorate degree: 252
Education attainment for females 25 years and older:
No schooling: 374Nursery to 4th grade: 1545th and 6th grade: 1247th and 8th grade: 1589th grade: 12210th grade: 17711th grade: 9912th grade, no diploma: 369High school graduate (or equivalency): 3,145Less than 1 year of college: 980Some college more than 1 year, no degree: 1,931Associate degree: 1,669Bachelor's degree: 5,641Master's degree: 2,418Professional school degree: 275Doctorate degree: 319
Housing units in structures:
One, detached: 11,750One, attached: 2,917Two: 1563 or 4: 7805 to 9: 1,01810 to 19: 1,15820 to 49: 79950 or more: 782Mobile homes: 12Boats, RVs, vans, etc.: 18Housing units lacking complete plumbing facilities in 2022: 0.3%Housing units lacking complete kitchen facilities in 2022: 1.1%House/condo owner moved in on average 13 years ago
Renter moved in on average 2 years ago
Private vs. public school enrollment:
Students in private schools in grades 1 to 8 (elementary and middle school): 465 Students in private schools in grades 9 to 12 (high school): 70 Students in private undergraduate colleges: 396