Housing density: 2,006 houses/condos per square mile
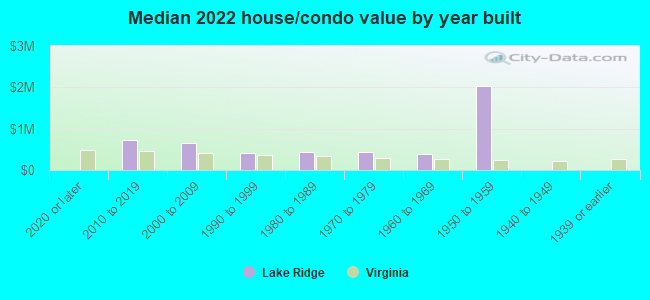
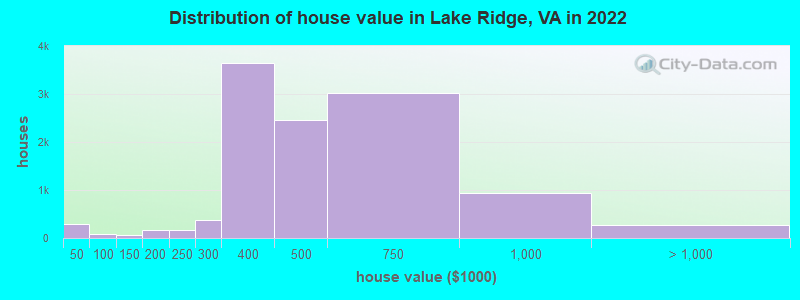
Median price asked for vacant for-sale houses and condos in 2022: $473,717.
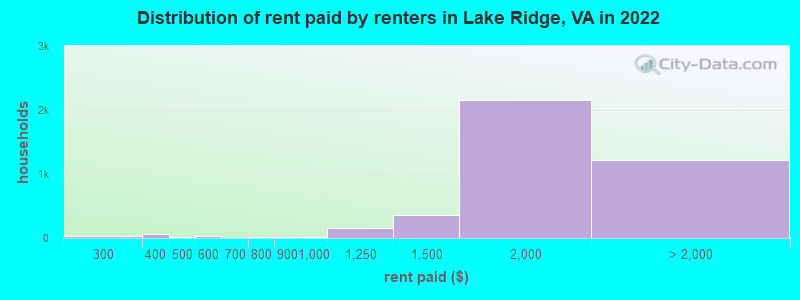
Median contract rent in 2022: $1,780 (lower quartile is $1,504, upper quartile is over $2,000)
Median rent asked for vacant for-rent units in 2022: $2,572
Median gross rent in Lake Ridge, VA in 2022: $1,899
Housing units in Lake Ridge with a mortgage: 9,285 (899 second mortgage, 0 home equity loan, 844 both second mortgage and home equity loan) Houses without a mortgage: 105
Median household income for houses/condos with a mortgage: $133,846
Median household income for apartments without a mortgage: $112,380
Median monthly housing costs: $1,929
Compare current foreclosures near Lake Ridge, VA:
#1
$359,900
Wilson Ln Apt 204
Mc Lean, VA 22102
925
sq. feet
1
baths
2
beds
#2
Yoakum Pkwy Apt 22304
Alexandria, VA 22304
1,098
sq. feet
2
baths
1
beds
#3
Beechcliff Dr
Alexandria, VA 22306
2,365
sq. feet
3
baths
3
beds
#4
Commonwealth Blvd
Fairfax, VA 22032
1,500
sq. feet
3
baths
4
beds
#5
Sleepy Hollow Rd
Falls Church, VA 22042
2,112
sq. feet
3
baths
4
beds
#6
Lee Landing Dr
Falls Church, VA 22043
900
sq. feet
2
baths
2
beds
#7
Leocrie Pl
Woodbridge, VA 22191
3,828
sq. feet
4
baths
4
beds
#8
Georgian Ct
Manassas, VA 20110
1,116
sq. feet
1
baths
3
beds
#9
Willoughby Ct
Chantilly, VA 20151
950
sq. feet
2
baths
4
beds
#10
Dubois Ct
Woodbridge, VA 22193
1,356
sq. feet
2
baths
4
beds
#11
Prather Pl
Woodbridge, VA 22193
1,228
sq. feet
2
baths
3
beds
#12
Patriot Dr Apt 3
Annandale, VA 22003
666
sq. feet
1
baths
1
beds
#13
Rugby Rd
Manassas, VA 20111
2,023
sq. feet
1
baths
3
beds
#14
Seminary Rd Apt 1808s
Falls Church, VA 22041
1,439
sq. feet
2
baths
2
beds
#15
Mathews Dr
Woodbridge, VA 22191
1,523
sq. feet
1
baths
4
beds
#16
Glyndon St SE
Vienna, VA 22180
1,393
sq. feet
3
baths
5
beds
#17
Pennington Pl
Vienna, VA 22181
1,948
sq. feet
4
baths
3
beds
#18
Culpeper Dr
Woodbridge, VA 22191
1,224
sq. feet
3
baths
4
beds
#19
Rolling Spring Ct
Springfield, VA 22152
3,365
sq. feet
4
baths
4
beds
#20
Kincheloe Rd
Clifton, VA 20124
4,492
sq. feet
4
baths
5
beds
#21
Gardenview Loop
Woodbridge, VA 22191
1,110
sq. feet
2
baths
2
beds
#22
Counsellor Dr
Vienna, VA 22181
1,916
sq. feet
2
baths
5
beds
#23
Wilson Boulevard, Unit 101, Falls Church, Va 22044
6,715 married couples with children.
2,709 single-parent households (645 men, 2,064 women).
67.9% of residents of Lake Ridge speak English at home.
14.7% of residents speak Spanish at home (67% speak English very well, 20% speak English well, 10% speak English not well, 2% don't speak English at all).
6.2% of residents speak other Indo-European language at home (77% speak English very well, 16% speak English well, 6% speak English not well, 1% don't speak English at all).
4.1% of residents speak Asian or Pacific Island language at home (61% speak English very well, 28% speak English well, 11% speak English not well).
7.6% of residents speak other language at home (66% speak English very well, 25% speak English well, 7% speak English not well, 2% don't speak English at all).
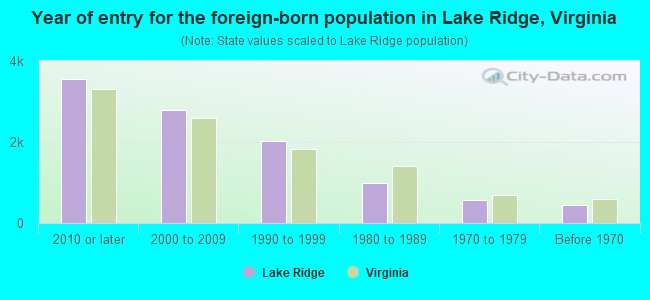
Foreign born population: 10,327 (22.8%)
(65.4% of them are naturalized citizens)
Year of entry for the foreign-born population in Lake Ridge, Virginia
3,5572010 or later
2,7972000 to 2009
2,0311990 to 1999
9921980 to 1989
5721970 to 1979
451Before 1970
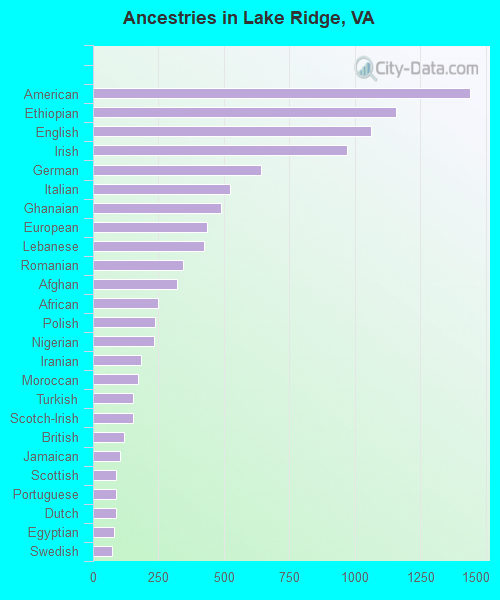
First ancestries reported:
American: 1,440 (6.3%)
Ethiopian: 1,156 (5.1%)
English: 1,063 (4.7%)
Irish: 971 (4.3%)
German: 642 (2.8%)
Italian: 524 (2.3%)
Ghanaian: 489 (2.1%)
European: 434 (1.9%)
Lebanese: 424 (1.9%)
Romanian: 342 (1.5%)
Afghan: 319 (1.4%)
African: 247 (1.1%)
Polish: 235 (1.0%)
Nigerian: 234 (1.0%)
Iranian: 182 (0.8%)
Moroccan: 173 (0.8%)
Turkish: 151 (0.7%)
Scotch-Irish: 151 (0.7%)
British: 117 (0.5%)
Jamaican: 105 (0.5%)
Scottish: 88 (0.4%)
Portuguese: 88 (0.4%)
Dutch: 86 (0.4%)
Egyptian: 79 (0.3%)
Swedish: 72 (0.3%)
Haitian: 68 (0.3%)
West Indian: 63 (0.3%)
Ukrainian: 60 (0.3%)
Syrian: 55 (0.2%)
Greek: 54 (0.2%)
Arab: 48 (0.2%)
Armenian: 47 (0.2%)
Finnish: 46 (0.2%)
Russian: 42 (0.2%)
Canadian: 40 (0.2%)
Slovak: 38 (0.2%)
Albanian: 37 (0.2%)
Norwegian: 36 (0.2%)
Liberian: 36 (0.2%)
Sudanese: 32 (0.1%)
French: 30 (0.1%)
Belgian: 27 (0.1%)
Iraqi: 22 (0.10%)
Scandinavian: 19 (0.08%)
Czechoslovakian: 19 (0.08%)
Austrian: 19 (0.08%)
Sierra Leonean: 18 (0.08%)
Estonian: 16 (0.07%)
Danish: 15 (0.07%)
Hungarian: 14 (0.06%)
Trinidadian and Tobagonian: 14 (0.06%)
Eastern European: 11 (0.05%)
Slavic: 10 (0.04%)
Croatian: 10 (0.04%)
French Canadian: 8 (0.04%)
Serbian: 8 (0.04%)
Welsh: 8 (0.04%)
Swiss: 7 (0.03%)
Most common places of birth for foreign-born residents (%):
El Salvador
Lake Ridge:
13.9% (1,486)
Virginia:
9.9% (107,534)
Ethiopia
Lake Ridge:
8.6% (916)
Virginia:
2.9% (32,082)
Afghanistan
Lake Ridge:
4.3% (464)
Virginia:
1.8% (19,426)
Argentina
Lake Ridge:
4.1% (444)
Virginia:
0.5% (4,997)
Eritrea
Lake Ridge:
3.7% (397)
Virginia:
0.3% (3,058)
Ghana
Lake Ridge:
3.7% (395)
Virginia:
1.6% (17,346)
Bolivia
Lake Ridge:
3.7% (394)
Virginia:
2.4% (25,722)
Peru
Lake Ridge:
3.5% (378)
Virginia:
2.4% (26,366)
Philippines
Lake Ridge:
3.5% (374)
Virginia:
4.8% (52,629)
Pakistan
Lake Ridge:
3.3% (350)
Virginia:
2.3% (24,582)
Lebanon
Lake Ridge:
3.1% (330)
Virginia:
0.5% (5,428)
Mexico
Lake Ridge:
2.8% (297)
Virginia:
5.3% (57,498)
Panama
Lake Ridge:
2.6% (277)
Virginia:
0.4% (4,196)
India
Lake Ridge:
2.2% (237)
Virginia:
9.0% (97,830)
Korea
Lake Ridge:
2.0% (211)
Virginia:
4.9% (52,857)
Romania
Lake Ridge:
2.0% (211)
Virginia:
0.3% (2,805)
Egypt
Lake Ridge:
1.6% (171)
Virginia:
0.9% (9,672)
Place of birth for U.S.-born residents:
This state: 15,422
Other state: 17,810
Northeast: 4,699
Midwest: 3,556
South: 6,587
West: 3,038
88.4% of Lake Ridge residents lived in the same house 1 years ago. Out of people who lived in different houses, 25.9% lived in this county. Out of people who lived in different counties, 63.7% lived in Virginia.
Lake Ridge:
88.4%
State average:
86.6%
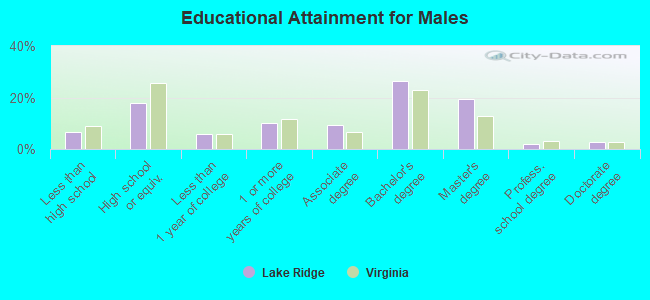
Education attainment for males 25 years and older:
No schooling: 169
Nursery to 4th grade: 166
5th and 6th grade: 176
7th and 8th grade: 49
9th grade: 49
10th grade: 24
11th grade: 23
12th grade, no diploma: 272
High school graduate (or equivalency): 2,447
Less than 1 year of college: 794
Some college more than 1 year, no degree: 1,388
Associate degree: 1,272
Bachelor's degree: 3,634
Master's degree: 2,700
Professional school degree: 265
Doctorate degree: 356
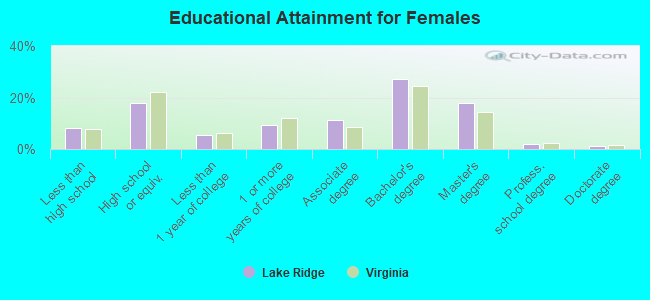
Education attainment for females 25 years and older:
No schooling: 500
Nursery to 4th grade: 11
5th and 6th grade: 151
7th and 8th grade: 127
9th grade: 89
10th grade: 60
11th grade: 41
12th grade, no diploma: 330
High school graduate (or equivalency): 2,892
Less than 1 year of college: 920
Some college more than 1 year, no degree: 1,552
Associate degree: 1,808
Bachelor's degree: 4,430
Master's degree: 2,936
Professional school degree: 310
Doctorate degree: 172
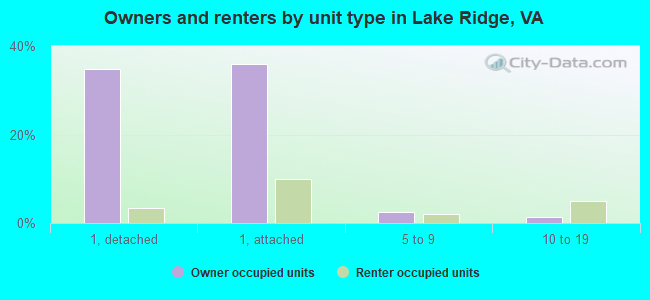
Housing units in structures:
One, detached: 6,354
One, attached: 7,391
Two: 11
3 or 4: 392
5 to 9: 687
10 to 19: 791
20 to 49: 243
50 or more: 558
Mobile homes: 100
Housing units lacking complete plumbing facilities in 2022: 0.1%
Housing units lacking complete kitchen facilities in 2022: 0.2%
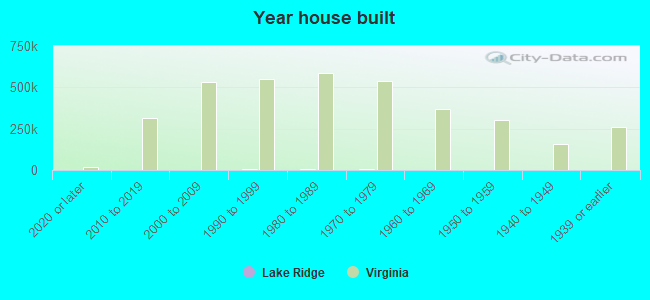
House/condo owner moved in on average 11 years ago