Madison Heights, MI (Michigan) Houses and Residents
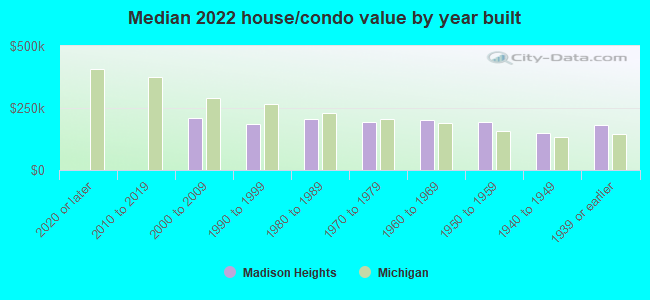
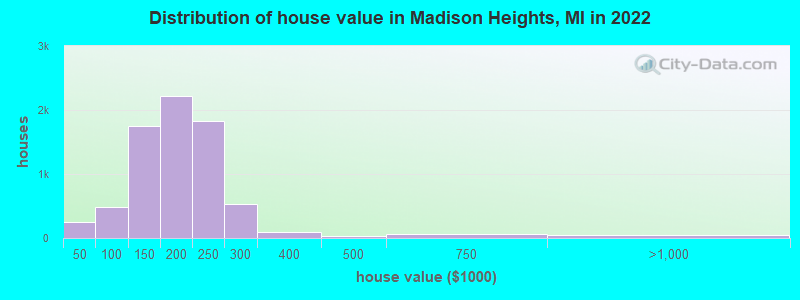
Estimated median house or condo value in 2022: $188,451 (it was $108,800 in 2000 )
Madison Heights:
$188,451Michigan:
$224,400
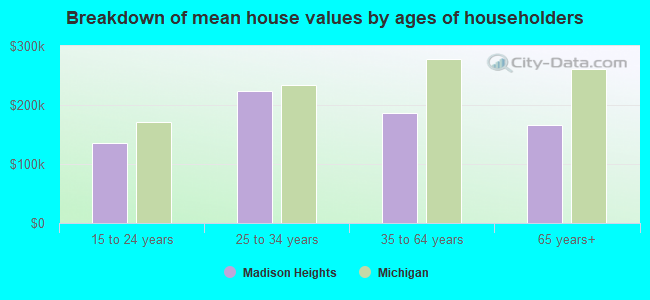
Lower value quartile - upper value quartile: $140,775 - $230,280Mean price in 2022: Detached houses: $195,487 Here:
$195,487State:
$280,038
Townhouses or other attached units: $197,000 Here:
$197,000State:
$239,520
In 3-to-4-unit structures: $156,276 Here:
$156,276State:
$207,067
Mobile homes: $100,877 Here:
$100,877State:
$72,868
Total population: 30,267 (All urban)
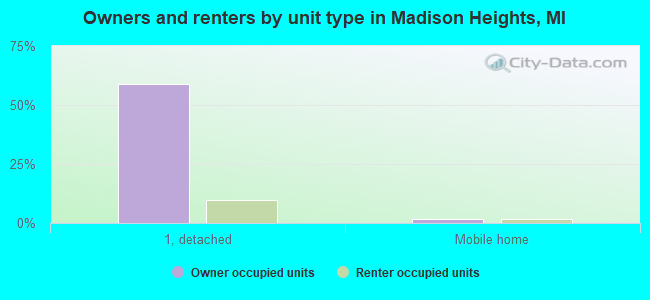
Houses: 14,434 (13,605 occupied: 8,502 owner occupied, 5,107 renter occupied )
% of renters here:
38%State:
27%
Housing density: 2,015 houses/condos per square mile
Median price asked for vacant for-sale houses and condos in 2022: $122,141.
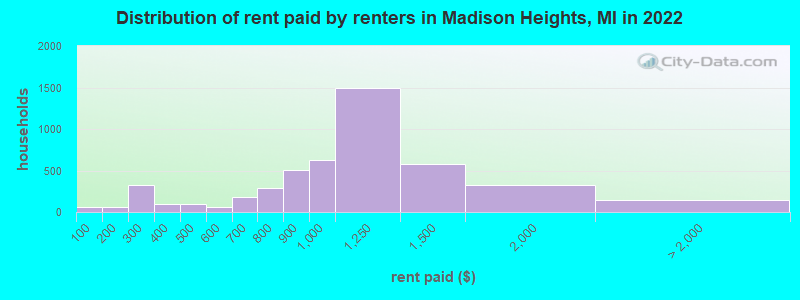
Median contract rent in 2022: $1,021 (lower quartile is $815, upper quartile is $1,241)
Median rent asked for vacant for-rent units in 2022: $1,173
Median gross rent in Madison Heights, MI in 2022: $1,102
Housing units in Madison Heights with a mortgage: 5,241 (358 second mortgage, 0 home equity loan, 275 both second mortgage and home equity loan )Houses without a mortgage: 338
Median household income for houses/condos with a mortgage: $86,527
Median household income for apartments without a mortgage: $55,333
Median monthly housing costs: $1,009
Data:
Median house or condo value ($)
Median house or condo value ($ change since 2000)
Median house or condo value ($) - White
Median house or condo value ($) - Black or African American
Median house or condo value ($) - Asian
Median house or condo value ($) - Hispanic or Latino
Median house or condo value ($) - American Indian and Alaska Native
Median house or condo value ($) - Multirace
Median house or condo value ($) - Other Race
Median price asked for mobile homes ($)
Household density (households per square mile)
Mean house or condo value by units in structure - 1, detached ($)
Mean house or condo value by units in structure - 1, attached ($)
Mean house or condo value by units in structure - 2 ($)
Mean house or condo value by units in structure by units in structure - 3 or 4 ($)
Mean house or condo value by units in structure - 5 or more ($)
Mean house or condo value by units in structure - Boat, RV, van, etc. ($)
Mean house or condo value by units in structure - Mobile home ($)
Median contract rent ($)
Median contract rent - Lower quartile ($)
Median contract rent - Upper quartile ($)
Median gross rent ($)
Urban houses (%)
Rural houses (%)
Houses occupied (%)
Houses occupied (% change since 2000)
Houses owner occupied (%)
Houses owner occupied (% change since 2000)
Houses renter occupied (%)
Houses renter occupied (% change since 2000)
Vacant housing units - For rent (%)
Vacant housing units - For rent (% change since 2000)
Vacant housing units - For sale only (%)
Vacant housing units - For sale only (% change since 2000)
Vacant housing units - Rented or sold, not occupied (%)
Vacant housing units - Rented or sold, not occupied (% change since 2000)
Vacant housing units - For seasonal, recreational, or occasional use (%)
Vacant housing units - For seasonal, recreational, or occasional use (% change since 2000)
Vacant housing units - For migrant workers (%)
Vacant housing units - For migrant workers (% change since 2000)
Vacant housing units - Other vacant (%)
Vacant housing units - Other vacant (% change since 2000)
Median monthly housing costs ($)
Median household income for houses/condos with a mortgage ($)
Median household income for houses/condos without a mortgage ($)
Median household income ($)
Median household income ($) - White
Median household income ($) - Black or African American
Median household income ($) - Asian
Median household income ($) - Hispanic or Latino
Median household income ($) - American Indian and Alaska Native
Median household income ($) - Multirace
Median household income ($) - Other Race
Mortgage status - with mortgage (%)
Mortgage status - with second mortgage (%)
Mortgage status - with home equity loan (%)
Mortgage status - with both second mortgage and home equity loan (%)
Mortgage status - without a mortgage (%)
Median year house/condo built
Median year apartment built
Household type by relationship - Male householder living alone (%)
Household type by relationship - Male householder not living alone (%)
Household type by relationship - Female householder living alone (%)
Household type by relationship - Female householder not living alone (%)
Household type by relationship - Opposite-Sex spouse (%)
Household type by relationship - Same-Sex spouse (%)
Household type by relationship - Opposite-Sex unmarried partner (%)
Household type by relationship - Same-Sex unmarried partner (%)
Household type by relationship - In group quarters (%)
Size of family households - 2-person household (%)
Size of family households - 3-person household (%)
Size of family households - 4-person household (%)
Size of family households - 5-person household (%)
Size of family households - 6-person household (%)
Size of family households - 7-or-more-person household (%)
Size of nonfamily households - 1-person household (%)
Size of nonfamily households - 2-person household (%)
Size of nonfamily households - 3-person household (%)
Size of nonfamily households - 4-person household (%)
Size of nonfamily households - 5-person household (%)
Size of nonfamily households - 6-person household (%)
Size of nonfamily households - 7-or-moreperson household (%)
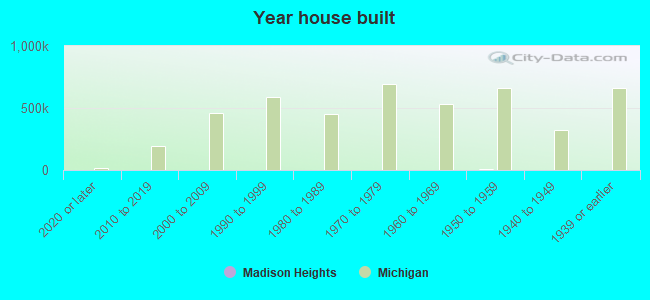
Year house built - Built 2010 or later (%)
Year house built - Built 2000 to 2009 (%)
Year house built - Built 1990 to 1999 (%)
Year house built - Built 1980 to 1989 (%)
Year house built - Built 1970 to 1979 (%)
Year house built - Built 1960 to 1969 (%)
Year house built - Built 1950 to 1959 (%)
Year house built - Built 1940 to 1949 (%)
Year house built - Built 1939 or earlier (%)
Median number of rooms in houses and condos
Median number of rooms in apartments
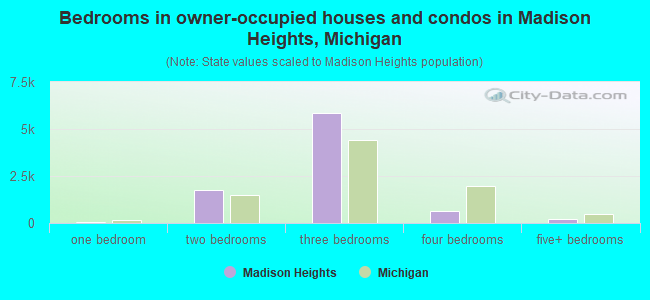
Median number of bedrooms in owner occupied houses
Mean number of bedrooms in owner occupied houses
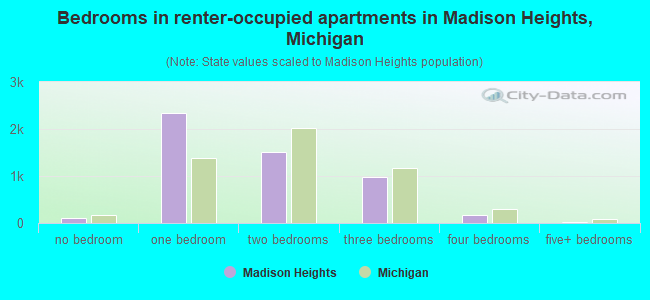
Median number of bedrooms in renter occupied houses
Mean number of bedrooms in renter occupied houses
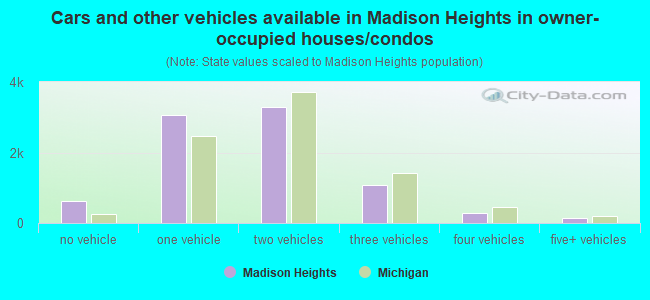
Median number of vehichles in owner occupied houses
Mean number of vehichles in owner occupied houses
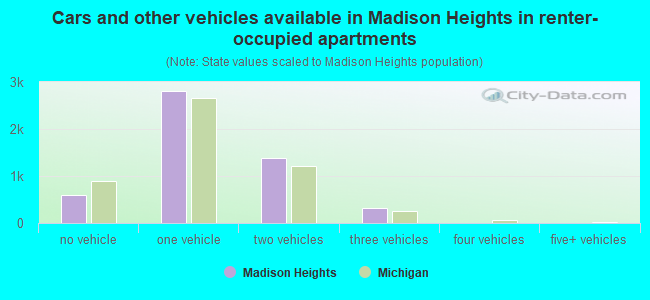
Median number of vehichles in renter occupied houses
Mean number of vehichles in renter occupied houses
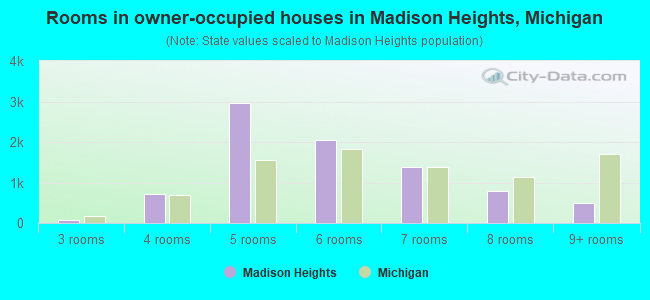
Rooms in owner-occupied houses - 1 room (%)
Rooms in owner-occupied houses - 2 rooms (%)
Rooms in owner-occupied houses - 3 rooms (%)
Rooms in owner-occupied houses - 4 rooms (%)
Rooms in owner-occupied houses - 5 rooms (%)
Rooms in owner-occupied houses - 6 rooms (%)
Rooms in owner-occupied houses - 7 rooms (%)
Rooms in owner-occupied houses - 8 rooms (%)
Rooms in owner-occupied houses - 9+ rooms (%)
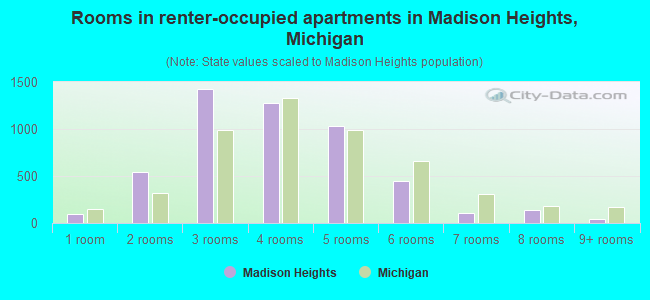
Rooms in renter-occupied houses - 1 room (%)
Rooms in renter-occupied houses - 2 rooms (%)
Rooms in renter-occupied houses - 3 rooms (%)
Rooms in renter-occupied houses - 4 rooms (%)
Rooms in renter-occupied houses - 5 rooms (%)
Rooms in renter-occupied houses - 6 rooms (%)
Rooms in renter-occupied houses - 7 rooms (%)
Rooms in renter-occupied houses - 8 rooms (%)
Rooms in renter-occupied houses - 9+ rooms (%)
Bedrooms in owner-occupied houses - no bedrooms (%)
Bedrooms in owner-occupied houses - 1 bedroom (%)
Bedrooms in owner-occupied houses - 2 bedrooms (%)
Bedrooms in owner-occupied houses - 3 bedrooms (%)
Bedrooms in owner-occupied houses - 4 bedrooms (%)
Bedrooms in owner-occupied houses - 5+ bedrooms (%)
Bedrooms in renter-occupied houses - no bedrooms (%)
Bedrooms in renter-occupied houses - 1 bedroom (%)
Bedrooms in renter-occupied houses - 2 bedrooms (%)
Bedrooms in renter-occupied houses - 3 bedrooms (%)
Bedrooms in renter-occupied houses - 4 bedrooms (%)
Bedrooms in renter-occupied houses - 5+ bedrooms (%)
Vehicles available in owner-occupied houses - no vehicle available (%)
Vehicles available in owner-occupied houses - 1 vehicle available(%)
Vehicles available in owner-occupied houses - 2 Vehicles available (%)
Vehicles available in owner-occupied houses - 3 Vehicles available (%)
Vehicles available in owner-occupied houses - 4 Vehicles available (%)
Vehicles available in owner-occupied houses - 5+ Vehicles available (%)
Vehicles available in renter-occupied houses - no vehicle available (%)
Vehicles available in renter-occupied houses - 1 vehicle available (%)
Vehicles available in renter-occupied houses - 2 Vehicles available (%)
Vehicles available in renter-occupied houses - 3 Vehicles available (%)
Vehicles available in renter-occupied houses - 4 Vehicles available (%)
Vehicles available in renter-occupied houses - 5+ Vehicles available (%)
Housing units in structures - 1, detached (%)
Housing units in structures - 1, attached (%)
Housing units in structures - 2 (%)
Housing units in structures - 3 or 4 (%)
Housing units in structures - 5 to 9 (%)
Housing units in structures - 10 to 19 (%)
Housing units in structures - 20 to 49 (%)
Housing units in structures - 50 or more (%)
Housing units in structures - Mobile home (%)
Housing units in structures - Boat, RV, van, etc. (%)
Housing units in structures - Owners - 1, detached (%)
Housing units in structures - Owners - 1, attached (%)
Housing units in structures - Owners - 2 (%)
Housing units in structures - Owners - 3 or 4 (%)
Housing units in structures - Owners - 5 to 9 (%)
Housing units in structures - Owners - 10 to 19 (%)
Housing units in structures - Owners - 20 to 49 (%)
Housing units in structures - Owners - 50 or more (%)
Housing units in structures - Owners - Mobile home (%)
Housing units in structures - Owners - Boat, RV, van, etc. (%)
Housing units in structures - Renters - 1, detached (%)
Housing units in structures - Renters - 1, attached (%)
Housing units in structures - Renters - 2 (%)
Housing units in structures - Renters - 3 or 4 (%)
Housing units in structures - Renters - 5 to 9 (%)
Housing units in structures - Renters - 10 to 19 (%)
Housing units in structures - Renters - 20 to 49 (%)
Housing units in structures - Renters - 50 or more (%)
Housing units in structures - Renters - Mobile home (%)
Housing units in structures - Renters - Boat, RV, van, etc. (%)
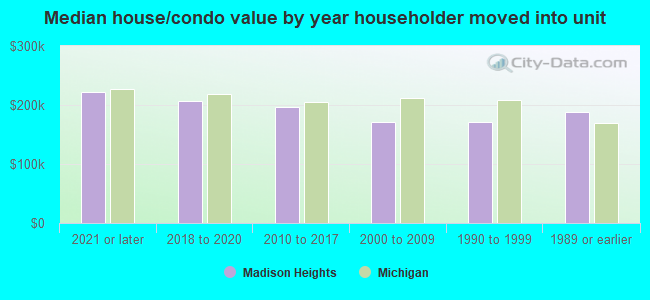
House/condo owner moved in on average (years ago)
Renter moved in on average (years ago)
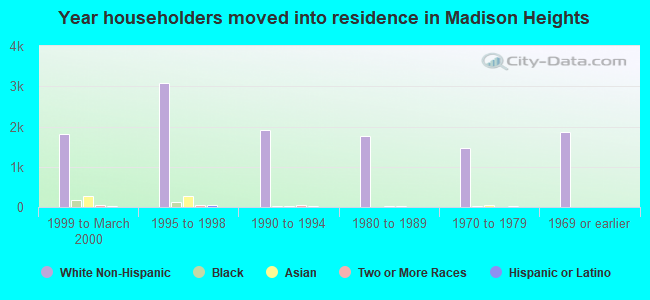
Year householder moved into unit - Moved in 1999 to March 2000 (%)
Year householder moved into unit - Moved in 1999 to March 2000 (%) - White
Year householder moved into unit - Moved in 1999 to March 2000 (%) - Black or African American
Year householder moved into unit - Moved in 1999 to March 2000 (%) - Asian
Year householder moved into unit - Moved in 1999 to March 2000 (%) - Hispanic or Latino
Year householder moved into unit - Moved in 1999 to March 2000 (%) - American Indian and Alaska Native
Year householder moved into unit - Moved in 1999 to March 2000 (%) - Multirace
Year householder moved into unit - Moved in 1999 to March 2000 (%) - Other Race
Year householder moved into unit - Moved in 1995 to 1998 (%)
Year householder moved into unit - Moved in 1995 to 1998 (%) - White
Year householder moved into unit - Moved in 1995 to 1998 (%) - Black or African American
Year householder moved into unit - Moved in 1995 to 1998 (%) - Asian
Year householder moved into unit - Moved in 1995 to 1998 (%) - Hispanic or Latino
Year householder moved into unit - Moved in 1995 to 1998 (%) - American Indian and Alaska Native
Year householder moved into unit - Moved in 1995 to 1998 (%) - Multirace
Year householder moved into unit - Moved in 1995 to 1998 (%) - Other Race
Year householder moved into unit - Moved in 1990 to 1994 (%)
Year householder moved into unit - Moved in 1990 to 1994 (%) - White
Year householder moved into unit - Moved in 1990 to 1994 (%) - Black or African American
Year householder moved into unit - Moved in 1990 to 1994 (%) - Asian
Year householder moved into unit - Moved in 1990 to 1994 (%) - Hispanic or Latino
Year householder moved into unit - Moved in 1990 to 1994 (%) - American Indian and Alaska Native
Year householder moved into unit - Moved in 1990 to 1994 (%) - Multirace
Year householder moved into unit - Moved in 1990 to 1994 (%) - Other Race
Year householder moved into unit - Moved in 1980 to 1989 (%)
Year householder moved into unit - Moved in 1980 to 1989 (%) - White
Year householder moved into unit - Moved in 1980 to 1989 (%) - Black or African American
Year householder moved into unit - Moved in 1980 to 1989 (%) - Asian
Year householder moved into unit - Moved in 1980 to 1989 (%) - Hispanic or Latino
Year householder moved into unit - Moved in 1980 to 1989 (%) - American Indian and Alaska Native
Year householder moved into unit - Moved in 1980 to 1989 (%) - Multirace
Year householder moved into unit - Moved in 1980 to 1989 (%) - Other Race
Year householder moved into unit - Moved in 1970 to 1979 (%)
Year householder moved into unit - Moved in 1970 to 1979 (%) - White
Year householder moved into unit - Moved in 1970 to 1979 (%) - Black or African American
Year householder moved into unit - Moved in 1970 to 1979 (%) - Asian
Year householder moved into unit - Moved in 1970 to 1979 (%) - Hispanic or Latino
Year householder moved into unit - Moved in 1970 to 1979 (%) - American Indian and Alaska Native
Year householder moved into unit - Moved in 1970 to 1979 (%) - Multirace
Year householder moved into unit - Moved in 1970 to 1979 (%) - Other Race
Year householder moved into unit - Moved in 1969 or earlier (%)
Year householder moved into unit - Moved in 1969 or earlier (%) - White
Year householder moved into unit - Moved in 1969 or earlier (%) - Black or African American
Year householder moved into unit - Moved in 1969 or earlier (%) - Asian
Year householder moved into unit - Moved in 1969 or earlier (%) - Hispanic or Latino
Year householder moved into unit - Moved in 1969 or earlier (%) - American Indian and Alaska Native
Year householder moved into unit - Moved in 1969 or earlier (%) - Multirace
Year householder moved into unit - Moved in 1969 or earlier (%) - Other Race
Housing units lacking complete plumbing facilities (%)
Housing units lacking complete kitchen facilities (%)
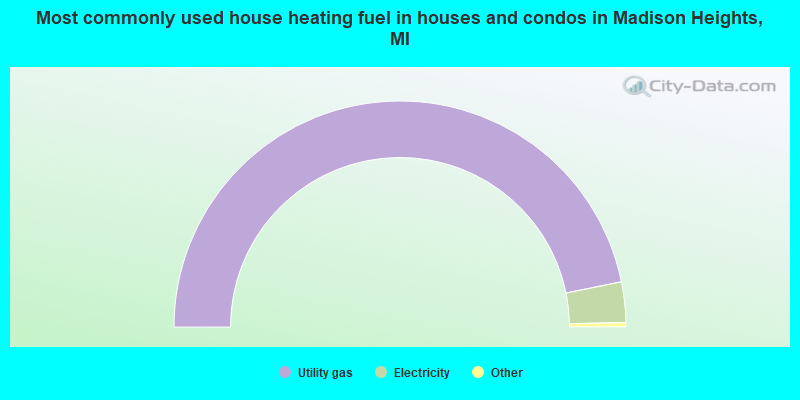
House heating fuel used in houses and condos - Utility gas (%)
House heating fuel used in houses and condos - Bottled, tank, or LP gas (%)
House heating fuel used in houses and condos - Electricity (%)
House heating fuel used in houses and condos - Fuel oil, kerosene, etc. (%)
House heating fuel used in houses and condos - Coal or coke (%)
House heating fuel used in houses and condos - Wood (%)
House heating fuel used in houses and condos - Solar energy (%)
House heating fuel used in houses and condos - Other fuel (%)
House heating fuel used in houses and condos - No fuel used (%)
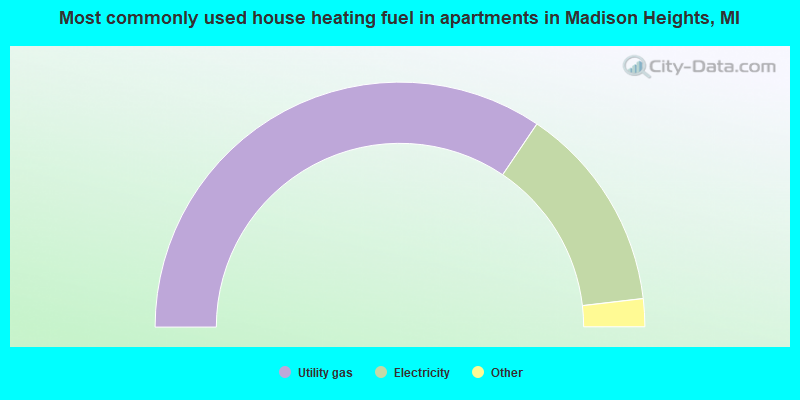
House heating fuel used in apartments - Utility gas (%)
House heating fuel used in apartments - Bottled, tank, or LP gas (%)
House heating fuel used in apartments - Electricity (%)
House heating fuel used in apartments - Fuel oil, kerosene, etc. (%)
House heating fuel used in apartments - Coal or coke (%)
House heating fuel used in apartments - Wood (%)
House heating fuel used in apartments - Solar energy (%)
House heating fuel used in apartments - Other fuel (%)
House heating fuel used in apartments - No fuel used (%)
Median year house/condo built: 1957Median year apartment built: 1970Household type by relationship:
Households: 28,457
Male householders: 6,453 (2,609 living alone ), Female householders: 6,975 (2,949 living alone )4,587 spouses (4,548 opposite-sex spouses ), 1,486 unmarried partners , (1,417 opposite-sex unmarried partners ), 5,777 children (5,634 natural , 57 adopted , 84 stepchildren ), 613 grandchildren , 562 brothers or sisters , 329 parents , 0 foster children , 609 other relatives , 923 non-relatives In group quarters: 137
Size of family households: 3,078 2-persons , 1,461 3-persons , 1,024 4-persons , 486 5-persons , 188 6-persons , 70 7-or-more-persons .
Size of nonfamily households: 5,848 1-person , 1,441 2-persons , 91 3-persons , 73 4-persons .
2,405 married couples with children. single-parent households (271 men , 957 women ).
85.0% of residents of Madison Heights speak English at home. of residents speak Spanish at home (66% speak English very well , 7% speak English well , 27% speak English not well , 1% don't speak English at all ).of residents speak other Indo-European language at home (70% speak English very well , 14% speak English well , 15% speak English not well ).of residents speak Asian or Pacific Island language at home (51% speak English very well , 35% speak English well , 5% speak English not well , 9% don't speak English at all ).of residents speak other language at home (35% speak English very well , 21% speak English well , 32% speak English not well , 12% don't speak English at all ).
Foreign born population: 3,705 (13.0%)of them are naturalized citizens )
Median number of rooms in houses and condos:
Median number of rooms in apartments
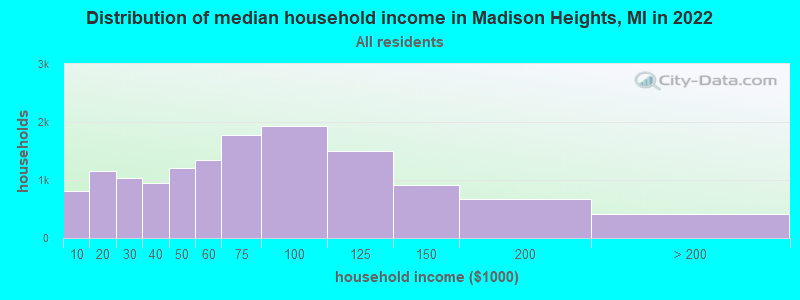
Madison Heights, MI household income distribution 807 Less than $10,0001,154 $10,000 to $19,9991,040 $20,000 to $29,999949 $30,000 to $39,9991,200 $40,000 to $49,9991,349 $50,000 to $59,9991,772 $60,000 to $74,9991,923 $75,000 to $99,9991,499 $100,000 to $124,999911 $125,000 to $149,999681 $150,000 to $199,999416 $200,000 or more
Home value of owner - occupied houses in 2022 in Madison Heights, MI 130 Less than $10,00020 $10,000 to $14,99925 $15,000 to $19,99925 $20,000 to $24,99917 $25,000 to $29,99916 $30,000 to $34,99915 $35,000 to $39,999100 $50,000 to $59,999177 $60,000 to $69,99944 $70,000 to $79,99960 $80,000 to $89,999108 $90,000 to $99,9991,051 $100,000 to $124,999693 $125,000 to $149,9991,370 $150,000 to $174,999843 $175,000 to $199,9991,825 $200,000 to $249,999538 $250,000 to $299,99992 $300,000 to $399,99934 $400,000 to $499,99959 $500,000 to $749,99914 $750,000 to $999,99924 $1,000,000 to $1,499,99914 $2,000,000 or moreRent paid by renters in 2022 in Madison Heights, MI 61 Less than $10039 $100 to $14921 $150 to $199216 $200 to $249106 $250 to $29978 $300 to $34918 $350 to $39972 $400 to $44929 $450 to $49959 $550 to $59983 $600 to $649100 $650 to $699153 $700 to $749135 $750 to $799511 $800 to $899632 $900 to $9991,488 $1,000 to $1,249573 $1,250 to $1,499325 $1,500 to $1,99910 $2,000 to $2,499128 No cash rent
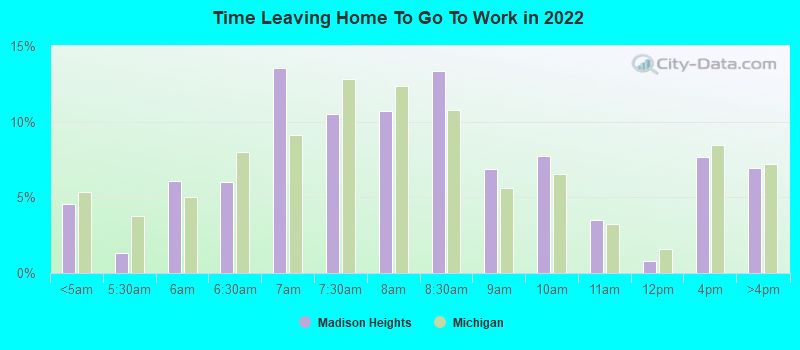
Percentage of workers working in this county: 72.9%Number of people working at home: 2,762 (17.5% of all workers )
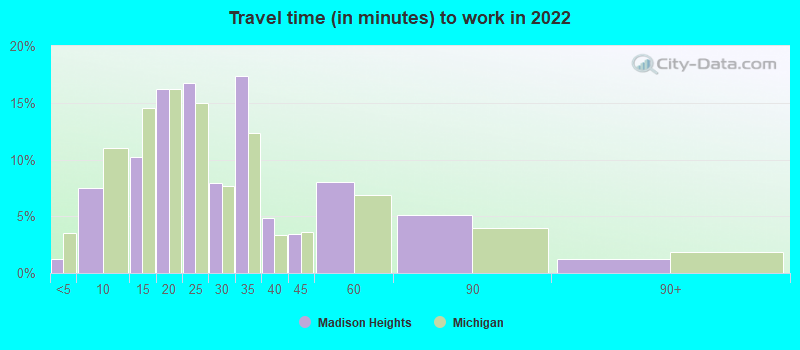
Travel time to work (commute)
Less than 5 minutes: 1405 to 9 minutes: 92810 to 14 minutes: 1,70315 to 19 minutes: 2,66420 to 24 minutes: 2,28725 to 29 minutes: 88230 to 34 minutes: 2,38035 to 39 minutes: 48240 to 44 minutes: 34945 to 59 minutes: 67160 to 89 minutes: 22490 or more minutes: 184
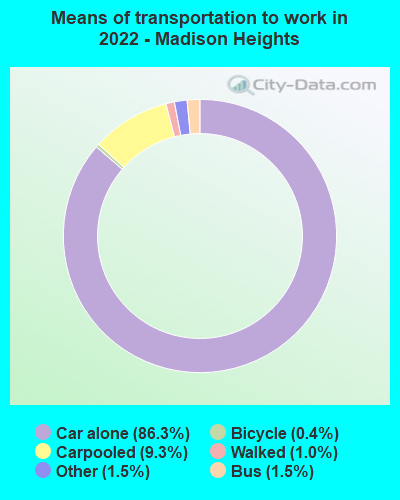
Means of transportation to work:
Drove a car alone: 15,445 (73.2%)Carpooled: 1,609 (7.6%)Bus : 159 (0.8%)Light rail, streetcar or trolley : 4 (0.0%)Taxi: 344 (1.6%)Bicycle: 105 (0.5%)Walked: 211 (1.0%)Worked at home: 2,762 (13.1%)
Unemployment by race in 2022
Unemployment rate for White non-Hispanic residents 2.1% Males1.7% FemalesUnemployment rate for Black residents 11.4% Males4.2% FemalesUnemployment rate for American Indian and Alaska Native residents 38.8% FemalesUnemployment rate for Asian residents 0.9% MalesUnemployment rate for other race residents 14.3% FemalesUnemployment rate for two or more race residents 3.0% MalesUnemployment rate for Hispanic or Latino residents 16.0% Females
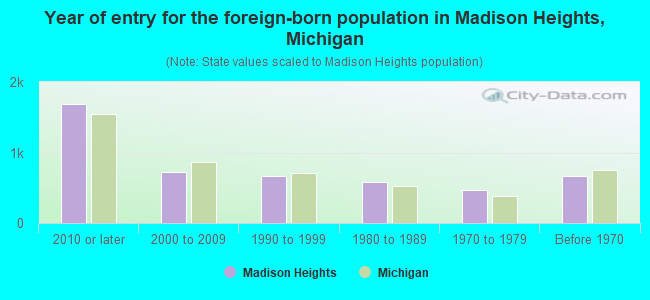
Year of entry for the foreign-born population in Madison Heights, Michigan
1,688 2010 or later 723 2000 to 2009 670 1990 to 1999 585 1980 to 1989 463 1970 to 1979 662 Before 1970
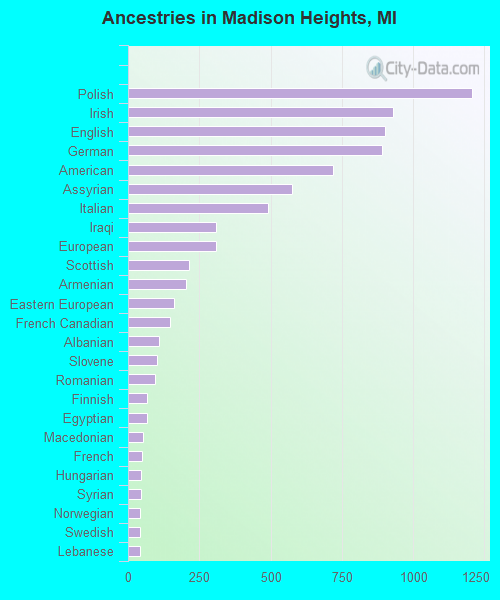
First ancestries reported:
Polish: 1,206 (9.9%)
Irish: 929 (7.6%)
English: 901 (7.4%)
German: 892 (7.3%)
American: 719 (5.9%)
Assyrian: 574 (4.7%)
Italian: 491 (4.0%)
Iraqi: 310 (2.5%)
European: 307 (2.5%)
Scottish: 213 (1.7%)
Armenian: 205 (1.7%)
Eastern European: 161 (1.3%)
French Canadian: 148 (1.2%)
Albanian: 110 (0.9%)
Slovene: 101 (0.8%)
Romanian: 93 (0.8%)
Finnish: 67 (0.5%)
Egyptian: 65 (0.5%)
Macedonian: 51 (0.4%)
French: 48 (0.4%)
Hungarian: 47 (0.4%)
Syrian: 47 (0.4%)
Norwegian: 43 (0.4%)
Swedish: 43 (0.4%)
Lebanese: 42 (0.3%)
Scotch-Irish: 37 (0.3%)
British: 30 (0.2%)
Russian: 29 (0.2%)
Canadian: 28 (0.2%)
Arab: 25 (0.2%)
African: 25 (0.2%)
Dutch: 22 (0.2%)
Ukrainian: 21 (0.2%)
Greek: 19 (0.2%)
Yugoslavian: 16 (0.1%)
Cajun: 15 (0.1%)
Scandinavian: 15 (0.1%)
Danish: 8 (0.07%)
Belgian: 8 (0.07%) Most common places of birth for foreign-born residents (%): Iraq Madison Heights:
29.1% (1,072)Michigan:
8.1% (55,954)
China, excluding Hong Kong and Taiwan Madison Heights:
14.0% (515)Michigan:
4.9% (34,295)
Canada Madison Heights:
6.5% (238)Michigan:
5.0% (35,052)
Philippines Madison Heights:
6.2% (230)Michigan:
2.8% (19,112)
Mexico Madison Heights:
4.7% (173)Michigan:
10.9% (75,965)
Armenia Madison Heights:
4.2% (154)Michigan:
0.1% (517)
Korea Madison Heights:
4.2% (153)Michigan:
3.0% (20,884)
Vietnam Madison Heights:
3.0% (112)Michigan:
1.8% (12,679)
Bosnia and Herzegovina Madison Heights:
3.0% (110)Michigan:
0.9% (6,009)
Romania Madison Heights:
2.9% (105)Michigan:
1.2% (8,563)
India Madison Heights:
2.3% (86)Michigan:
11.1% (77,240)
Albania Madison Heights:
1.9% (69)Michigan:
1.9% (12,910)
Lebanon Madison Heights:
1.7% (61)Michigan:
3.7% (25,634)
Place of birth for U.S.-born residents:
This state: 20,362Other state: 3,995Northeast: 781Midwest: 1,197South: 1,661West: 355 86.9% of Madison Heights residents lived in the same house 1 years ago.
Out of people who lived in different houses, 42.1% lived in this county.
Out of people who lived in different counties, 82.1% lived in Michigan.
Madison Heights:
86.9%State average:
88.4%
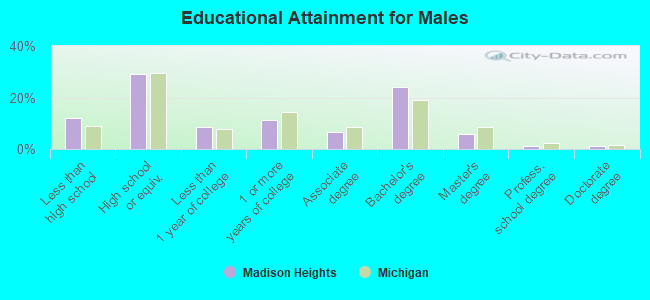
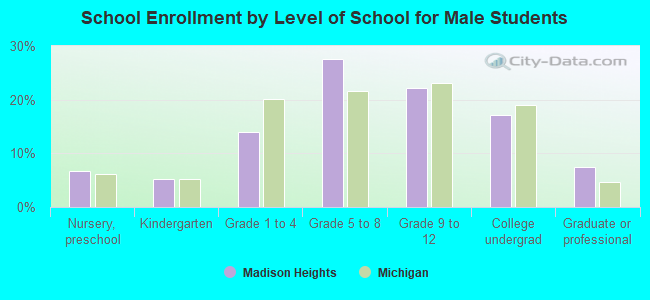
Education attainment for males 25 years and older:
No schooling: 282Nursery to 4th grade: 05th and 6th grade: 1507th and 8th grade: 1379th grade: 6510th grade: 25211th grade: 16012th grade, no diploma: 238High school graduate (or equivalency): 3,136Less than 1 year of college: 920Some college more than 1 year, no degree: 1,204Associate degree: 706Bachelor's degree: 2,608Master's degree: 632Professional school degree: 139Doctorate degree: 122
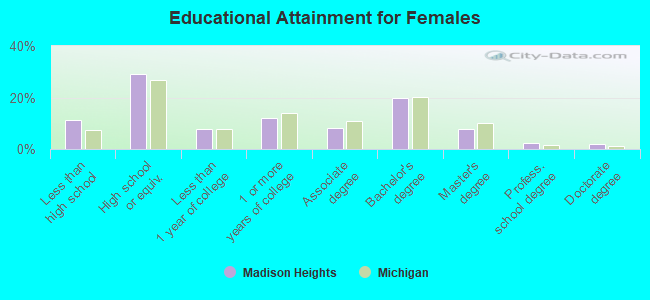
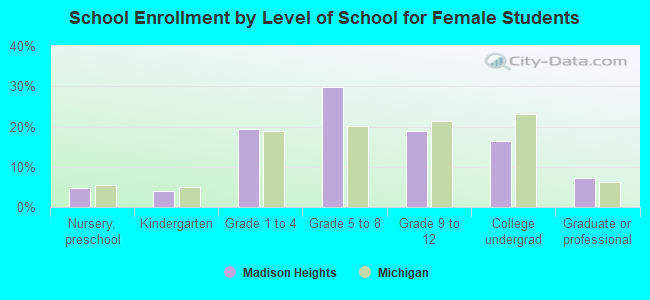
Education attainment for females 25 years and older:
No schooling: 239Nursery to 4th grade: 225th and 6th grade: 927th and 8th grade: 1669th grade: 2410th grade: 7911th grade: 9512th grade, no diploma: 521High school graduate (or equivalency): 3,173Less than 1 year of college: 870Some college more than 1 year, no degree: 1,304Associate degree: 910Bachelor's degree: 2,175Master's degree: 855Professional school degree: 239Doctorate degree: 193
Housing units in structures:
One, detached: 9,936One, attached: 241Two: 453 or 4: 4605 to 9: 1,44610 to 19: 47120 to 49: 37350 or more: 977Mobile homes: 481Housing units lacking complete plumbing facilities in 2022: 1.0%Housing units lacking complete kitchen facilities in 2022: 0.9%House/condo owner moved in on average 13 years ago
Renter moved in on average 2 years ago
Private vs. public school enrollment:
Students in private schools in grades 1 to 8 (elementary and middle school): 118 Students in private schools in grades 9 to 12 (high school): 92 Students in private undergraduate colleges: 95