Housing density: 1,736 houses/condos per square mile
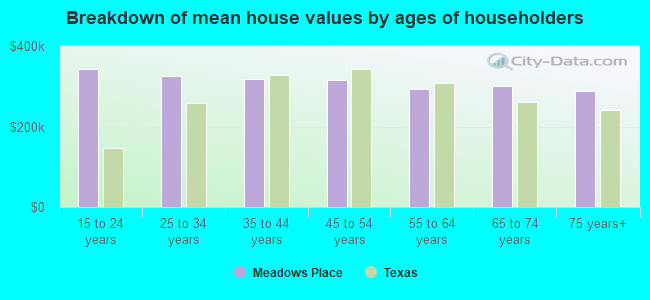
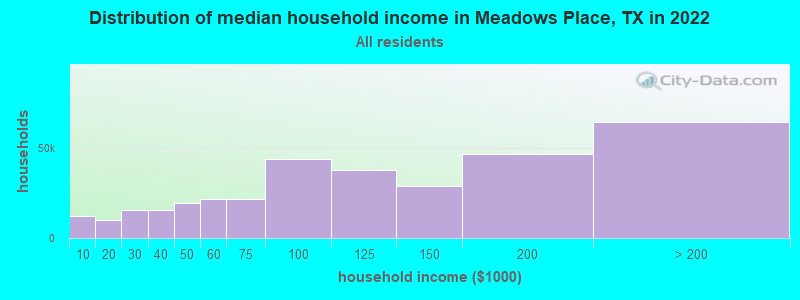
Median price asked for vacant for-sale houses and condos in 2022 in this county: $301,799.
Median contract rent in 2022: over $2,000 (lower quartile is $1,773, upper quartile is over $2,000)
Median rent asked for vacant for-rent units in 2022: $2,047
Median gross rent in Meadows Place, TX in 2022: over $2,000
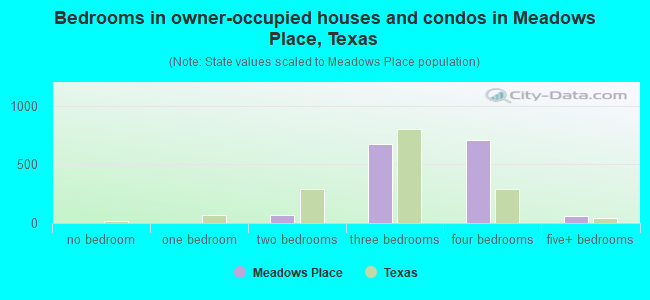
Housing units in Meadows Place with a mortgage: 1,253 (72 second mortgage, 103 home equity loan, 0 both second mortgage and home equity loan) Houses without a mortgage: 205
Compare current foreclosures near Meadows Place, TX:
In family households: 538,559 (112,399 male householders, 41,366 female householders)
121,600 spouses, 208,409 children (195,534 natural, 4,175 adopted, 8,700 stepchildren), 13,024 grandchildren, 7,016 brothers or sisters, 8,744 parents, foster children, 10,677 other relatives, 9,109 non-relatives
In nonfamily households: 40,880 (15,303 male householders (12,084 living alone)), 18,316 female householders (15,895 living alone)), 7,261 nonrelatives
In group quarters: 5,936 (5,604 institutionalized population)
86,593 married couples with children.
17,065 single-parent households (3,548 men, 13,517 women).
74.0% of residents of Meadows Place speak English at home.
8.9% of residents speak Spanish at home (77% speak English very well, 17% speak English well, 4% speak English not well, 2% don't speak English at all).
5.1% of residents speak other Indo-European language at home (81% speak English very well, 15% speak English well, 3% speak English not well).
11.5% of residents speak Asian or Pacific Island language at home (55% speak English very well, 26% speak English well, 14% speak English not well, 5% don't speak English at all).
0.5% of residents speak other language at home (25% speak English very well, 75% speak English well).
Foreign born population: 3,465 (28.0%)
(92.0% of them are naturalized citizens)
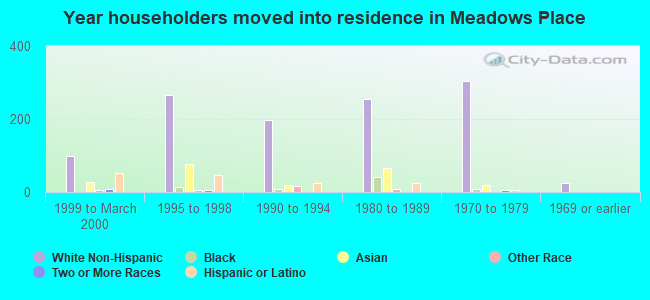
Year of entry for the foreign-born population in Meadows Place, Texas
611995 to March 2000
1261990 to 1994
1311985 to 1989
2121980 to 1984
1621975 to 1979
551970 to 1974
241965 to 1969
65Before 1965
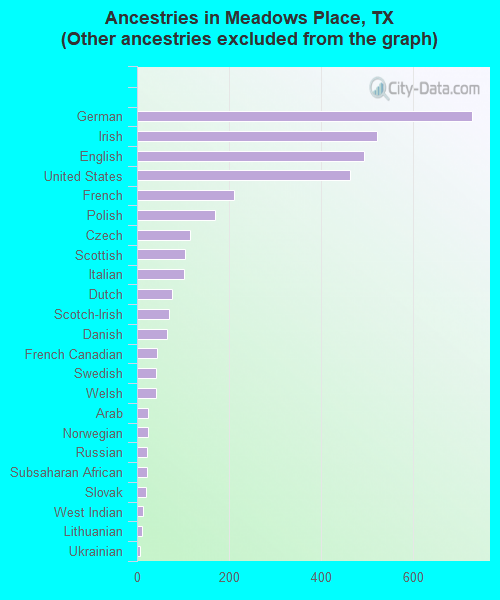
First ancestries reported:
Other: 1,941 (36.3%)
German: 730 (13.7%)
Irish: 522 (9.8%)
English: 494 (9.2%)
United States: 464 (8.7%)
French: 212 (4.0%)
Polish: 169 (3.2%)
Czech: 115 (2.2%)
Scottish: 105 (2.0%)
Italian: 103 (1.9%)
Dutch: 77 (1.4%)
Scotch-Irish: 70 (1.3%)
Danish: 66 (1.2%)
French Canadian: 44 (0.8%)
Swedish: 41 (0.8%)
Welsh: 41 (0.8%)
Arab: 24 (0.4%)
Norwegian: 24 (0.4%)
Russian: 22 (0.4%)
Subsaharan African: 21 (0.4%)
Slovak: 19 (0.4%)
West Indian: 14 (0.3%)
Lithuanian: 11 (0.2%)
Ukrainian: 7 (0.1%)
Swiss: 6 (0.1%)
Most common places of birth for foreign-born residents (%):
Vietnam
Meadows Place:
17.1% (143)
Texas:
3.7% (107,027)
Philippines
Meadows Place:
13.0% (109)
Texas:
1.6% (45,907)
India
Meadows Place:
9.9% (83)
Texas:
2.7% (78,388)
Hong Kong
Meadows Place:
8.0% (67)
Texas:
0.3% (7,815)
China, excluding Hong Kong and Taiwan
Meadows Place:
6.6% (55)
Texas:
1.3% (38,813)
Mexico
Meadows Place:
6.2% (52)
Texas:
64.8% (1,879,369)
Pakistan
Meadows Place:
6.0% (50)
Texas:
0.9% (26,981)
Russia
Meadows Place:
3.2% (27)
Texas:
0.2% (6,809)
Other Northern Africa
Meadows Place:
3.1% (26)
Texas:
0.1% (4,183)
Cuba
Meadows Place:
3.1% (26)
Texas:
0.6% (16,011)
Cambodia
Meadows Place:
2.9% (24)
Texas:
0.2% (6,793)
Germany
Meadows Place:
2.3% (19)
Texas:
1.4% (39,249)
El Salvador
Meadows Place:
2.3% (19)
Texas:
3.5% (101,259)
Iran
Meadows Place:
1.8% (15)
Texas:
0.5% (15,581)
Canada
Meadows Place:
1.8% (15)
Texas:
1.3% (36,802)
Other Caribbean
Meadows Place:
1.7% (14)
Texas:
0.2% (5,590)
Chile
Meadows Place:
1.7% (14)
Texas:
0.1% (3,880)
Taiwan
Meadows Place:
1.6% (13)
Texas:
0.8% (23,026)
Costa Rica
Meadows Place:
1.6% (13)
Texas:
0.1% (3,432)
Colombia
Meadows Place:
1.6% (13)
Texas:
0.8% (22,073)
Place of birth for U.S.-born residents:
This state: 2,573
Other state: 1,439
Northeast: 188
Midwest: 470
South: 567
West: 214
66% of Meadows Place residents lived in the same house 5 years ago. Out of people who lived in different houses, 36% lived in this county. Out of people who lived in different counties, 75% lived in Texas.
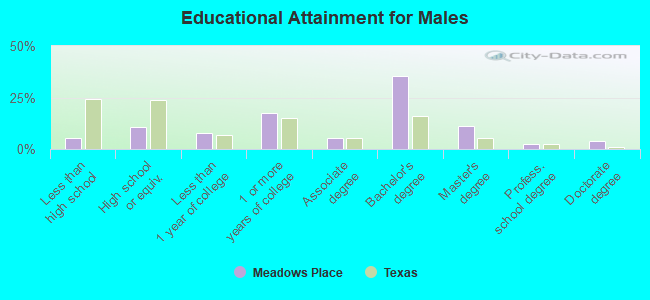
Education attainment for males 25 years and older:
No schooling: 25
Nursery to 4th grade: 5
5th and 6th grade: 8
7th and 8th grade: 0
9th grade: 12
10th grade: 14
11th grade: 6
12th grade, no diploma: 12
High school graduate (or equivalency): 165
Less than 1 year of college: 121
Some college more than 1 year, no degree: 267
Associate degree: 84
Bachelor's degree: 548
Master's degree: 175
Professional school degree: 34
Doctorate degree: 61
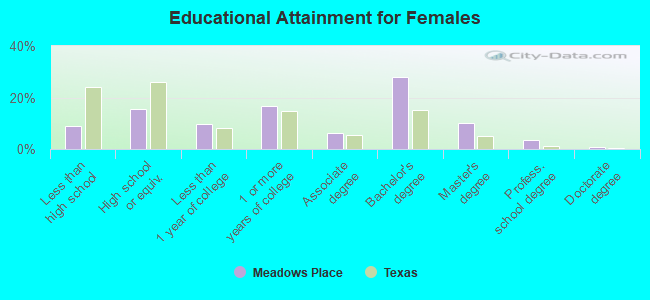
Education attainment for females 25 years and older:
No schooling: 12
Nursery to 4th grade: 0
5th and 6th grade: 11
7th and 8th grade: 16
9th grade: 25
10th grade: 38
11th grade: 15
12th grade, no diploma: 44
High school graduate (or equivalency): 280
Less than 1 year of college: 176
Some college more than 1 year, no degree: 302
Associate degree: 109
Bachelor's degree: 502
Master's degree: 182
Professional school degree: 65
Doctorate degree: 14
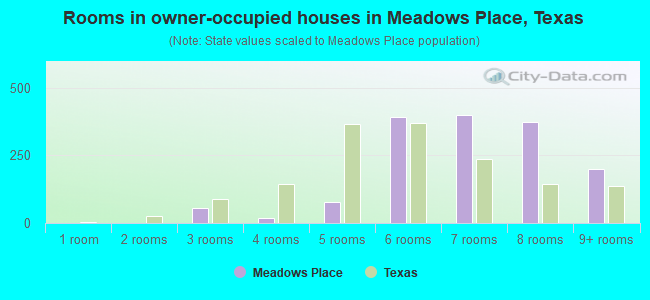
Housing units in structures:
One, detached: 1,625
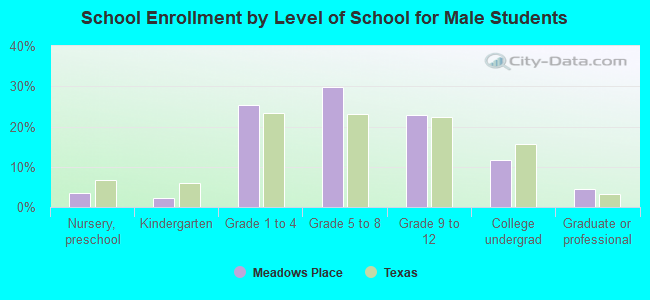
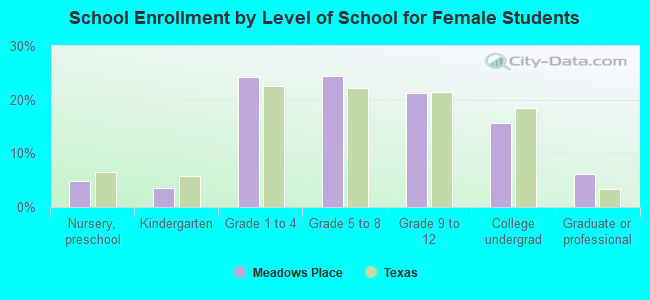
Private vs. public school enrollment:
Students in private schools in grades 1 to 8 (elementary and middle school): 112
Here:
14.8%
Texas:
6.8%
Students in private schools in grades 9 to 12 (high school): 35