Midlothian, TX (Texas) Houses and Residents
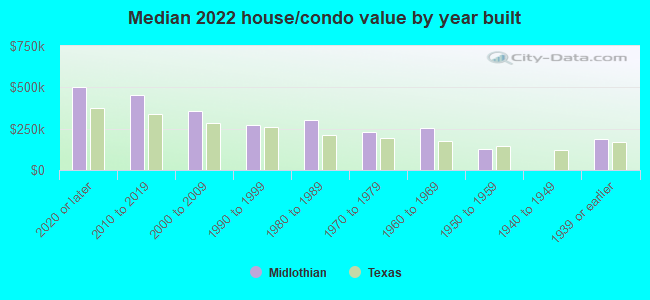
Estimated median house or condo value in 2022: $379,879 (it was $88,600 in 2000 )
Midlothian:
$379,879Texas:
$275,400
Lower value quartile - upper value quartile: $260,253 - $506,533Total population: 20,934 (Urban population: 6,251 (all inside urban clusters), Rural population: 1,381 (22 farm, 1,359 nonfarm ))
Houses: 13,313 (12,860 occupied: 10,829 owner occupied, 2,302 renter occupied )
% of renters here:
18%State:
38%
Housing density: 353 houses/condos per square mile
Median price asked for vacant for-sale houses and condos in 2022: $248,022.
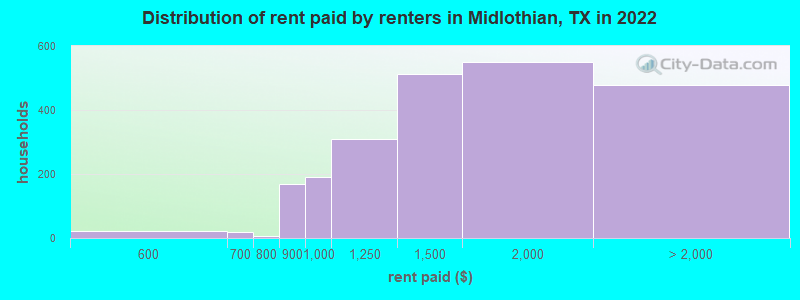
Median contract rent in 2022: $1,515 (lower quartile is $1,113, upper quartile is over $2,000)
Median rent asked for vacant for-rent units in 2022: $1,480
Median gross rent in Midlothian, TX in 2022: $1,620
Housing units in Midlothian with a mortgage: 8,156 (316 second mortgage, 0 home equity loan, 152 both second mortgage and home equity loan )Houses without a mortgage: 17
Median household income for houses/condos with a mortgage: $134,057
Median household income for apartments without a mortgage: $99,847
Median monthly housing costs: $1,965
Data:
Median house or condo value ($)
Median house or condo value ($ change since 2000)
Median house or condo value ($) - White
Median house or condo value ($) - Black or African American
Median house or condo value ($) - Asian
Median house or condo value ($) - Hispanic or Latino
Median house or condo value ($) - American Indian and Alaska Native
Median house or condo value ($) - Multirace
Median house or condo value ($) - Other Race
Median price asked for mobile homes ($)
Household density (households per square mile)
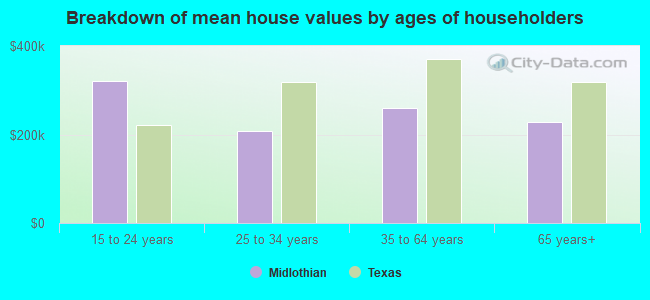
Mean house or condo value by units in structure - 1, detached ($)
Mean house or condo value by units in structure - 1, attached ($)
Mean house or condo value by units in structure - 2 ($)
Mean house or condo value by units in structure by units in structure - 3 or 4 ($)
Mean house or condo value by units in structure - 5 or more ($)
Mean house or condo value by units in structure - Boat, RV, van, etc. ($)
Mean house or condo value by units in structure - Mobile home ($)
Median contract rent ($)
Median contract rent - Lower quartile ($)
Median contract rent - Upper quartile ($)
Median gross rent ($)
Urban houses (%)
Rural houses (%)
Houses occupied (%)
Houses occupied (% change since 2000)
Houses owner occupied (%)
Houses owner occupied (% change since 2000)
Houses renter occupied (%)
Houses renter occupied (% change since 2000)
Vacant housing units - For rent (%)
Vacant housing units - For rent (% change since 2000)
Vacant housing units - For sale only (%)
Vacant housing units - For sale only (% change since 2000)
Vacant housing units - Rented or sold, not occupied (%)
Vacant housing units - Rented or sold, not occupied (% change since 2000)
Vacant housing units - For seasonal, recreational, or occasional use (%)
Vacant housing units - For seasonal, recreational, or occasional use (% change since 2000)
Vacant housing units - For migrant workers (%)
Vacant housing units - For migrant workers (% change since 2000)
Vacant housing units - Other vacant (%)
Vacant housing units - Other vacant (% change since 2000)
Median monthly housing costs ($)
Median household income for houses/condos with a mortgage ($)
Median household income for houses/condos without a mortgage ($)
Median household income ($)
Median household income ($) - White
Median household income ($) - Black or African American
Median household income ($) - Asian
Median household income ($) - Hispanic or Latino
Median household income ($) - American Indian and Alaska Native
Median household income ($) - Multirace
Median household income ($) - Other Race
Mortgage status - with mortgage (%)
Mortgage status - with second mortgage (%)
Mortgage status - with home equity loan (%)
Mortgage status - with both second mortgage and home equity loan (%)
Mortgage status - without a mortgage (%)
Median year house/condo built
Median year apartment built
Household type by relationship - Male householder living alone (%)
Household type by relationship - Male householder not living alone (%)
Household type by relationship - Female householder living alone (%)
Household type by relationship - Female householder not living alone (%)
Household type by relationship - Opposite-Sex spouse (%)
Household type by relationship - Same-Sex spouse (%)
Household type by relationship - Opposite-Sex unmarried partner (%)
Household type by relationship - Same-Sex unmarried partner (%)
Household type by relationship - In group quarters (%)
Size of family households - 2-person household (%)
Size of family households - 3-person household (%)
Size of family households - 4-person household (%)
Size of family households - 5-person household (%)
Size of family households - 6-person household (%)
Size of family households - 7-or-more-person household (%)
Size of nonfamily households - 1-person household (%)
Size of nonfamily households - 2-person household (%)
Size of nonfamily households - 3-person household (%)
Size of nonfamily households - 4-person household (%)
Size of nonfamily households - 5-person household (%)
Size of nonfamily households - 6-person household (%)
Size of nonfamily households - 7-or-moreperson household (%)
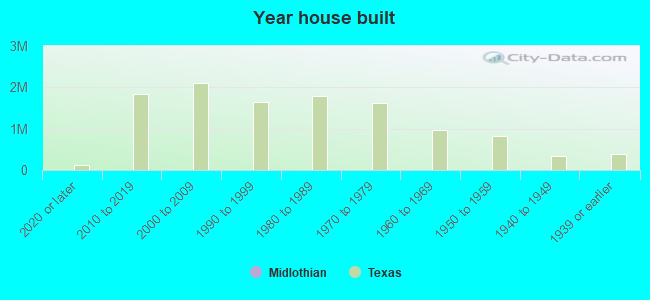
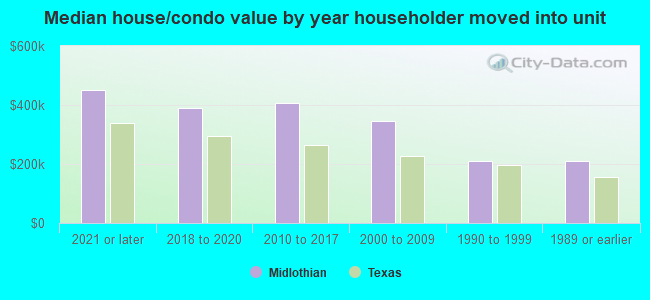
Year house built - Built 2010 or later (%)
Year house built - Built 2000 to 2009 (%)
Year house built - Built 1990 to 1999 (%)
Year house built - Built 1980 to 1989 (%)
Year house built - Built 1970 to 1979 (%)
Year house built - Built 1960 to 1969 (%)
Year house built - Built 1950 to 1959 (%)
Year house built - Built 1940 to 1949 (%)
Year house built - Built 1939 or earlier (%)
Median number of rooms in houses and condos
Median number of rooms in apartments
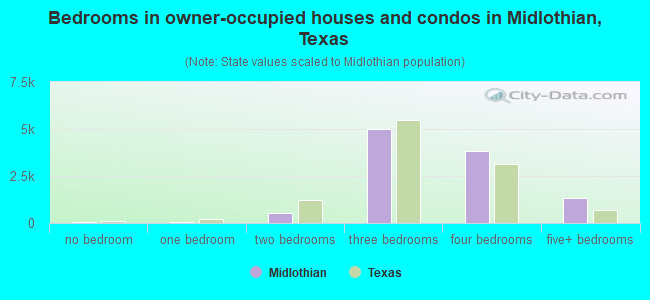
Median number of bedrooms in owner occupied houses
Mean number of bedrooms in owner occupied houses
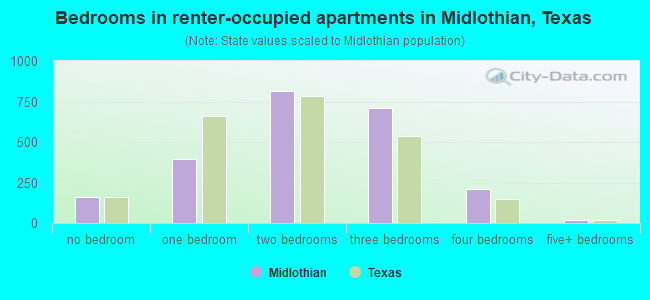
Median number of bedrooms in renter occupied houses
Mean number of bedrooms in renter occupied houses
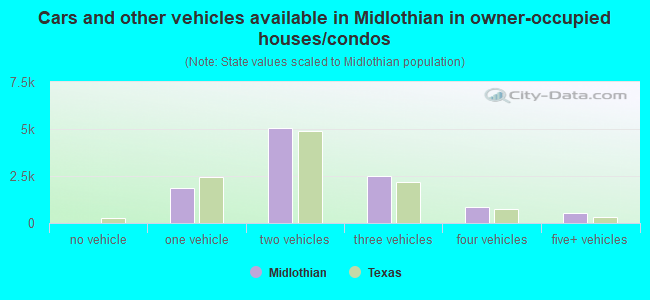
Median number of vehichles in owner occupied houses
Mean number of vehichles in owner occupied houses
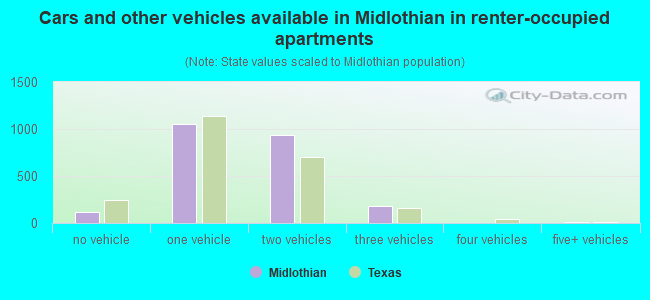
Median number of vehichles in renter occupied houses
Mean number of vehichles in renter occupied houses
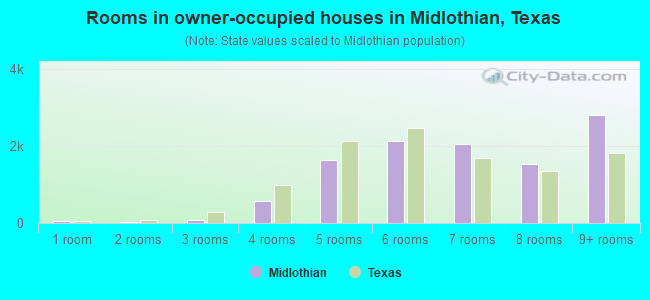
Rooms in owner-occupied houses - 1 room (%)
Rooms in owner-occupied houses - 2 rooms (%)
Rooms in owner-occupied houses - 3 rooms (%)
Rooms in owner-occupied houses - 4 rooms (%)
Rooms in owner-occupied houses - 5 rooms (%)
Rooms in owner-occupied houses - 6 rooms (%)
Rooms in owner-occupied houses - 7 rooms (%)
Rooms in owner-occupied houses - 8 rooms (%)
Rooms in owner-occupied houses - 9+ rooms (%)
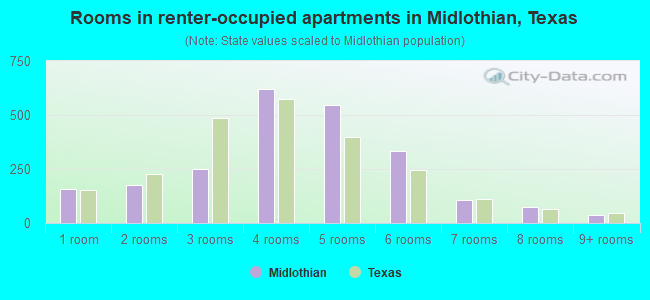
Rooms in renter-occupied houses - 1 room (%)
Rooms in renter-occupied houses - 2 rooms (%)
Rooms in renter-occupied houses - 3 rooms (%)
Rooms in renter-occupied houses - 4 rooms (%)
Rooms in renter-occupied houses - 5 rooms (%)
Rooms in renter-occupied houses - 6 rooms (%)
Rooms in renter-occupied houses - 7 rooms (%)
Rooms in renter-occupied houses - 8 rooms (%)
Rooms in renter-occupied houses - 9+ rooms (%)
Bedrooms in owner-occupied houses - no bedrooms (%)
Bedrooms in owner-occupied houses - 1 bedroom (%)
Bedrooms in owner-occupied houses - 2 bedrooms (%)
Bedrooms in owner-occupied houses - 3 bedrooms (%)
Bedrooms in owner-occupied houses - 4 bedrooms (%)
Bedrooms in owner-occupied houses - 5+ bedrooms (%)
Bedrooms in renter-occupied houses - no bedrooms (%)
Bedrooms in renter-occupied houses - 1 bedroom (%)
Bedrooms in renter-occupied houses - 2 bedrooms (%)
Bedrooms in renter-occupied houses - 3 bedrooms (%)
Bedrooms in renter-occupied houses - 4 bedrooms (%)
Bedrooms in renter-occupied houses - 5+ bedrooms (%)
Vehicles available in owner-occupied houses - no vehicle available (%)
Vehicles available in owner-occupied houses - 1 vehicle available(%)
Vehicles available in owner-occupied houses - 2 Vehicles available (%)
Vehicles available in owner-occupied houses - 3 Vehicles available (%)
Vehicles available in owner-occupied houses - 4 Vehicles available (%)
Vehicles available in owner-occupied houses - 5+ Vehicles available (%)
Vehicles available in renter-occupied houses - no vehicle available (%)
Vehicles available in renter-occupied houses - 1 vehicle available (%)
Vehicles available in renter-occupied houses - 2 Vehicles available (%)
Vehicles available in renter-occupied houses - 3 Vehicles available (%)
Vehicles available in renter-occupied houses - 4 Vehicles available (%)
Vehicles available in renter-occupied houses - 5+ Vehicles available (%)
Housing units in structures - 1, detached (%)
Housing units in structures - 1, attached (%)
Housing units in structures - 2 (%)
Housing units in structures - 3 or 4 (%)
Housing units in structures - 5 to 9 (%)
Housing units in structures - 10 to 19 (%)
Housing units in structures - 20 to 49 (%)
Housing units in structures - 50 or more (%)
Housing units in structures - Mobile home (%)
Housing units in structures - Boat, RV, van, etc. (%)
Housing units in structures - Owners - 1, detached (%)
Housing units in structures - Owners - 1, attached (%)
Housing units in structures - Owners - 2 (%)
Housing units in structures - Owners - 3 or 4 (%)
Housing units in structures - Owners - 5 to 9 (%)
Housing units in structures - Owners - 10 to 19 (%)
Housing units in structures - Owners - 20 to 49 (%)
Housing units in structures - Owners - 50 or more (%)
Housing units in structures - Owners - Mobile home (%)
Housing units in structures - Owners - Boat, RV, van, etc. (%)
Housing units in structures - Renters - 1, detached (%)
Housing units in structures - Renters - 1, attached (%)
Housing units in structures - Renters - 2 (%)
Housing units in structures - Renters - 3 or 4 (%)
Housing units in structures - Renters - 5 to 9 (%)
Housing units in structures - Renters - 10 to 19 (%)
Housing units in structures - Renters - 20 to 49 (%)
Housing units in structures - Renters - 50 or more (%)
Housing units in structures - Renters - Mobile home (%)
Housing units in structures - Renters - Boat, RV, van, etc. (%)
House/condo owner moved in on average (years ago)
Renter moved in on average (years ago)
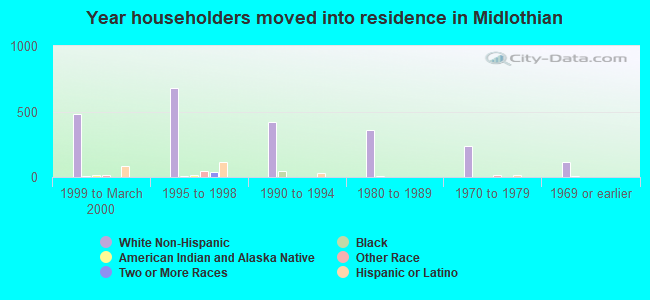
Year householder moved into unit - Moved in 1999 to March 2000 (%)
Year householder moved into unit - Moved in 1999 to March 2000 (%) - White
Year householder moved into unit - Moved in 1999 to March 2000 (%) - Black or African American
Year householder moved into unit - Moved in 1999 to March 2000 (%) - Asian
Year householder moved into unit - Moved in 1999 to March 2000 (%) - Hispanic or Latino
Year householder moved into unit - Moved in 1999 to March 2000 (%) - American Indian and Alaska Native
Year householder moved into unit - Moved in 1999 to March 2000 (%) - Multirace
Year householder moved into unit - Moved in 1999 to March 2000 (%) - Other Race
Year householder moved into unit - Moved in 1995 to 1998 (%)
Year householder moved into unit - Moved in 1995 to 1998 (%) - White
Year householder moved into unit - Moved in 1995 to 1998 (%) - Black or African American
Year householder moved into unit - Moved in 1995 to 1998 (%) - Asian
Year householder moved into unit - Moved in 1995 to 1998 (%) - Hispanic or Latino
Year householder moved into unit - Moved in 1995 to 1998 (%) - American Indian and Alaska Native
Year householder moved into unit - Moved in 1995 to 1998 (%) - Multirace
Year householder moved into unit - Moved in 1995 to 1998 (%) - Other Race
Year householder moved into unit - Moved in 1990 to 1994 (%)
Year householder moved into unit - Moved in 1990 to 1994 (%) - White
Year householder moved into unit - Moved in 1990 to 1994 (%) - Black or African American
Year householder moved into unit - Moved in 1990 to 1994 (%) - Asian
Year householder moved into unit - Moved in 1990 to 1994 (%) - Hispanic or Latino
Year householder moved into unit - Moved in 1990 to 1994 (%) - American Indian and Alaska Native
Year householder moved into unit - Moved in 1990 to 1994 (%) - Multirace
Year householder moved into unit - Moved in 1990 to 1994 (%) - Other Race
Year householder moved into unit - Moved in 1980 to 1989 (%)
Year householder moved into unit - Moved in 1980 to 1989 (%) - White
Year householder moved into unit - Moved in 1980 to 1989 (%) - Black or African American
Year householder moved into unit - Moved in 1980 to 1989 (%) - Asian
Year householder moved into unit - Moved in 1980 to 1989 (%) - Hispanic or Latino
Year householder moved into unit - Moved in 1980 to 1989 (%) - American Indian and Alaska Native
Year householder moved into unit - Moved in 1980 to 1989 (%) - Multirace
Year householder moved into unit - Moved in 1980 to 1989 (%) - Other Race
Year householder moved into unit - Moved in 1970 to 1979 (%)
Year householder moved into unit - Moved in 1970 to 1979 (%) - White
Year householder moved into unit - Moved in 1970 to 1979 (%) - Black or African American
Year householder moved into unit - Moved in 1970 to 1979 (%) - Asian
Year householder moved into unit - Moved in 1970 to 1979 (%) - Hispanic or Latino
Year householder moved into unit - Moved in 1970 to 1979 (%) - American Indian and Alaska Native
Year householder moved into unit - Moved in 1970 to 1979 (%) - Multirace
Year householder moved into unit - Moved in 1970 to 1979 (%) - Other Race
Year householder moved into unit - Moved in 1969 or earlier (%)
Year householder moved into unit - Moved in 1969 or earlier (%) - White
Year householder moved into unit - Moved in 1969 or earlier (%) - Black or African American
Year householder moved into unit - Moved in 1969 or earlier (%) - Asian
Year householder moved into unit - Moved in 1969 or earlier (%) - Hispanic or Latino
Year householder moved into unit - Moved in 1969 or earlier (%) - American Indian and Alaska Native
Year householder moved into unit - Moved in 1969 or earlier (%) - Multirace
Year householder moved into unit - Moved in 1969 or earlier (%) - Other Race
Housing units lacking complete plumbing facilities (%)
Housing units lacking complete kitchen facilities (%)
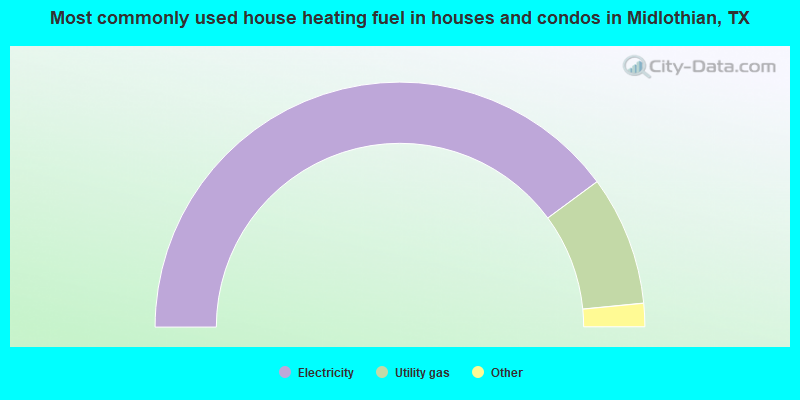
House heating fuel used in houses and condos - Utility gas (%)
House heating fuel used in houses and condos - Bottled, tank, or LP gas (%)
House heating fuel used in houses and condos - Electricity (%)
House heating fuel used in houses and condos - Fuel oil, kerosene, etc. (%)
House heating fuel used in houses and condos - Coal or coke (%)
House heating fuel used in houses and condos - Wood (%)
House heating fuel used in houses and condos - Solar energy (%)
House heating fuel used in houses and condos - Other fuel (%)
House heating fuel used in houses and condos - No fuel used (%)
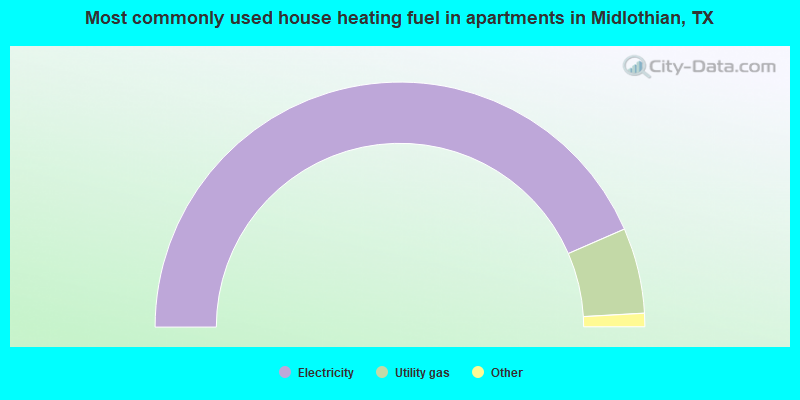
House heating fuel used in apartments - Utility gas (%)
House heating fuel used in apartments - Bottled, tank, or LP gas (%)
House heating fuel used in apartments - Electricity (%)
House heating fuel used in apartments - Fuel oil, kerosene, etc. (%)
House heating fuel used in apartments - Coal or coke (%)
House heating fuel used in apartments - Wood (%)
House heating fuel used in apartments - Solar energy (%)
House heating fuel used in apartments - Other fuel (%)
House heating fuel used in apartments - No fuel used (%)
Latest news about housing in Midlothian, TX collected exclusively by city-data.com from local newspapers, TV, and radio stations
Median year house/condo built: 2008Median year apartment built: 2013Household type by relationship:
Households: 38,484
Male householders: 6,313 (506 living alone ), Female householders: 6,470 (1,023 living alone )8,256 spouses (8,251 opposite-sex spouses ), 843 unmarried partners , (744 opposite-sex unmarried partners ), 13,643 children (12,294 natural , 682 adopted , 666 stepchildren ), 671 grandchildren , 223 brothers or sisters , 587 parents , 9 foster children , 703 other relatives , 724 non-relatives In group quarters: 36
Size of family households: 4,496 2-persons , 2,099 3-persons , 3,194 4-persons , 961 5-persons , 386 6-persons , 118 7-or-more-persons .
Size of nonfamily households: 1,413 1-person , 664 2-persons .
7,367 married couples with children. single-parent households (537 men , 1,976 women ).
90.0% of residents of Midlothian speak English at home. of residents speak Spanish at home (73% speak English very well , 14% speak English well , 12% speak English not well , 1% don't speak English at all ).of residents speak other Indo-European language at home (78% speak English very well , 18% speak English well , 4% speak English not well ).of residents speak Asian or Pacific Island language at home (73% speak English very well , 27% speak English well ).of residents speak other language at home (80% speak English very well , 20% speak English not well ).
Foreign born population: 1,983 (5.2%)of them are naturalized citizens )
Median number of rooms in houses and condos:
Median number of rooms in apartments
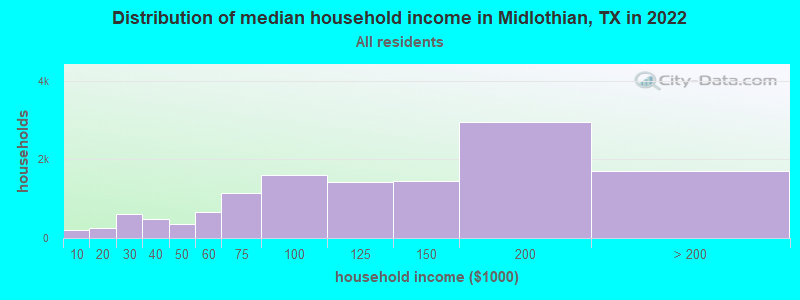
Midlothian, TX household income distribution 208 Less than $10,000266 $10,000 to $19,999599 $20,000 to $29,999490 $30,000 to $39,999355 $40,000 to $49,999656 $50,000 to $59,9991,151 $60,000 to $74,9991,613 $75,000 to $99,9991,424 $100,000 to $124,9991,439 $125,000 to $149,9992,954 $150,000 to $199,9991,703 $200,000 or more
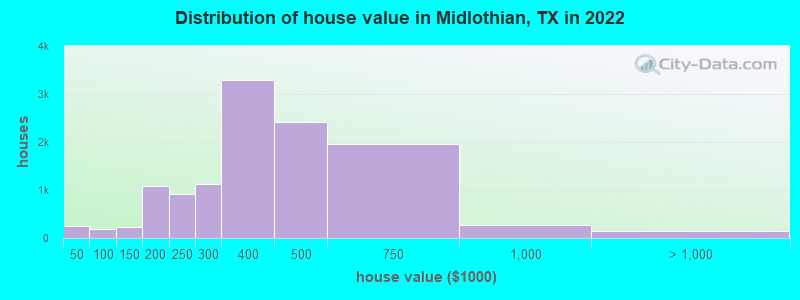
Home value of owner - occupied houses in 2022 in Midlothian, TX 92 Less than $10,00060 $15,000 to $19,99923 $20,000 to $24,99912 $30,000 to $34,99912 $35,000 to $39,99944 $40,000 to $49,99921 $50,000 to $59,9998 $60,000 to $69,99934 $70,000 to $79,99950 $80,000 to $89,99933 $90,000 to $99,999114 $100,000 to $124,999113 $125,000 to $149,999333 $150,000 to $174,999740 $175,000 to $199,999921 $200,000 to $249,9991,133 $250,000 to $299,9993,286 $300,000 to $399,9992,410 $400,000 to $499,9991,961 $500,000 to $749,999273 $750,000 to $999,99986 $1,000,000 to $1,499,99954 $2,000,000 or moreRent paid by renters in 2022 in Midlothian, TX 4 $250 to $29915 $500 to $5497 $550 to $59918 $650 to $6996 $700 to $749167 $800 to $899192 $900 to $999307 $1,000 to $1,249513 $1,250 to $1,499548 $1,500 to $1,999350 $2,000 to $2,49933 $2,500 to $2,99994 No cash rent
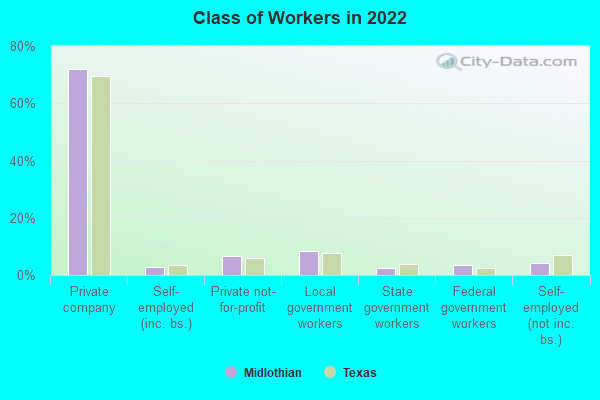
Percentage of workers working in this county: 47.5%Number of people working at home: 3,160 (16.5% of all workers )
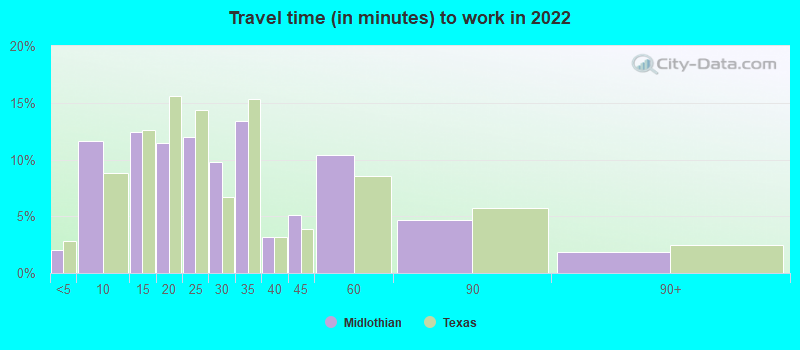
Travel time to work (commute)
Less than 5 minutes: 2615 to 9 minutes: 1,40410 to 14 minutes: 1,12315 to 19 minutes: 1,69720 to 24 minutes: 1,99525 to 29 minutes: 1,63230 to 34 minutes: 2,50235 to 39 minutes: 1,36540 to 44 minutes: 1,03245 to 59 minutes: 2,29560 to 89 minutes: 1,67490 or more minutes: 184
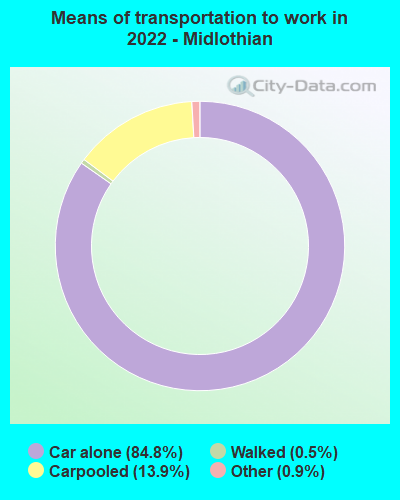
Means of transportation to work:
Drove a car alone: 10,869 (68.3%)Carpooled: 1,940 (12.2%)Taxi: 135 (0.8%)Walked: 65 (0.4%)Worked at home: 3,160 (19.8%)
Unemployment by race in 2022
Unemployment rate for White non-Hispanic residents 2.0% Males1.8% FemalesUnemployment rate for Black residents 2.6% Males10.1% FemalesUnemployment rate for two or more race residents 0.7% Males7.4% FemalesUnemployment rate for Hispanic or Latino residents 1.4% Males10.4% Females
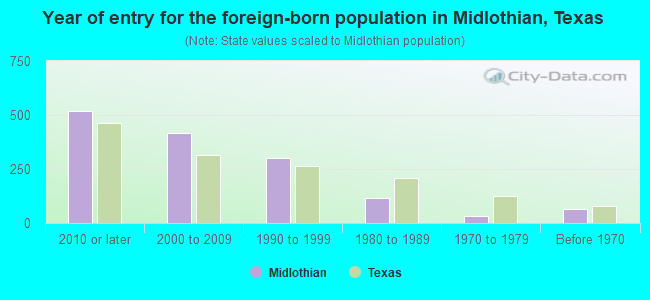
Year of entry for the foreign-born population in Midlothian, Texas
517 2010 or later 418 2000 to 2009 301 1990 to 1999 117 1980 to 1989 31 1970 to 1979 67 Before 1970
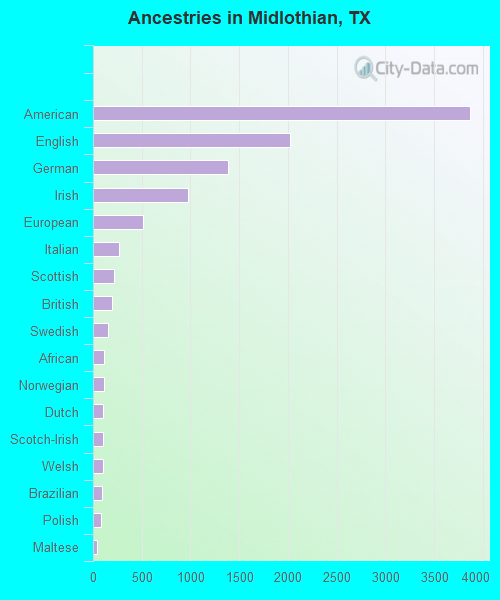
First ancestries reported:
American: 3,870 (21.3%)
English: 2,023 (11.1%)
German: 1,388 (7.6%)
Irish: 973 (5.4%)
European: 510 (2.8%)
Italian: 268 (1.5%)
Scottish: 219 (1.2%)
British: 195 (1.1%)
Swedish: 149 (0.8%)
African: 116 (0.6%)
Norwegian: 113 (0.6%)
Dutch: 103 (0.6%)
Scotch-Irish: 103 (0.6%)
Welsh: 101 (0.6%)
Brazilian: 93 (0.5%)
Polish: 86 (0.5%)
Maltese: 44 (0.2%)
French: 35 (0.2%)
Czech: 32 (0.2%)
Northern European: 30 (0.2%)
Australian: 24 (0.1%)
Ukrainian: 24 (0.1%)
Swiss: 20 (0.1%)
Iranian: 18 (0.10%)
Danish: 16 (0.09%)
Slovene: 16 (0.09%)
Russian: 13 (0.07%)
Slovak: 12 (0.07%)
Arab: 11 (0.06%)
Trinidadian and Tobagonian: 8 (0.04%)
Greek: 7 (0.04%)
Lebanese: 4 (0.02%)
Hungarian: 4 (0.02%) Most common places of birth for foreign-born residents (%): Mexico Midlothian:
50.2% (801)Texas:
48.4% (2,411,723)
Cameroon Midlothian:
13.2% (211)Texas:
0.3% (15,833)
England Midlothian:
4.9% (79)Texas:
0.4% (20,885)
Guatemala Midlothian:
4.9% (78)Texas:
1.8% (87,382)
El Salvador Midlothian:
3.7% (59)Texas:
4.5% (224,455)
Brazil Midlothian:
3.2% (51)Texas:
0.5% (24,723)
Canada Midlothian:
1.9% (31)Texas:
1.1% (55,371)
Honduras Midlothian:
1.9% (30)Texas:
3.0% (147,182)
Place of birth for U.S.-born residents:
This state: 25,047Other state: 10,901Northeast: 967Midwest: 3,164South: 3,802West: 2,966 89.0% of Midlothian residents lived in the same house 1 years ago.
Out of people who lived in different houses, 22.0% lived in this county.
Out of people who lived in different counties, 83.9% lived in Texas.
Midlothian:
89.0%State average:
85.7%
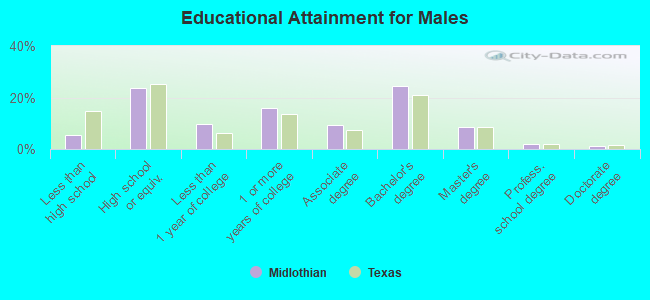
Education attainment for males 25 years and older:
No schooling: 85Nursery to 4th grade: 05th and 6th grade: 977th and 8th grade: 1149th grade: 1410th grade: 13511th grade: 4412th grade, no diploma: 113High school graduate (or equivalency): 2,630Less than 1 year of college: 1,075Some college more than 1 year, no degree: 1,777Associate degree: 1,023Bachelor's degree: 2,741Master's degree: 932Professional school degree: 220Doctorate degree: 143
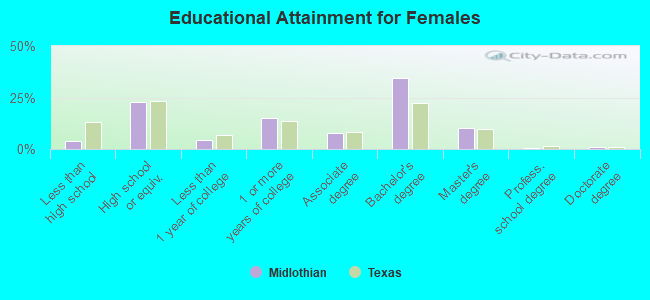
Education attainment for females 25 years and older:
No schooling: 135Nursery to 4th grade: 145th and 6th grade: 527th and 8th grade: 689th grade: 2410th grade: 10111th grade: 5212th grade, no diploma: 79High school graduate (or equivalency): 2,950Less than 1 year of college: 547Some college more than 1 year, no degree: 1,968Associate degree: 992Bachelor's degree: 4,427Master's degree: 1,283Professional school degree: 70Doctorate degree: 124
Housing units in structures:
One, detached: 11,436One, attached: 223Two: 1383 or 4: 895 to 9: 32810 to 19: 15720 to 49: 24650 or more: 348Mobile homes: 315Boats, RVs, vans, etc.: 28Median worth of mobile homes: $85,301
Housing units lacking complete plumbing facilities in 2022: 3.0%Housing units lacking complete kitchen facilities in 2022: 1.9%House/condo owner moved in on average 6 years ago
Renter moved in on average 1 years ago
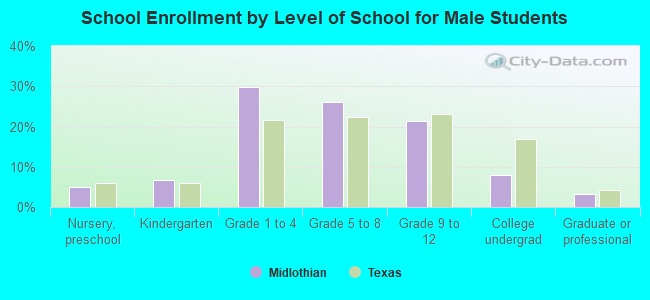
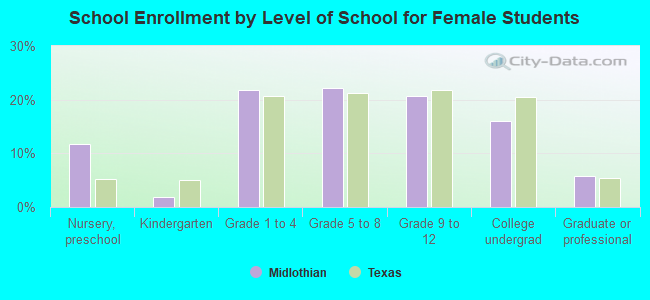
Private vs. public school enrollment:
Students in private schools in grades 1 to 8 (elementary and middle school): 372 Students in private schools in grades 9 to 12 (high school): 225 Students in private undergraduate colleges: 229