Newport, RI (Rhode Island) Houses and Residents
| Newport: | $763,508 |
| Rhode Island: | $383,900 |
Mean price in 2022:
Detached houses: $1,039,697
Here: $1,039,697 State: $445,354 Townhouses or other attached units: $1,078,279
Here: $1,078,279 State: $371,092 In 2-unit structures: $843,537
Here: $843,537 State: $317,098 In 3-to-4-unit structures: $459,570
Here: $459,570 State: $315,052 In 5-or-more-unit structures: $1,037,042
Here: $1,037,042 State: $291,252
Total population: 24,089 (All urban)
Houses: 13,684 (10,707 occupied: 5,244 owner occupied, 5,810 renter occupied)
| % of renters here: | 53% |
| State: | 37% |
Housing density: 1,724 houses/condos per square mile
Median price asked for vacant for-sale houses and condos in 2022: $1,121,975.
Median contract rent in 2022: $1,327 (lower quartile is $747, upper quartile is $1,804)
Median rent asked for vacant for-rent units in 2022: $1,107
Median gross rent in Newport, RI in 2022: $1,414
Housing units in Newport with a mortgage: 3,239 (414 second mortgage, 48 home equity loan, 351 both second mortgage and home equity loan)
Houses without a mortgage: 159
Median household income for houses/condos with a mortgage: $136,549
Median household income for apartments without a mortgage: $112,998
Median monthly housing costs: $1,546
Compare current foreclosures near Newport, RI:
| Photo | Address | Area | Beds / Baths | Price | Details |
|---|---|---|---|---|---|

|
#1
Narragansett Ave
Newport, RI 02840
|
- sq. feet
|
- baths - beds |
show details | |

|
#2
Chapel St Apt D
Newport, RI 02840
|
- sq. feet
|
- baths - beds |
show details | |

|
#3
Admiral Kalbfus Rd Apt 9d
Newport, RI 02840
|
- sq. feet
|
- baths - beds |
show details | |

|
#4
Ranger Rd
Newport, RI 02840
|
- sq. feet
|
- baths - beds |
show details | |

|
#5
Pequot Ave
Warwick, RI 02889
|
1,858 sq. feet
|
2 baths 3 beds |
$290,000
|
show details |

|
#6
Hallville Rd
Exeter, RI 02822
|
943 sq. feet
|
1 baths 2 beds |
$69,900
|
show details |

|
#7
Melville St
Fall River, MA 02724
|
2,733 sq. feet
|
3 baths 6 beds |
show details | |

|
#8
15th St # 5
Fall River, MA 02723
|
867 sq. feet
|
1 baths 3 beds |
show details | |

|
#9
Chace Ave
Warren, RI 02885
|
1,224 sq. feet
|
1 baths 2 beds |
show details | |

|
#10
Barrett St
Fall River, MA 02724
|
1,228 sq. feet
|
2 baths 3 beds |
show details |
| Photo | Address | Area | Beds / Baths | Price | Details |
|---|---|---|---|---|---|

|
#11
Duncan St
Fall River, MA 02721
|
1,326 sq. feet
|
2 baths 3 beds |
show details | |

|
#12
Pokross St
Fall River, MA 02724
|
960 sq. feet
|
1 baths 3 beds |
show details | |

|
#13
Bishop St
Fall River, MA 02721
|
2,316 sq. feet
|
2 baths 3 beds |
show details | |

|
#14
Boyds Ln
Portsmouth, RI 02871
|
1,144 sq. feet
|
1 baths 3 beds |
show details | |

|
#15
Walnut Glen Dr
Warwick, RI 02886
|
1,404 sq. feet
|
2 baths 3 beds |
show details | |

|
#16
Potomac Rd
Portsmouth, RI 02871
|
1,030 sq. feet
|
2 baths 3 beds |
show details | |

|
#17
W Bay Dr
Narragansett, RI 02882
|
1,861 sq. feet
|
3 baths 3 beds |
show details | |

|
#18
E Greenwich Ave
West Warwick, RI 02893
|
2,496 sq. feet
|
2 baths 4 beds |
show details | |

|
#19
Cove Ave
Warwick, RI 02889
|
1,314 sq. feet
|
1 baths 3 beds |
show details | |

|
#20
Jepson St
Fall River, MA 02723
|
2,586 sq. feet
|
1 baths 4 beds |
show details |
| Photo | Address | Area | Beds / Baths | Price | Details |
|---|---|---|---|---|---|

|
#21
Sefton Ave
Warwick, RI 02889
|
1,008 sq. feet
|
1 baths 3 beds |
show details | |

|
#22
Felucca Ave
Jamestown, RI 02835
|
1,050 sq. feet
|
1 baths 3 beds |
show details | |

|
#23
Detroit St
Fall River, MA 02721
|
2,132 sq. feet
|
2 baths 3 beds |
show details | |

|
#24
Hardwick St
Warwick, RI 02889
|
1,044 sq. feet
|
1 baths 3 beds |
show details | |

|
#25
Juniper Dr
West Warwick, RI 02893
|
1,956 sq. feet
|
1 baths 3 beds |
show details | |

|
#26
Stevens St
Fall River, MA 02721
|
1,602 sq. feet
|
1 baths 3 beds |
show details | |

|
#27
Slade St
Fall River, MA 02721
|
2,079 sq. feet
|
2 baths 3 beds |
show details | |

|
#28
Haswill St
Warwick, RI 02889
|
988 sq. feet
|
1 baths 3 beds |
show details | |

|
#29
E Shore Rd
Jamestown, RI 02835
|
1,535 sq. feet
|
2 baths 3 beds |
show details | |

|
#30
Rodman St
Fall River, MA 02721
|
1,709 sq. feet
|
1 baths 3 beds |
show details |
| Photo | Address | Area | Beds / Baths | Price | Details |
|---|---|---|---|---|---|

|
#31
Sachuest Way
Middletown, RI 02842
|
1,640 sq. feet
|
1 baths 4 beds |
show details | |

|
#32
Orswell St
Fall River, MA 02721
|
1,976 sq. feet
|
1 baths 4 beds |
show details | |

|
#33
Van Zandt Ave
Warwick, RI 02889
|
800 sq. feet
|
1 baths 4 beds |
show details | |

|
#34
Laurel St
Fall River, MA 02724
|
2,958 sq. feet
|
2 baths 2 beds |
show details | |

|
#35
Calef Ave
Swansea, MA 02777
|
2,016 sq. feet
|
2 baths 3 beds |
show details | |

|
#36
Church Ave
Warwick, RI 02889
|
1,008 sq. feet
|
1 baths 3 beds |
show details | |

|
#37
Michael Dr
Bristol, RI 02809
|
1,892 sq. feet
|
2 baths 4 beds |
show details | |

|
#38
Fisher Rd
North Dartmouth, MA 02747
|
906 sq. feet
|
1 baths 1 beds |
show details | |

|
#39
Calef Ave
Swansea, MA 02777
|
2,414 sq. feet
|
2 baths 5 beds |
show details | |

|
#40
Oak Hill Rd
Wakefield, RI 02879
|
2,100 sq. feet
|
2 baths 4 beds |
show details |
| Photo | Address | Area | Beds / Baths | Price | Details |
|---|---|---|---|---|---|

|
#41
Charles St
Fall River, MA 02724
|
2,412 sq. feet
|
2 baths 6 beds |
show details | |

|
#42
Pokross St
Fall River, MA 02724
|
1,482 sq. feet
|
2 baths 4 beds |
show details | |

|
#43
Darrow Dr
Warwick, RI 02886
|
1,666 sq. feet
|
2 baths 3 beds |
show details | |

|
#44
Stevens St
Fall River, MA 02721
|
2,153 sq. feet
|
2 baths 3 beds |
show details | |

|
#45
Calef Ave
Swansea, MA 02777
|
1,532 sq. feet
|
1 baths 3 beds |
show details | |

|
#46
Rodman St
Fall River, MA 02721
|
1,938 sq. feet
|
1 baths 3 beds |
show details | |

|
#47
Tecumseh St
Fall River, MA 02721
|
2,575 sq. feet
|
3 baths 9 beds |
show details | |

|
#48
Bay St # 2
Fall River, MA 02721
|
2,257 sq. feet
|
2 baths 3 beds |
show details | |

|
#49
Shore Dr Unit 611
Fall River, MA 02721
|
1,902 sq. feet
|
3 baths 3 beds |
show details | |

|
Check over 1 million property listings on Foreclosure.com!
|
browse all offers | |||

Latest news about housing in Newport, RI collected exclusively by city-data.com from local newspapers, TV, and radio stations

 | 2-month-old found dead in the Festival Field Housing Projects in Newport's North End (93 replies) |
| Newport's Ocean's Way Condos (50 replies) |
| Crazy Rhode Island real estate market (525 replies) |
| Rhode Island Housing Crisis? (51 replies) |
| RI Real Estate Continues to Rocket While Growing Concerns About Global Housing Bubble Emerge (4 replies) |
| Proposed out of regulation Newport house (42 replies) |

Median year apartment built: 1933
Household type by relationship:
Households: 24,804- Male householders: 4,887 (1,812 living alone), Female householders: 5,637 (2,385 living alone)
3,473 spouses (3,442 opposite-sex spouses), 704 unmarried partners, (662 opposite-sex unmarried partners), 4,798 children (4,633 natural, 82 adopted, 83 stepchildren), 236 grandchildren, 265 brothers or sisters, 125 parents, 0 foster children, 174 other relatives, 1,563 non-relatives
- In group quarters: 2,937
Size of family households: 3,178 2-persons, 881 3-persons, 859 4-persons, 437 5-persons, 100 6-persons, 18 7-or-more-persons.
Size of nonfamily households: 4,340 1-person, 796 2-persons, 478 3-persons, 25 4-persons.
1,783 married couples with children.
1,453 single-parent households (558 men, 895 women).
90.1% of residents of Newport speak English at home.
5.9% of residents speak Spanish at home (46% speak English very well, 26% speak English well, 21% speak English not well, 8% don't speak English at all).
3.1% of residents speak other Indo-European language at home (77% speak English very well, 17% speak English well, 6% speak English not well).
0.7% of residents speak Asian or Pacific Island language at home (40% speak English very well, 60% speak English well).
0.4% of residents speak other language at home (55% speak English very well, 17% speak English well, 29% speak English not well).
Foreign born population: 2,330 (9.4%)
(41.8% of them are naturalized citizens)
| Here: | 6.7 |
| State: | 6.2 |
| Here: | 4.4 |
| State: | 4.1 |

- Bedrooms in owner-occupied houses and condos in Newport, Rhode Island
- 59no bedroom
- 3451 bedroom
- 1,4292 bedrooms
- 2,1253 bedrooms
- 9284 bedrooms
- 3585+ bedrooms

- Bedrooms in renter-occupied apartments in Newport, Rhode Island
- 350no bedroom
- 1,6061 bedroom
- 2,2792 bedrooms
- 1,1013 bedrooms
- 3744 bedrooms
- 1025+ bedrooms

- Cars and other vehicles available in Newport in owner-occupied houses/condos
- 199no vehicle
- 1,7901 vehicle
- 2,3502 vehicles
- 6583 vehicles
- 1974 vehicles
- 495+ vehicles

- Cars and other vehicles available in Newport in renter-occupied apartments
- 1,315no vehicle
- 3,0141 vehicle
- 1,2632 vehicles
- 1733 vehicles
- 304 vehicles
- 165+ vehicles

- Rooms in owner-occupied houses in Newport, Rhode Island
- 471 room
- 912 rooms
- 2763 rooms
- 5184 rooms
- 7545 rooms
- 9586 rooms
- 1,0077 rooms
- 5288 rooms
- 1,0669+ rooms

- Rooms in renter-occupied apartments in Newport, Rhode Island
- 2901 room
- 5092 rooms
- 1,2203 rooms
- 1,5314 rooms
- 8245 rooms
- 6976 rooms
- 3817 rooms
- 1338 rooms
- 2269+ rooms


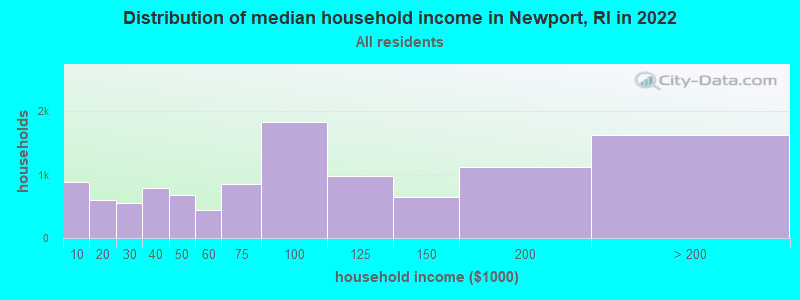
Newport, RI household income distribution

- 890Less than $10,000
- 597$10,000 to $19,999
- 546$20,000 to $29,999
- 784$30,000 to $39,999
- 680$40,000 to $49,999
- 443$50,000 to $59,999
- 859$60,000 to $74,999
- 1,829$75,000 to $99,999
- 977$100,000 to $124,999
- 650$125,000 to $149,999
- 1,125$150,000 to $199,999
- 1,619$200,000 or more
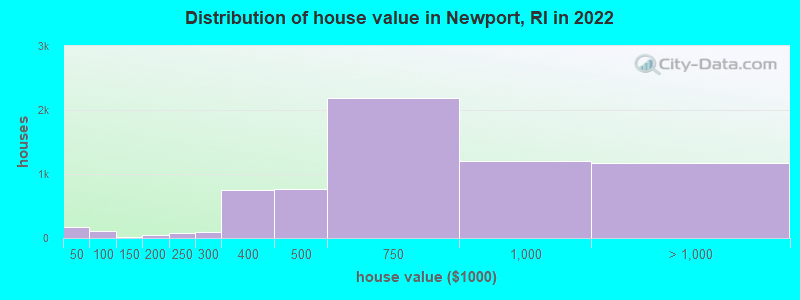
Home value of owner - occupied houses in 2022 in Newport, RI
-
- 94Less than $10,000
- 6$15,000 to $19,999
- 73$40,000 to $49,999
- 24$60,000 to $69,999
- 4$90,000 to $99,999
- 7$100,000 to $124,999
- 35$150,000 to $174,999
- 14$175,000 to $199,999
- 77$200,000 to $249,999
- 89$250,000 to $299,999
- 749$300,000 to $399,999
- 766$400,000 to $499,999
- 2,179$500,000 to $749,999
- 1,206$750,000 to $999,999
- 691$1,000,000 to $1,499,999
- 172$1,500,000 to $1,999,999
- 305$2,000,000 or more
Rent paid by renters in 2022 in Newport, RI
-
- 78Less than $100
- 48$100 to $149
- 339$150 to $199
- 129$200 to $249
- 307$250 to $299
- 164$300 to $349
- 50$350 to $399
- 132$400 to $449
- 164$450 to $499
- 61$500 to $549
- 105$600 to $649
- 27$650 to $699
- 177$700 to $749
- 107$750 to $799
- 344$800 to $899
- 175$900 to $999
- 397$1,000 to $1,249
- 1,186$1,250 to $1,499
- 1,037$1,500 to $1,999
- 493$2,000 to $2,499
- 158$2,500 to $2,999
- 210$3,000 to $3,499
- 31$3,500 or more
- 147No cash rent


Percentage of workers working in this county: 88.8%
Number of people working at home: 2,817 (21.9% of all workers)
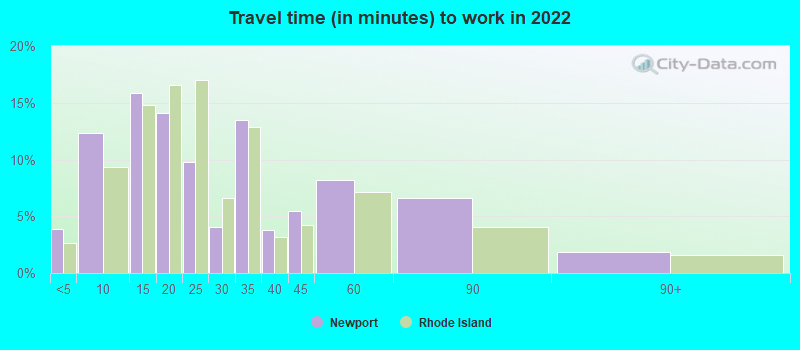
Travel time to work (commute)
- Less than 5 minutes: 920
- 5 to 9 minutes: 1,773
- 10 to 14 minutes: 2,774
- 15 to 19 minutes: 1,379
- 20 to 24 minutes: 675
- 25 to 29 minutes: 357
- 30 to 34 minutes: 645
- 35 to 39 minutes: 288
- 40 to 44 minutes: 144
- 45 to 59 minutes: 429
- 60 to 89 minutes: 390
- 90 or more minutes: 225
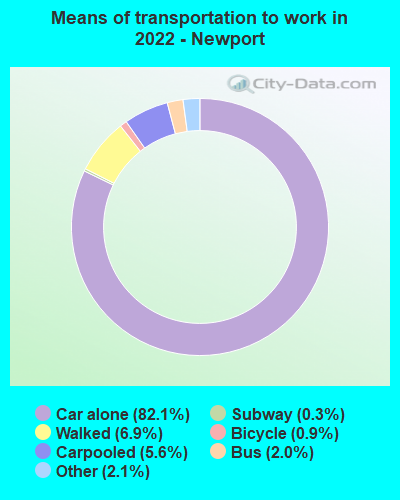
Means of transportation to work:
- Drove a car alone: 15,375 (70.5%)
- Carpooled: 1,139 (5.2%)
- Bus: 255 (1.2%)
- Long-distance train or commuter rail: 64 (0.3%)
- Taxi: 553 (2.5%)
- Bicycle: 243 (1.1%)
- Walked: 1,331 (6.1%)
- Worked at home: 2,817 (12.9%)

- Unemployment by race in 2022
- Unemployment rate for White non-Hispanic residents
- 7.1%Males
- 7.4%Females
- Unemployment rate for Black residents
- 36.8%Males
- 29.3%Females
- Unemployment rate for Asian residents
- 5.4%Males
- 3.4%Females
- Unemployment rate for other race residents
- 6.1%Females
- Unemployment rate for two or more race residents
- 13.3%Males
- 13.1%Females
- Unemployment rate for Hispanic or Latino residents
- 12.7%Females

- Year of entry for the foreign-born population in Newport, Rhode Island
- 8622010 or later
- 1882000 to 2009
- 3471990 to 1999
- 2971980 to 1989
- 1491970 to 1979
- 501Before 1970
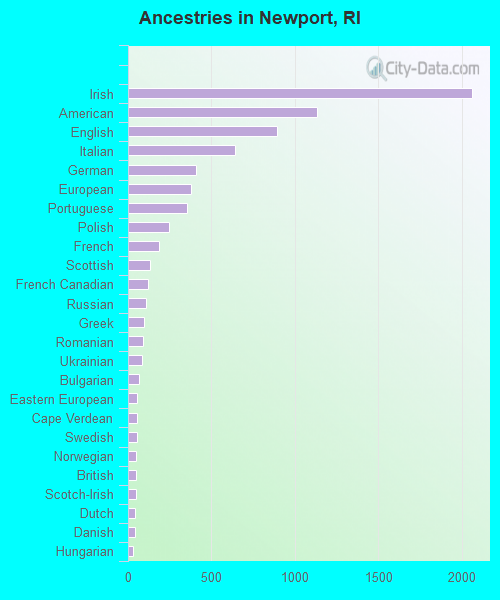
First ancestries reported:
- Irish: 2,060 (18.6%)
- American: 1,133 (10.2%)
- English: 894 (8.1%)
- Italian: 644 (5.8%)
- German: 409 (3.7%)
- European: 377 (3.4%)
- Portuguese: 352 (3.2%)
- Polish: 248 (2.2%)
- French: 187 (1.7%)
- Scottish: 133 (1.2%)
- French Canadian: 122 (1.1%)
- Russian: 106 (1.0%)
- Greek: 95 (0.9%)
- Romanian: 88 (0.8%)
- Ukrainian: 84 (0.8%)
- Bulgarian: 65 (0.6%)
- Eastern European: 55 (0.5%)
- Cape Verdean: 51 (0.5%)
- Swedish: 51 (0.5%)
- Norwegian: 50 (0.5%)
- British: 48 (0.4%)
- Scotch-Irish: 47 (0.4%)
- Dutch: 43 (0.4%)
- Danish: 40 (0.4%)
- Hungarian: 29 (0.3%)
- Northern European: 28 (0.3%)
- Australian: 27 (0.2%)
- Czech: 25 (0.2%)
- Brazilian: 23 (0.2%)
- Armenian: 22 (0.2%)
- Scandinavian: 20 (0.2%)
- Austrian: 19 (0.2%)
- Welsh: 16 (0.1%)
- Trinidadian and Tobagonian: 16 (0.1%)
- Syrian: 14 (0.1%)
- Lithuanian: 13 (0.1%)
- Croatian: 11 (0.10%)
- Haitian: 8 (0.07%)
- Canadian: 7 (0.06%)
- Jamaican: 7 (0.06%)
- Swiss: 6 (0.05%)
- Lebanese: 5 (0.05%)
- Albanian: 3 (0.03%)
- British West Indian: 2 (0.02%)
- Barbadian: 1 (0.01%)
Most common places of birth for foreign-born residents (%):
| Newport: | 26.5% (490) |
| Rhode Island: | 10.4% (16,385) |
| Newport: | 4.6% (86) |
| Rhode Island: | 1.8% (2,826) |
| Newport: | 4.5% (84) |
| Rhode Island: | 0.4% (637) |
| Newport: | 3.8% (70) |
| Rhode Island: | 0.7% (1,026) |
| Newport: | 3.3% (61) |
| Rhode Island: | 0.7% (1,165) |
| Newport: | 3.3% (61) |
| Rhode Island: | 0.1% (137) |
| Newport: | 3.1% (57) |
| Rhode Island: | 0.3% (405) |
| Newport: | 3.0% (56) |
| Rhode Island: | 0.2% (283) |
| Newport: | 2.8% (51) |
| Rhode Island: | 0.7% (1,051) |
| Newport: | 2.8% (51) |
| Rhode Island: | 0.5% (790) |
| Newport: | 2.6% (48) |
| Rhode Island: | 0.3% (453) |
| Newport: | 2.4% (44) |
| Rhode Island: | 0.2% (303) |
| Newport: | 2.1% (39) |
| Rhode Island: | 0.5% (793) |
| Newport: | 2.0% (37) |
| Rhode Island: | 0.5% (848) |
| Newport: | 2.0% (37) |
| Rhode Island: | 0.1% (131) |
| Newport: | 1.8% (33) |
| Rhode Island: | 2.4% (3,836) |
| Newport: | 1.7% (31) |
| Rhode Island: | 0.5% (769) |
| Newport: | 1.7% (31) |
| Rhode Island: | 0.4% (603) |
| Newport: | 1.6% (30) |
| Rhode Island: | 0.1% (96) |
| Newport: | 1.5% (28) |
| Rhode Island: | 0.4% (554) |
Place of birth for U.S.-born residents:
- This state: 9,084
- Other state: 12,681
- Northeast: 8,450
- Midwest: 1,162
- South: 1,881
- West: 1,018
83.7% of Newport residents lived in the same house 1 years ago.
Out of people who lived in different houses, 20.6% lived in this county.
Out of people who lived in different counties, 9.5% lived in Rhode Island.
| Newport: | 83.7% |
| State average: | 89.3% |
Education attainment for males 25 years and older:
- No schooling: 55
- Nursery to 4th grade: 4
- 5th and 6th grade: 82
- 7th and 8th grade: 94
- 9th grade: 24
- 10th grade: 37
- 11th grade: 20
- 12th grade, no diploma: 33
- High school graduate (or equivalency): 1,745
- Less than 1 year of college: 478
- Some college more than 1 year, no degree: 997
- Associate degree: 254
- Bachelor's degree: 2,913
- Master's degree: 1,204
- Professional school degree: 462
- Doctorate degree: 212

Education attainment for females 25 years and older:
- No schooling: 133
- Nursery to 4th grade: 0
- 5th and 6th grade: 13
- 7th and 8th grade: 68
- 9th grade: 22
- 10th grade: 92
- 11th grade: 48
- 12th grade, no diploma: 23
- High school graduate (or equivalency): 1,997
- Less than 1 year of college: 509
- Some college more than 1 year, no degree: 823
- Associate degree: 540
- Bachelor's degree: 2,806
- Master's degree: 1,472
- Professional school degree: 493
- Doctorate degree: 142


Housing units in structures:
- One, detached: 5,334
- One, attached: 708
- Two: 2,249
- 3 or 4: 2,803
- 5 to 9: 991
- 10 to 19: 448
- 20 to 49: 377
- 50 or more: 758
- Boats, RVs, vans, etc.: 13
Housing units lacking complete kitchen facilities in 2022: 1.5%
House/condo owner moved in on average 16 years ago
Renter moved in on average 2 years ago

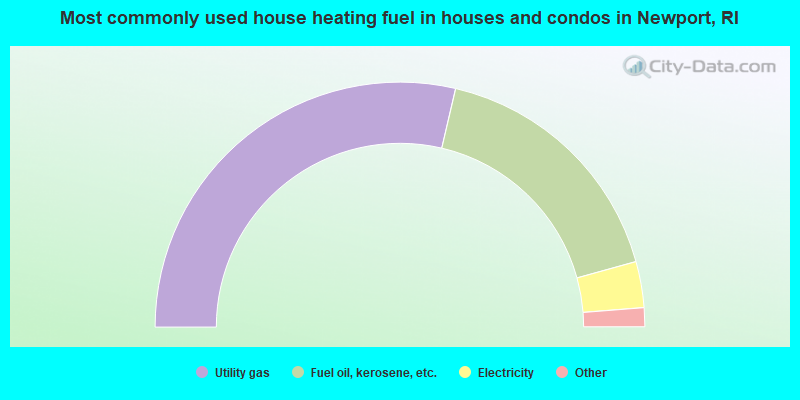
- 57.3%Utility gas
- 34.1%Fuel oil, kerosene, etc.
- 6.1%Electricity
- 1.4%Wood
- 0.8%Bottled, tank, or LP gas
- 0.2%Other fuel
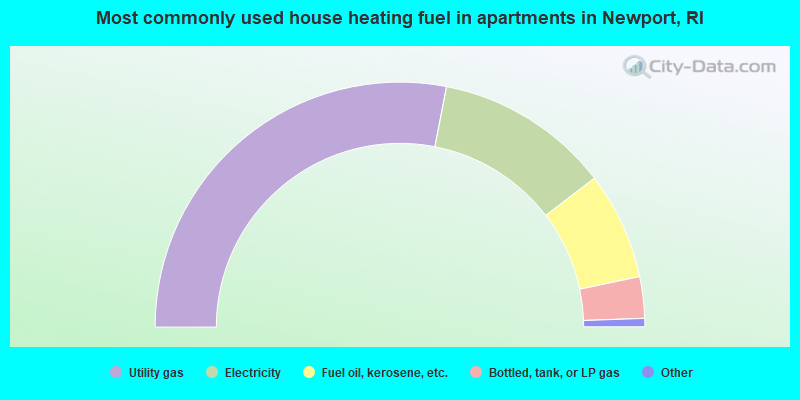
- 56.1%Utility gas
- 23.1%Electricity
- 14.2%Fuel oil, kerosene, etc.
- 5.5%Bottled, tank, or LP gas
- 0.6%No fuel used
- 0.3%Other fuel
- 0.1%Solar energy
Private vs. public school enrollment:
| Here: | 24.2% |
| Rhode Island: | 12.2% |
| Here: | 25.0% |
| Rhode Island: | 11.6% |
| Here: | 60.6% |
| Rhode Island: | 41.1% |


