Providence, RI (Rhode Island) Houses and Residents
| Providence: | $359,600 |
| Rhode Island: | $383,900 |
Mean price in 2022:
Detached houses: $438,363
Here: $438,363 State: $445,354 Townhouses or other attached units: $423,976
Here: $423,976 State: $371,092 In 2-unit structures: $308,328
Here: $308,328 State: $317,098 In 3-to-4-unit structures: $299,522
Here: $299,522 State: $315,052 In 5-or-more-unit structures: $389,021
Here: $389,021 State: $291,252
Total population: 179,154 (Urban population: 173,618, Rural population: 0)
Houses: 79,302 (72,767 occupied: 30,230 owner occupied, 42,537 renter occupied)
| % of renters here: | 58% |
| State: | 37% |
Housing density: 4,294 houses/condos per square mile
Median price asked for vacant for-sale houses and condos in 2022: $319,632.
Median contract rent in 2022: $1,195 (lower quartile is $721, upper quartile is $1,609)
Median rent asked for vacant for-rent units in 2022: $611
Median gross rent in Providence, RI in 2022: $1,382
Housing units in Providence with a mortgage: 20,897 (2,838 second mortgage, 0 home equity loan, 2,307 both second mortgage and home equity loan)
Houses without a mortgage: 922
Median household income for houses/condos with a mortgage: $98,202
Median household income for apartments without a mortgage: $80,927
Median monthly housing costs: $1,475
Compare current foreclosures in Providence, RI:
| Photo | Address | Area | Beds / Baths | Price | Details |
|---|---|---|---|---|---|

|
#1
Whittier Ave
Providence, RI 02909
|
3 sq. feet
|
3 baths 6 beds |
$109,900
|
show details |

|
#2
Cypress St
Providence, RI 02906
|
3,498 sq. feet
|
3 baths 6 beds |
show details | |

|
#3
Valley Green Court
Providence, RI 02904
|
1,440 sq. feet
|
3 baths 2 beds |
show details | |

|
#4
What Cheer Ave
Providence, RI 02909
|
2,280 sq. feet
|
2 baths 3 beds |
show details | |

|
#5
Edgemere Ave
Providence, RI 02909
|
1,328 sq. feet
|
2 baths 4 beds |
show details | |

|
#6
Wood St
Providence, RI 02909
|
2,839 sq. feet
|
3 baths 8 beds |
show details | |

|
#7
Dodge St
Providence, RI 02904
|
1,275 sq. feet
|
1 baths 3 beds |
show details | |

|
#8
Brown St
Providence, RI 02904
|
2,714 sq. feet
|
3 baths 4 beds |
show details | |

|
#9
Rosner Ave
Providence, RI 02904
|
1,236 sq. feet
|
1 baths 3 beds |
show details | |

|
#10
Douglas Ave
Providence, RI 02908
|
2,745 sq. feet
|
3 baths 6 beds |
show details |
| Photo | Address | Area | Beds / Baths | Price | Details |
|---|---|---|---|---|---|

|
#11
Corinth St
Providence, RI 02907
|
1,517 sq. feet
|
2 baths 4 beds |
show details | |

|
#12
Blackstone St
Providence, RI 02907
|
1,334 sq. feet
|
1 baths 5 beds |
show details | |

|
#13
Daniel Ave # 2
Providence, RI 02909
|
2,592 sq. feet
|
2 baths 4 beds |
show details | |

|
#14
9th St
Providence, RI 02906
|
2,652 sq. feet
|
2 baths 4 beds |
show details | |

|
#15
Newcomb St
Providence, RI 02908
|
1,976 sq. feet
|
3 baths 4 beds |
show details | |

|
#16
Camden Ave
Providence, RI 02908
|
1,040 sq. feet
|
1 baths 3 beds |
show details | |

|
#17
Raymond St # 1
Providence, RI 02908
|
4,043 sq. feet
|
4 baths 8 beds |
show details | |

|
#18
Ada St
Providence, RI 02909
|
609 sq. feet
|
1 baths 1 beds |
show details | |

|
#19
Isabella Ave
Providence, RI 02908
|
1,156 sq. feet
|
1 baths 3 beds |
show details | |

|
#20
Wheeler Ave
Providence, RI 02905
|
1,174 sq. feet
|
1 baths 3 beds |
show details |
| Photo | Address | Area | Beds / Baths | Price | Details |
|---|---|---|---|---|---|

|
#21
Jane St
Providence, RI 02904
|
1,681 sq. feet
|
1 baths 3 beds |
show details | |

|
#22
Ferncrest Ave
Providence, RI 02905
|
2,048 sq. feet
|
1 baths 4 beds |
show details | |

|
#23
Florence St
Providence, RI 02904
|
1,254 sq. feet
|
1 baths 4 beds |
show details | |

|
#24
Alton St # 1
Providence, RI 02908
|
2,814 sq. feet
|
3 baths 6 beds |
show details | |

|
#25
Whittier Ave
Providence, RI 02909
|
1,120 sq. feet
|
1 baths 3 beds |
show details | |

|
#26
Gallatin St
Providence, RI 02907
|
3,329 sq. feet
|
3 baths 5 beds |
show details | |

|
#27
Gallatin St
Providence, RI 02907
|
1,930 sq. feet
|
1 baths 3 beds |
show details | |

|
#28
Berkley St
Providence, RI 02908
|
2,907 sq. feet
|
3 baths 6 beds |
show details | |

|
#29
Burleigh St
Providence, RI 02904
|
1,036 sq. feet
|
1 baths 2 beds |
show details | |

|
#30
California Ave
Providence, RI 02905
|
1,560 sq. feet
|
1 baths 4 beds |
show details |
| Photo | Address | Area | Beds / Baths | Price | Details |
|---|---|---|---|---|---|

|
#31
Stella St # 1
Providence, RI 02909
|
1,784 sq. feet
|
2 baths 4 beds |
show details | |

|
#32
Dartmouth Ave # 1
Providence, RI 02907
|
2,770 sq. feet
|
3 baths 5 beds |
show details | |

|
#33
Curtis St
Providence, RI 02909
|
2,304 sq. feet
|
3 baths 4 beds |
show details | |

|
#34
Fairoaks Ave
Providence, RI 02908
|
1,986 sq. feet
|
2 baths 4 beds |
show details | |

|
#35
Metropolitan Rd
Providence, RI 02908
|
816 sq. feet
|
1 baths 2 beds |
show details | |

|
#36
Talbot St
Providence, RI 02904
|
1,144 sq. feet
|
2 baths 3 beds |
show details | |

|
#37
Herschel St
Providence, RI 02909
|
2,058 sq. feet
|
1 baths 3 beds |
show details | |

|
#38
Albert Ave
Providence, RI 02905
|
3,487 sq. feet
|
3 baths 6 beds |
show details | |

|
#39
Adams St
Providence, RI 02904
|
928 sq. feet
|
1 baths 3 beds |
show details | |

|
#40
Primrose St
Providence, RI 02909
|
3,644 sq. feet
|
3 baths 6 beds |
show details |
| Photo | Address | Area | Beds / Baths | Price | Details |
|---|---|---|---|---|---|

|
#41
Bonaparte St
Providence, RI 02904
|
1,152 sq. feet
|
2 baths 4 beds |
show details | |

|
#42
Miner St
Providence, RI 02905
|
2,704 sq. feet
|
3 baths 8 beds |
show details | |

|
#43
Loveday St
Providence, RI 02908
|
1,827 sq. feet
|
2 baths 6 beds |
show details | |

|
#44
Ward Ave
Providence, RI 02904
|
1,748 sq. feet
|
3 baths 4 beds |
show details | |

|
#45
Charles St
Providence, RI 02904
|
5,724 sq. feet
|
1 baths 2 beds |
show details | |

|
#46
Hazael St
Providence, RI 02908
|
2,288 sq. feet
|
2 baths 4 beds |
show details | |

|
#47
River Ave
Providence, RI 02908
|
2,859 sq. feet
|
3 baths 8 beds |
show details | |

|
#48
Westwood Ave
Providence, RI 02905
|
1,751 sq. feet
|
1 baths 3 beds |
show details | |

|
#49
E Lakeview Dr
Providence, RI 02904
|
1,584 sq. feet
|
2 baths 3 beds |
show details | |

|
Check over 1 million property listings on Foreclosure.com!
|
browse all offers | |||

Latest news about housing in Providence, RI collected exclusively by city-data.com from local newspapers, TV, and radio stations


Median year apartment built: 1945
Household type by relationship:
Households: 189,575- Male householders: 34,586 (10,367 living alone), Female householders: 38,181 (14,941 living alone)
19,758 spouses (18,858 opposite-sex spouses), 8,591 unmarried partners, (7,809 opposite-sex unmarried partners), 51,353 children (47,140 natural, 188 adopted, 4,025 stepchildren), 2,625 grandchildren, 2,121 brothers or sisters, 2,937 parents, 116 foster children, 3,060 other relatives, 11,745 non-relatives
- In group quarters: 14,502
Size of family households: 12,839 2-persons, 9,929 3-persons, 7,987 4-persons, 3,599 5-persons, 2,376 6-persons, 275 7-or-more-persons.
Size of nonfamily households: 25,308 1-person, 7,852 2-persons, 1,841 3-persons, 433 4-persons, 220 5-persons, 108 7-or-more-persons.
15,498 married couples with children.
18,135 single-parent households (9,141 men, 8,994 women).
51.7% of residents of Providence speak English at home.
37.1% of residents speak Spanish at home (47% speak English very well, 21% speak English well, 16% speak English not well, 16% don't speak English at all).
5.0% of residents speak other Indo-European language at home (78% speak English very well, 15% speak English well, 7% speak English not well, 1% don't speak English at all).
4.3% of residents speak Asian or Pacific Island language at home (52% speak English very well, 33% speak English well, 10% speak English not well, 5% don't speak English at all).
2.6% of residents speak other language at home (78% speak English very well, 11% speak English well, 8% speak English not well, 2% don't speak English at all).
Foreign born population: 63,313 (33.4%)
(42.5% of them are naturalized citizens)
| Here: | 6.1 |
| State: | 6.2 |
| Here: | 4.2 |
| State: | 4.1 |

- Bedrooms in owner-occupied houses and condos in Providence, Rhode Island
- 340no bedroom
- 1,0881 bedroom
- 8,2092 bedrooms
- 14,4923 bedrooms
- 4,1884 bedrooms
- 1,9135+ bedrooms

- Bedrooms in renter-occupied apartments in Providence, Rhode Island
- 4,890no bedroom
- 11,9621 bedroom
- 13,9612 bedrooms
- 10,2523 bedrooms
- 1,0504 bedrooms
- 4225+ bedrooms

- Cars and other vehicles available in Providence in owner-occupied houses/condos
- 1,657no vehicle
- 11,4821 vehicle
- 11,1352 vehicles
- 3,7243 vehicles
- 1,4444 vehicles
- 7885+ vehicles

- Cars and other vehicles available in Providence in renter-occupied apartments
- 13,439no vehicle
- 19,2861 vehicle
- 6,9332 vehicles
- 2,7443 vehicles
- 624 vehicles
- 735+ vehicles

- Rooms in owner-occupied houses in Providence, Rhode Island
- 3401 room
- 1702 rooms
- 6293 rooms
- 2,7334 rooms
- 6,8555 rooms
- 7,0236 rooms
- 4,0967 rooms
- 4,2438 rooms
- 4,1419+ rooms

- Rooms in renter-occupied apartments in Providence, Rhode Island
- 4,6491 room
- 2,0602 rooms
- 8,2873 rooms
- 8,5974 rooms
- 8,3515 rooms
- 7,2346 rooms
- 2,3817 rooms
- 7458 rooms
- 2339+ rooms


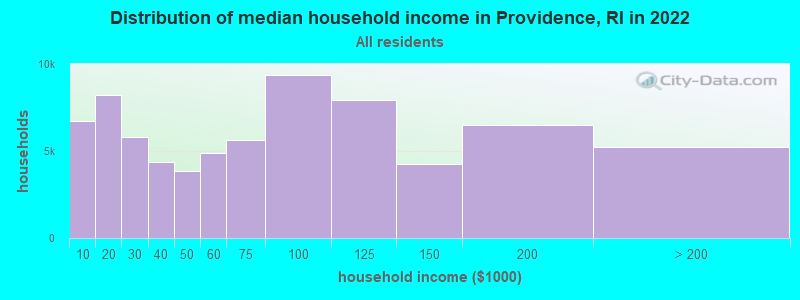
Providence, RI household income distribution

- 6,750Less than $10,000
- 8,220$10,000 to $19,999
- 5,798$20,000 to $29,999
- 4,389$30,000 to $39,999
- 3,828$40,000 to $49,999
- 4,888$50,000 to $59,999
- 5,640$60,000 to $74,999
- 9,376$75,000 to $99,999
- 7,912$100,000 to $124,999
- 4,262$125,000 to $149,999
- 6,494$150,000 to $199,999
- 5,210$200,000 or more
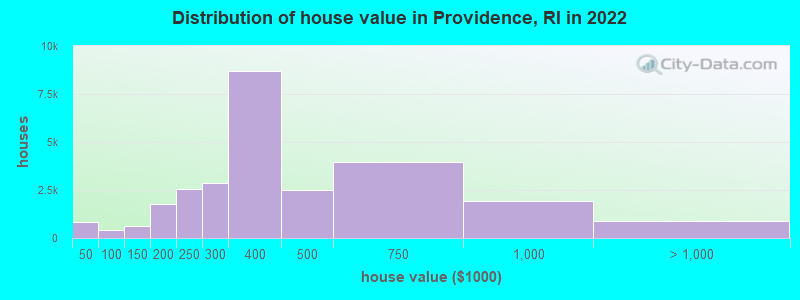
Home value of owner - occupied houses in 2022 in Providence, RI
-
- 558Less than $10,000
- 14$10,000 to $14,999
- 92$15,000 to $19,999
- 43$20,000 to $24,999
- 80$25,000 to $29,999
- 28$30,000 to $34,999
- 32$40,000 to $49,999
- 43$50,000 to $59,999
- 80$60,000 to $69,999
- 146$70,000 to $79,999
- 50$80,000 to $89,999
- 43$90,000 to $99,999
- 226$100,000 to $124,999
- 382$125,000 to $149,999
- 1,006$150,000 to $174,999
- 750$175,000 to $199,999
- 2,552$200,000 to $249,999
- 2,860$250,000 to $299,999
- 8,701$300,000 to $399,999
- 2,494$400,000 to $499,999
- 3,975$500,000 to $749,999
- 1,940$750,000 to $999,999
- 705$1,000,000 to $1,499,999
- 74$1,500,000 to $1,999,999
- 130$2,000,000 or more
Rent paid by renters in 2022 in Providence, RI
-
- 97Less than $100
- 665$100 to $149
- 804$150 to $199
- 3,180$200 to $249
- 1,567$250 to $299
- 1,086$300 to $349
- 124$350 to $399
- 239$400 to $449
- 787$450 to $499
- 444$500 to $549
- 479$550 to $599
- 478$600 to $649
- 101$650 to $699
- 798$700 to $749
- 1,361$750 to $799
- 2,588$800 to $899
- 1,239$900 to $999
- 6,060$1,000 to $1,249
- 7,372$1,250 to $1,499
- 7,648$1,500 to $1,999
- 3,239$2,000 to $2,499
- 849$2,500 to $2,999
- 318$3,500 or more
- 1,014No cash rent


Percentage of workers working in this county: 78.4%
Number of people working at home: 15,067 (16.6% of all workers)
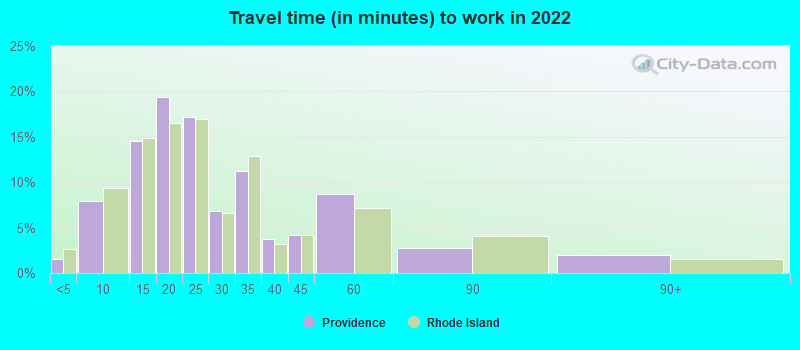
Travel time to work (commute)
- Less than 5 minutes: 1,852
- 5 to 9 minutes: 9,101
- 10 to 14 minutes: 11,881
- 15 to 19 minutes: 12,657
- 20 to 24 minutes: 14,233
- 25 to 29 minutes: 5,373
- 30 to 34 minutes: 5,848
- 35 to 39 minutes: 1,114
- 40 to 44 minutes: 2,655
- 45 to 59 minutes: 4,659
- 60 to 89 minutes: 4,119
- 90 or more minutes: 2,183
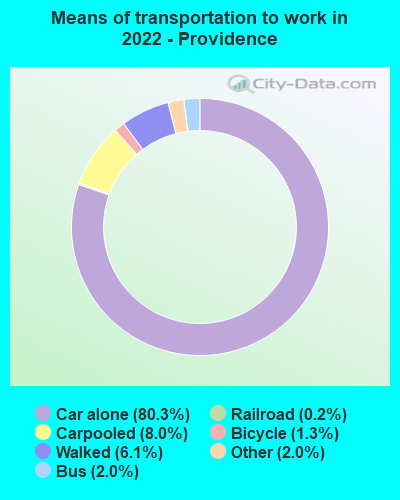
Means of transportation to work:
- Drove a car alone: 90,927 (70.8%)
- Carpooled: 9,073 (7.1%)
- Bus: 2,315 (1.8%)
- Long-distance train or commuter rail: 109 (0.1%)
- Light rail, streetcar or trolley: 220 (0.2%)
- Taxi: 2,275 (1.8%)
- Bicycle: 1,494 (1.2%)
- Walked: 6,881 (5.4%)
- Worked at home: 15,067 (11.7%)

- Unemployment by race in 2022
- Unemployment rate for White non-Hispanic residents
- 3.3%Males
- 2.8%Females
- Unemployment rate for Black residents
- 5.1%Males
- 13.2%Females
- Unemployment rate for American Indian and Alaska Native residents
- 1.2%Males
- 23.5%Females
- Unemployment rate for Asian residents
- 3.4%Males
- 1.7%Females
- Unemployment rate for other race residents
- 5.6%Males
- 4.3%Females
- Unemployment rate for two or more race residents
- 14.3%Males
- 12.5%Females
- Unemployment rate for Hispanic or Latino residents
- 5.2%Males
- 6.2%Females

- Year of entry for the foreign-born population in Providence, Rhode Island
- 28,1362010 or later
- 13,8602000 to 2009
- 9,1121990 to 1999
- 14,6571980 to 1989
- 5,5691970 to 1979
- 3,784Before 1970
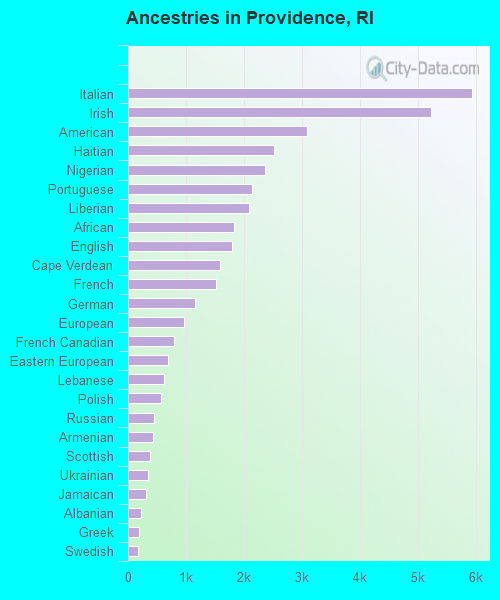
First ancestries reported:
- Italian: 5,930 (4.9%)
- Irish: 5,229 (4.3%)
- American: 3,088 (2.6%)
- Haitian: 2,515 (2.1%)
- Nigerian: 2,368 (2.0%)
- Portuguese: 2,145 (1.8%)
- Liberian: 2,083 (1.7%)
- African: 1,820 (1.5%)
- English: 1,801 (1.5%)
- Cape Verdean: 1,595 (1.3%)
- French: 1,515 (1.3%)
- German: 1,152 (1.0%)
- European: 972 (0.8%)
- French Canadian: 793 (0.7%)
- Eastern European: 695 (0.6%)
- Lebanese: 615 (0.5%)
- Polish: 561 (0.5%)
- Russian: 445 (0.4%)
- Armenian: 430 (0.4%)
- Scottish: 378 (0.3%)
- Ukrainian: 347 (0.3%)
- Jamaican: 303 (0.3%)
- Albanian: 219 (0.2%)
- Greek: 194 (0.2%)
- Swedish: 181 (0.2%)
- Syrian: 156 (0.1%)
- Brazilian: 142 (0.1%)
- Norwegian: 139 (0.1%)
- Canadian: 107 (0.09%)
- Slovak: 100 (0.08%)
- Romanian: 97 (0.08%)
- Ghanaian: 91 (0.08%)
- West Indian: 85 (0.07%)
- Palestinian: 83 (0.07%)
- Scotch-Irish: 81 (0.07%)
- Welsh: 80 (0.07%)
- Egyptian: 66 (0.05%)
- Barbadian: 65 (0.05%)
- Hungarian: 60 (0.05%)
- Danish: 59 (0.05%)
- Swiss: 58 (0.05%)
- British: 55 (0.05%)
- Kenyan: 54 (0.04%)
- Scandinavian: 53 (0.04%)
- Iranian: 49 (0.04%)
- Dutch: 47 (0.04%)
- Czech: 45 (0.04%)
- Arab: 42 (0.03%)
- Guyanese: 41 (0.03%)
- Turkish: 41 (0.03%)
- Belizean: 40 (0.03%)
- Moroccan: 30 (0.02%)
- Australian: 30 (0.02%)
- Slavic: 29 (0.02%)
- British West Indian: 28 (0.02%)
- Ethiopian: 26 (0.02%)
- Northern European: 21 (0.02%)
- Pennsylvania German: 20 (0.02%)
- Latvian: 16 (0.01%)
- Czechoslovakian: 15 (0.01%)
- Croatian: 13 (0.01%)
- Lithuanian: 13 (0.01%)
- Trinidadian and Tobagonian: 13 (0.01%)
- Israeli: 12 (0.01%)
Most common places of birth for foreign-born residents (%):
| Providence: | 42.9% (26,243) |
| Rhode Island: | 21.0% (33,163) |
| Providence: | 15.4% (9,408) |
| Rhode Island: | 10.4% (16,385) |
| Providence: | 3.5% (2,138) |
| Rhode Island: | 2.5% (3,901) |
| Providence: | 2.6% (1,594) |
| Rhode Island: | 1.9% (2,997) |
| Providence: | 2.4% (1,499) |
| Rhode Island: | 4.1% (6,461) |
| Providence: | 2.4% (1,486) |
| Rhode Island: | 3.0% (4,789) |
| Providence: | 2.4% (1,482) |
| Rhode Island: | 1.9% (3,057) |
| Providence: | 1.7% (1,069) |
| Rhode Island: | 4.1% (6,520) |
| Providence: | 1.7% (1,064) |
| Rhode Island: | 1.2% (1,902) |
| Providence: | 1.7% (1,022) |
| Rhode Island: | 10.0% (15,766) |
| Providence: | 1.6% (1,004) |
| Rhode Island: | 0.7% (1,059) |
| Providence: | 1.5% (937) |
| Rhode Island: | 5.1% (8,042) |
Place of birth for U.S.-born residents:
- This state: 57,775
- Other state: 59,289
- Northeast: 40,071
- Midwest: 5,969
- South: 8,089
- West: 5,160
83.8% of Providence residents lived in the same house 1 years ago.
Out of people who lived in different houses, 33.7% lived in this county.
Out of people who lived in different counties, 12.5% lived in Rhode Island.
| Providence: | 83.8% |
| State average: | 89.3% |
Education attainment for males 25 years and older:
- No schooling: 1,687
- Nursery to 4th grade: 681
- 5th and 6th grade: 810
- 7th and 8th grade: 1,443
- 9th grade: 2,269
- 10th grade: 870
- 11th grade: 715
- 12th grade, no diploma: 1,453
- High school graduate (or equivalency): 16,021
- Less than 1 year of college: 818
- Some college more than 1 year, no degree: 7,579
- Associate degree: 2,109
- Bachelor's degree: 10,526
- Master's degree: 4,840
- Professional school degree: 3,291
- Doctorate degree: 1,621

Education attainment for females 25 years and older:
- No schooling: 1,840
- Nursery to 4th grade: 1,186
- 5th and 6th grade: 1,472
- 7th and 8th grade: 2,056
- 9th grade: 1,180
- 10th grade: 387
- 11th grade: 326
- 12th grade, no diploma: 1,834
- High school graduate (or equivalency): 16,552
- Less than 1 year of college: 2,843
- Some college more than 1 year, no degree: 5,395
- Associate degree: 2,662
- Bachelor's degree: 11,960
- Master's degree: 6,911
- Professional school degree: 1,892
- Doctorate degree: 2,299


Housing units in structures:
- One, detached: 22,357
- One, attached: 3,796
- Two: 13,243
- 3 or 4: 17,931
- 5 to 9: 5,167
- 10 to 19: 2,630
- 20 to 49: 1,644
- 50 or more: 12,259
- Mobile homes: 275
Housing units lacking complete kitchen facilities in 2022: 1.9%
House/condo owner moved in on average 12 years ago
Renter moved in on average 3 years ago

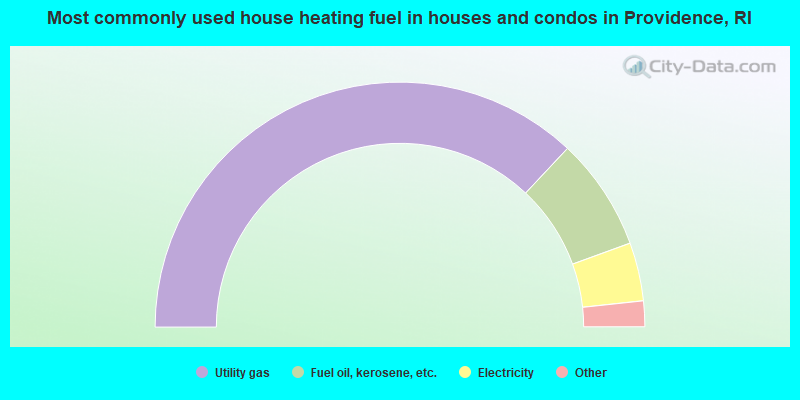
- 74.0%Utility gas
- 14.9%Fuel oil, kerosene, etc.
- 7.7%Electricity
- 2.1%Bottled, tank, or LP gas
- 1.2%No fuel used
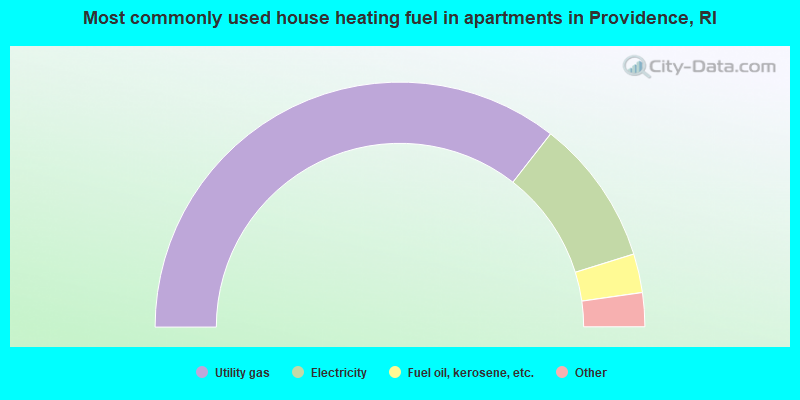
- 71.1%Utility gas
- 19.3%Electricity
- 5.1%Fuel oil, kerosene, etc.
- 3.3%Bottled, tank, or LP gas
- 0.7%No fuel used
- 0.3%Other fuel
- 0.1%Solar energy
Private vs. public school enrollment:
| Here: | 15.1% |
| Rhode Island: | 12.2% |
| Here: | 10.9% |
| Rhode Island: | 11.6% |
| Here: | 70.3% |
| Rhode Island: | 41.1% |


