Riverview, MI (Michigan) Houses and Residents
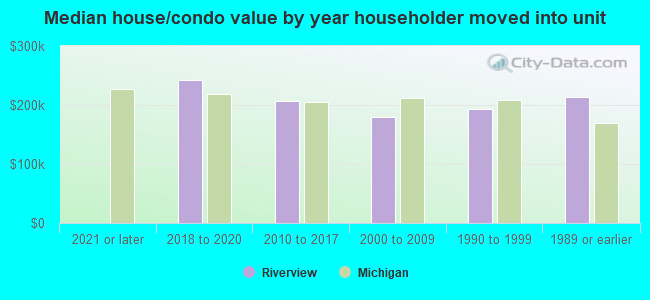
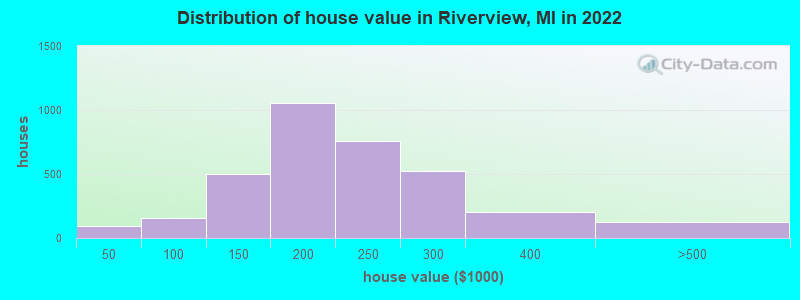
| Riverview: | $205,662 |
| Michigan: | $224,400 |
Total population: 12,222 (All urban)
Houses: 5,459 (5,154 occupied: 3,199 owner occupied, 1,984 renter occupied)
| % of renters here: | 38% |
| State: | 27% |
Housing density: 1,239 houses/condos per square mile
Median price asked for vacant for-sale houses and condos in 2022 in this county: $106,377.
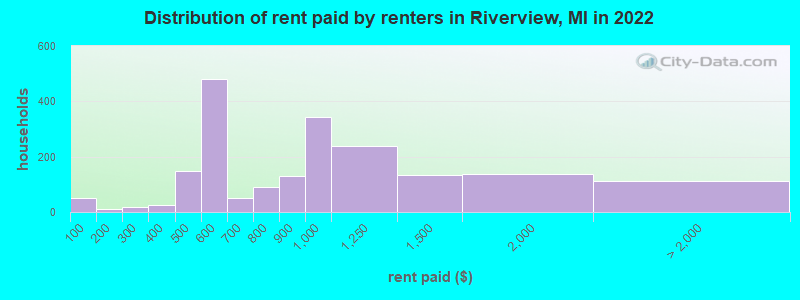
Median contract rent in 2022: $899 (lower quartile is $527, upper quartile is $1,062)
Median rent asked for vacant for-rent units in 2022: $1,762
Median gross rent in Riverview, MI in 2022: $970
Housing units in Riverview with a mortgage: 2,038 (197 second mortgage, 8 home equity loan, 173 both second mortgage and home equity loan)
Houses without a mortgage: 71
Median household income for houses/condos with a mortgage: $104,417
Median household income for apartments without a mortgage: $66,639
Median monthly housing costs: $1,018
Compare current foreclosures in Riverview, MI:
| Photo | Address | Area | Beds / Baths | Price | Details |
|---|---|---|---|---|---|

|
#1
Winwood Ave
Riverview, MI 48193
|
1,025 sq. feet
|
2 baths 2 beds |
show details | |

|
#2
Winwood Ct
Riverview, MI 48193
|
1,025 sq. feet
|
1 baths 3 beds |
show details | |

|
#3
Quail Ridge Dr S
Riverview, MI 48193
|
1,248 sq. feet
|
1 baths 2 beds |
show details | |

|
#4
Ray St
Riverview, MI 48193
|
975 sq. feet
|
2 baths 3 beds |
show details | |

|
#5
Thornwood St
Riverview, MI 48193
|
1,827 sq. feet
|
3 baths - beds |
show details | |

|
#6
Vernon
Riverview, MI 48193
|
1,570 sq. feet
|
1 baths 3 beds |
show details | |

|
#7
Maplewood Ct
Riverview, MI 48193
|
2,746 sq. feet
|
2 baths - beds |
show details | |

|
#8
Doncaster Ave
Riverview, MI 48193
|
1,688 sq. feet
|
2 baths 3 beds |
show details | |

|
#9
Adams Dr
Riverview, MI 48193
|
1,905 sq. feet
|
1 baths 2 beds |
show details | |

|
#10
Winwood Ave
Riverview, MI 48193
|
1,478 sq. feet
|
1 baths 3 beds |
show details |
| Photo | Address | Area | Beds / Baths | Price | Details |
|---|---|---|---|---|---|

|
#11
Winwood Ave
Riverview, MI 48193
|
2,449 sq. feet
|
1 baths - beds |
show details | |

|
#12
Shenandoah Dr
Riverview, MI 48193
|
- sq. feet
|
- baths - beds |
show details | |

|
#13
Sibley Rd
Riverview, MI 48193
|
- sq. feet
|
- baths - beds |
show details | |

|
#14
Shenandoah Dr
Riverview, MI 48193
|
- sq. feet
|
- baths - beds |
show details | |

|
#15
Fort St Apt 104
Riverview, MI 48193
|
- sq. feet
|
- baths - beds |
show details | |

|
#16
Pine W
Riverview, MI 48193
|
- sq. feet
|
- baths - beds |
show details | |

|
#17
Winwood Ave
Riverview, MI 48193
|
- sq. feet
|
- baths - beds |
show details | |

|
#18
Sibley Rd
Riverview, MI 48193
|
- sq. feet
|
- baths - beds |
show details | |

|
#19
Armstrong Ave
Riverview, MI 48193
|
- sq. feet
|
- baths - beds |
show details | |

|
#20
Pine W
Riverview, MI 48193
|
- sq. feet
|
- baths - beds |
show details |
| Photo | Address | Area | Beds / Baths | Price | Details |
|---|---|---|---|---|---|

|
#21
Shenandoah Dr
Riverview, MI 48193
|
- sq. feet
|
- baths - beds |
show details | |

|
#22
Pine E
Riverview, MI 48193
|
- sq. feet
|
- baths - beds |
show details | |

|
#23
Pine W
Riverview, MI 48193
|
- sq. feet
|
- baths - beds |
show details | |

|
#24
Pine W
Riverview, MI 48193
|
- sq. feet
|
- baths - beds |
show details | |

|
#25
Pine W
Riverview, MI 48193
|
- sq. feet
|
- baths - beds |
show details | |

|
#26
Sibley Rd
Riverview, MI 48193
|
- sq. feet
|
- baths - beds |
show details | |

|
#27
Riverview St
Riverview, MI 48193
|
- sq. feet
|
- baths - beds |
show details | |

|
#28
Sibley Rd Ste 2
Riverview, MI 48193
|
- sq. feet
|
- baths - beds |
show details | |

|
#29
Pine E # 31
Riverview, MI 48193
|
- sq. feet
|
- baths - beds |
show details | |

|
#30
Ray St
Riverview, MI 48193
|
- sq. feet
|
- baths - beds |
show details |
| Photo | Address | Area | Beds / Baths | Price | Details |
|---|---|---|---|---|---|

|
#31
Brookview Dr Apt 201
Riverview, MI 48193
|
- sq. feet
|
- baths - beds |
show details | |

|
#32
Brookview Dr Apt 202
Riverview, MI 48193
|
- sq. feet
|
- baths - beds |
show details | |

|
#33
Valade St
Riverview, MI 48193
|
- sq. feet
|
- baths - beds |
show details | |

|
#34
Pine W
Riverview, MI 48193
|
- sq. feet
|
- baths - beds |
show details | |

|
#35
Fort St Apt 103
Riverview, MI 48193
|
- sq. feet
|
- baths - beds |
show details | |

|
#36
Pennsylvania Rd Apt 104
Riverview, MI 48193
|
- sq. feet
|
- baths - beds |
show details | |

|
#37
Pine E
Riverview, MI 48193
|
- sq. feet
|
- baths - beds |
show details | |

|
#38
Greentrees St
Riverview, MI 48193
|
- sq. feet
|
- baths - beds |
show details | |

|
#39
Matthews St
Riverview, MI 48193
|
- sq. feet
|
- baths - beds |
show details | |

|
#40
Mulberry St
Riverview, MI 48193
|
- sq. feet
|
- baths - beds |
show details |
| Photo | Address | Area | Beds / Baths | Price | Details |
|---|---|---|---|---|---|

|
#41
Marsha St
Riverview, MI 48193
|
- sq. feet
|
- baths - beds |
show details | |

|
#42
Devonshire St
Riverview, MI 48193
|
- sq. feet
|
- baths - beds |
show details | |

|
#43
Pennsylvania Rd
Riverview, MI 48193
|
- sq. feet
|
- baths - beds |
show details | |

|
#44
Hamann St
Riverview, MI 48193
|
- sq. feet
|
- baths - beds |
show details | |

|
#45
Hamann St
Riverview, MI 48193
|
- sq. feet
|
- baths - beds |
show details | |

|
#46
Brandywine St
Riverview, MI 48193
|
- sq. feet
|
- baths - beds |
show details | |

|
#47
Reno St
Riverview, MI 48193
|
- sq. feet
|
- baths - beds |
show details | |

|
#48
Ray St
Riverview, MI 48193
|
- sq. feet
|
- baths - beds |
show details | |

|
Check over 1 million property listings on Foreclosure.com!
|
browse all offers | |||

Latest news about housing in Riverview, MI collected exclusively by city-data.com from local newspapers, TV, and radio stations


Median year apartment built: 1972
Household type by relationship:
Households: 12,218- Male householders: 2,348 (499 living alone), Female householders: 2,742 (1,240 living alone)
2,006 spouses (2,006 opposite-sex spouses), 202 unmarried partners, (202 opposite-sex unmarried partners), 3,617 children (3,234 natural, 99 adopted, 283 stepchildren), 150 grandchildren, 348 brothers or sisters, 101 parents, 0 foster children, 48 other relatives, 157 non-relatives
- In group quarters: 495
Size of family households: 1,843 2-persons, 550 3-persons, 516 4-persons, 254 5-persons, 50 6-persons, 29 7-or-more-persons.
Size of nonfamily households: 1,802 1-person, 155 2-persons, 7 3-persons.
1,986 married couples with children.
470 single-parent households (154 men, 316 women).
94.6% of residents of Riverview speak English at home.
1.5% of residents speak Spanish at home (84% speak English very well, 9% speak English well, 7% don't speak English at all).
2.5% of residents speak other Indo-European language at home (67% speak English very well, 19% speak English well, 15% speak English not well).
0.8% of residents speak Asian or Pacific Island language at home (37% speak English very well, 55% speak English well, 8% speak English not well).
0.9% of residents speak other language at home (56% speak English very well, 44% speak English well).
Foreign born population: 475 (3.9%)
(72.4% of them are naturalized citizens)
| Here: | 6.5 |
| State: | 6.5 |
| Here: | 4.4 |
| State: | 4.3 |
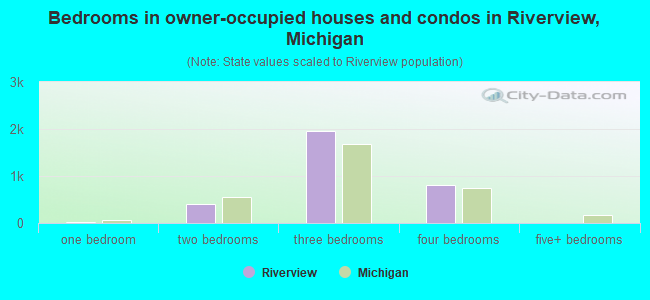
- Bedrooms in owner-occupied houses and condos in Riverview, Michigan
- 0no bedroom
- 161 bedroom
- 4022 bedrooms
- 1,9563 bedrooms
- 8194 bedrooms
- 65+ bedrooms
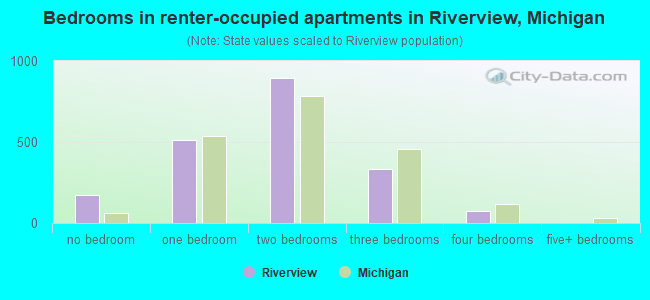
- Bedrooms in renter-occupied apartments in Riverview, Michigan
- 170no bedroom
- 5101 bedroom
- 8982 bedrooms
- 3343 bedrooms
- 724 bedrooms
- 05+ bedrooms
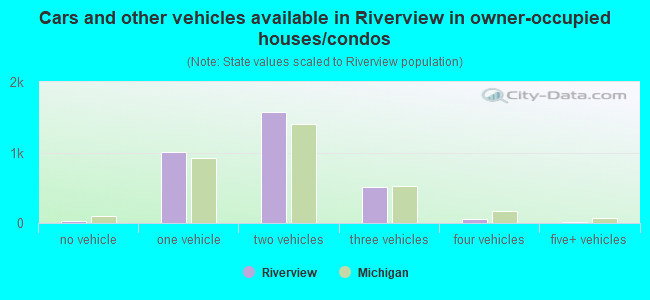
- Cars and other vehicles available in Riverview in owner-occupied houses/condos
- 22no vehicle
- 1,0141 vehicle
- 1,5752 vehicles
- 5143 vehicles
- 594 vehicles
- 155+ vehicles
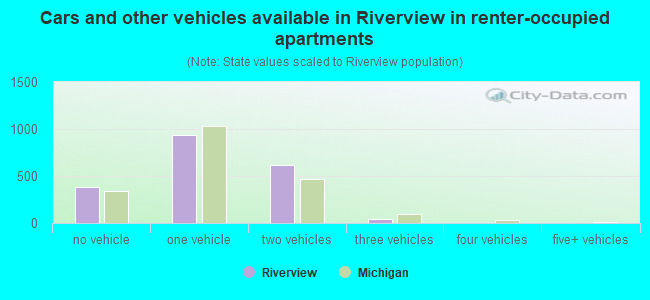
- Cars and other vehicles available in Riverview in renter-occupied apartments
- 384no vehicle
- 9401 vehicle
- 6152 vehicles
- 413 vehicles
- 04 vehicles
- 55+ vehicles
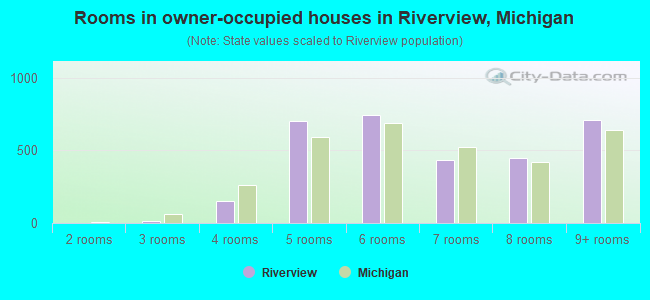
- Rooms in owner-occupied houses in Riverview, Michigan
- 01 room
- 02 rooms
- 163 rooms
- 1494 rooms
- 7045 rooms
- 7436 rooms
- 4347 rooms
- 4478 rooms
- 7079+ rooms
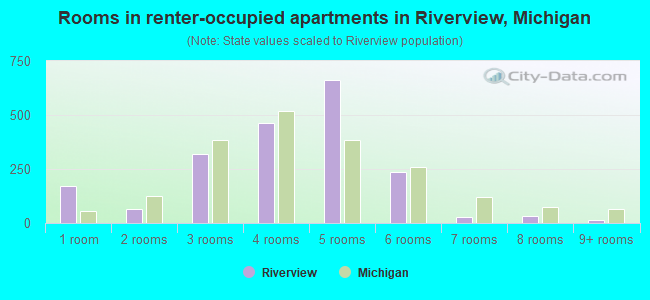
- Rooms in renter-occupied apartments in Riverview, Michigan
- 1701 room
- 642 rooms
- 3183 rooms
- 4634 rooms
- 6605 rooms
- 2346 rooms
- 277 rooms
- 328 rooms
- 169+ rooms
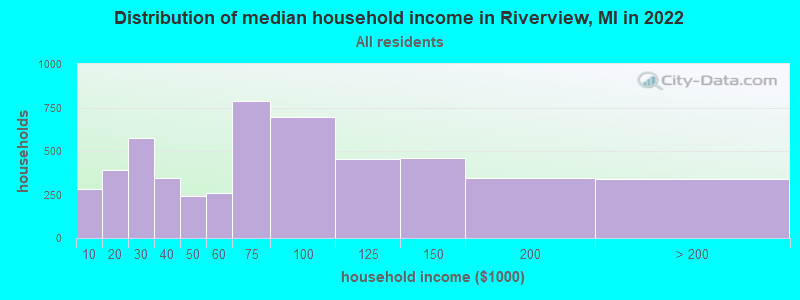
Riverview, MI household income distribution

- 281Less than $10,000
- 391$10,000 to $19,999
- 572$20,000 to $29,999
- 343$30,000 to $39,999
- 239$40,000 to $49,999
- 256$50,000 to $59,999
- 787$60,000 to $74,999
- 697$75,000 to $99,999
- 456$100,000 to $124,999
- 459$125,000 to $149,999
- 345$150,000 to $199,999
- 341$200,000 or more
Home value of owner - occupied houses in 2022 in Riverview, MI
-
- 10$10,000 to $14,999
- 13$20,000 to $24,999
- 43$30,000 to $34,999
- 14$35,000 to $39,999
- 9$40,000 to $49,999
- 26$50,000 to $59,999
- 18$60,000 to $69,999
- 37$70,000 to $79,999
- 61$90,000 to $99,999
- 217$100,000 to $124,999
- 283$125,000 to $149,999
- 663$150,000 to $174,999
- 390$175,000 to $199,999
- 754$200,000 to $249,999
- 523$250,000 to $299,999
- 204$300,000 to $399,999
- 122$400,000 to $499,999
- 2$2,000,000 or more
Rent paid by renters in 2022 in Riverview, MI
-
- 50Less than $100
- 10$150 to $199
- 17$250 to $299
- 24$300 to $349
- 93$400 to $449
- 55$450 to $499
- 480$500 to $549
- 29$600 to $649
- 20$650 to $699
- 5$700 to $749
- 83$750 to $799
- 130$800 to $899
- 344$900 to $999
- 238$1,000 to $1,249
- 133$1,250 to $1,499
- 137$1,500 to $1,999
- 3$2,500 to $2,999
- 7$3,500 or more
- 100No cash rent
Percentage of workers working in this county: 82.3%
Number of people working at home: 738 (13.2% of all workers)
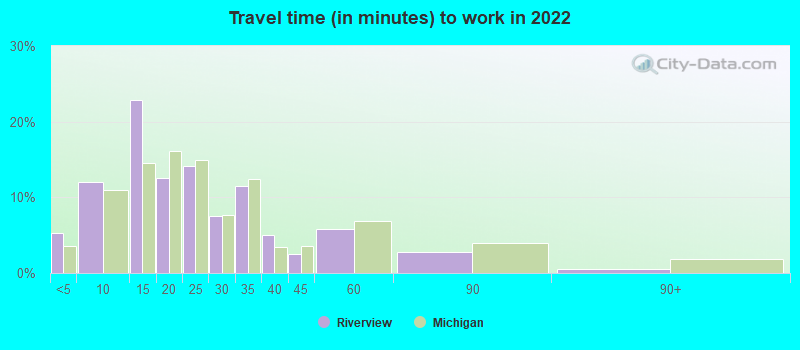
Travel time to work (commute)
- Less than 5 minutes: 209
- 5 to 9 minutes: 919
- 10 to 14 minutes: 547
- 15 to 19 minutes: 464
- 20 to 24 minutes: 442
- 25 to 29 minutes: 649
- 30 to 34 minutes: 660
- 35 to 39 minutes: 107
- 40 to 44 minutes: 68
- 45 to 59 minutes: 595
- 60 to 89 minutes: 152
- 90 or more minutes: 93
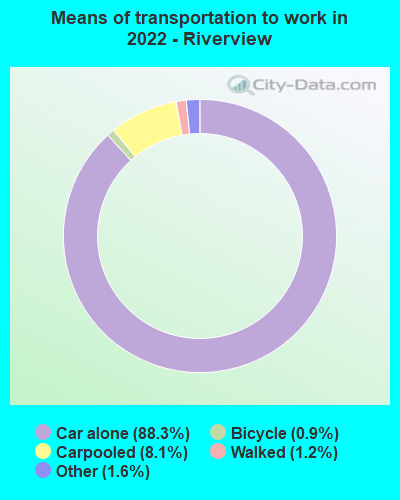
Means of transportation to work:
- Drove a car alone: 3,047 (73.8%)
- Carpooled: 275 (6.7%)
- Taxi: 59 (1.4%)
- Bicycle: 34 (0.8%)
- Walked: 44 (1.1%)
- Worked at home: 738 (17.9%)
- Unemployment by race in 2022
- Unemployment rate for White non-Hispanic residents
- 1.4%Males
- 2.7%Females
- Unemployment rate for other race residents
- 8.5%Males
- Unemployment rate for two or more race residents
- 14.1%Males
- Unemployment rate for Hispanic or Latino residents
- 2.1%Males
- 15.4%Females
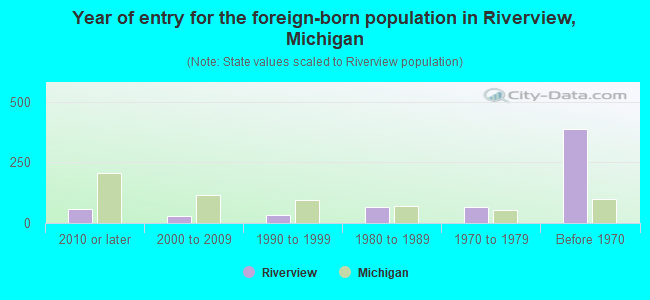
- Year of entry for the foreign-born population in Riverview, Michigan
- 562010 or later
- 302000 to 2009
- 341990 to 1999
- 661980 to 1989
- 671970 to 1979
- 387Before 1970
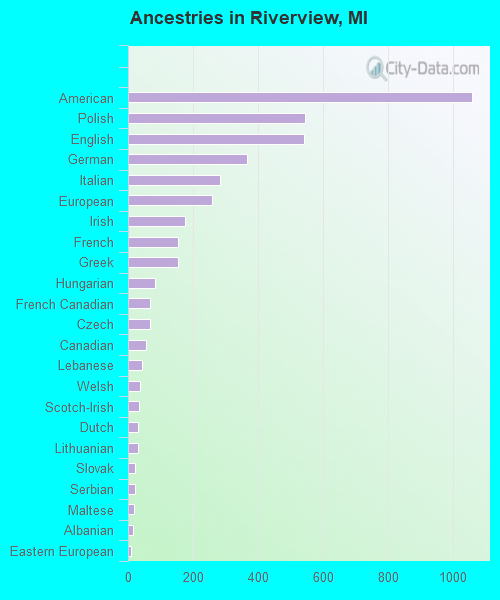
First ancestries reported:
- American: 1,058 (18.9%)
- Polish: 545 (9.8%)
- English: 541 (9.7%)
- German: 366 (6.5%)
- Italian: 282 (5.0%)
- European: 259 (4.6%)
- Irish: 176 (3.1%)
- French: 155 (2.8%)
- Greek: 154 (2.8%)
- Hungarian: 82 (1.5%)
- French Canadian: 69 (1.2%)
- Czech: 68 (1.2%)
- Canadian: 54 (1.0%)
- Lebanese: 44 (0.8%)
- Welsh: 38 (0.7%)
- Scotch-Irish: 33 (0.6%)
- Dutch: 31 (0.6%)
- Lithuanian: 31 (0.6%)
- Slovak: 23 (0.4%)
- Serbian: 21 (0.4%)
- Maltese: 19 (0.3%)
- Albanian: 14 (0.3%)
- Eastern European: 10 (0.2%)
- Finnish: 8 (0.1%)
- Russian: 8 (0.1%)
- Scottish: 7 (0.1%)
- Norwegian: 6 (0.1%)
- British: 4 (0.07%)
- Yugoslavian: 2 (0.04%)
Most common places of birth for foreign-born residents (%):
| Riverview: | 21.6% (100) |
| Michigan: | 0.4% (2,721) |
| Riverview: | 10.8% (50) |
| Michigan: | 3.7% (25,634) |
| Riverview: | 9.7% (45) |
| Michigan: | 3.1% (21,538) |
| Riverview: | 9.1% (42) |
| Michigan: | 11.1% (77,240) |
| Riverview: | 8.8% (41) |
| Michigan: | 0.9% (6,424) |
| Riverview: | 7.1% (33) |
| Michigan: | 4.9% (34,295) |
| Riverview: | 5.4% (25) |
| Michigan: | 1.6% (10,857) |
| Riverview: | 4.7% (22) |
| Michigan: | 0.3% (1,871) |
| Riverview: | 4.3% (20) |
| Michigan: | 10.9% (75,965) |
| Riverview: | 4.1% (19) |
| Michigan: | 0.6% (3,969) |
| Riverview: | 3.7% (17) |
| Michigan: | 2.8% (19,112) |
| Riverview: | 3.0% (14) |
| Michigan: | 0.6% (4,087) |
| Riverview: | 3.0% (14) |
| Michigan: | 0.1% (894) |
| Riverview: | 2.6% (12) |
| Michigan: | 1.9% (12,910) |
| Riverview: | 2.2% (10) |
| Michigan: | 2.3% (16,126) |
| Riverview: | 1.7% (8) |
| Michigan: | 5.0% (35,052) |
| Riverview: | 1.5% (7) |
| Michigan: | 0.9% (6,481) |
Place of birth for U.S.-born residents:
- This state: 10,338
- Other state: 1,363
- Northeast: 166
- Midwest: 541
- South: 569
- West: 74
91.2% of Riverview residents lived in the same house 1 years ago.
Out of people who lived in different houses, 42.9% lived in this county.
Out of people who lived in different counties, 86.1% lived in Michigan.
| Riverview: | 91.2% |
| State average: | 88.4% |
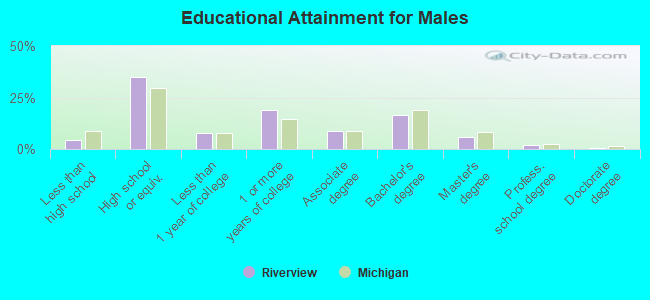
Education attainment for males 25 years and older:
- No schooling: 78
- Nursery to 4th grade: 0
- 5th and 6th grade: 7
- 7th and 8th grade: 0
- 9th grade: 7
- 10th grade: 37
- 11th grade: 37
- 12th grade, no diploma: 7
- High school graduate (or equivalency): 1,396
- Less than 1 year of college: 316
- Some college more than 1 year, no degree: 758
- Associate degree: 356
- Bachelor's degree: 664
- Master's degree: 235
- Professional school degree: 87
- Doctorate degree: 18
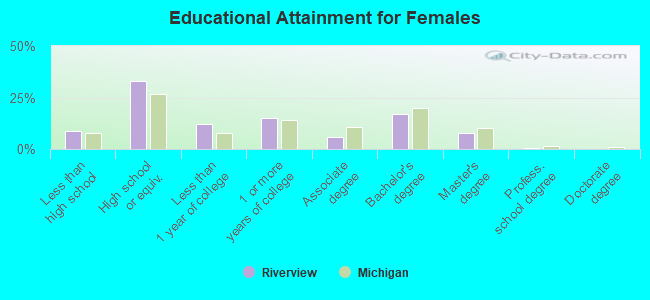
Education attainment for females 25 years and older:
- No schooling: 92
- Nursery to 4th grade: 0
- 5th and 6th grade: 4
- 7th and 8th grade: 77
- 9th grade: 41
- 10th grade: 23
- 11th grade: 53
- 12th grade, no diploma: 127
- High school graduate (or equivalency): 1,567
- Less than 1 year of college: 572
- Some college more than 1 year, no degree: 703
- Associate degree: 280
- Bachelor's degree: 806
- Master's degree: 379
- Professional school degree: 13
- Doctorate degree: 0


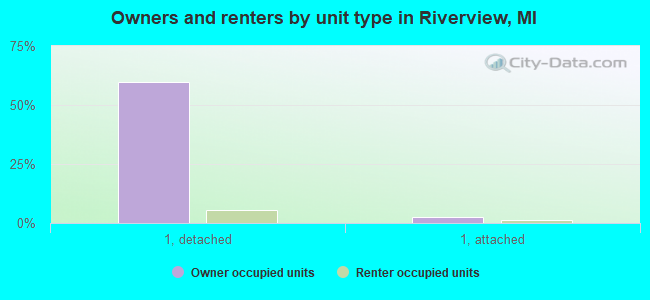
Housing units in structures:
- One, detached: 3,444
- One, attached: 188
- Two: 44
- 3 or 4: 132
- 5 to 9: 449
- 10 to 19: 172
- 20 to 49: 60
- 50 or more: 949
- Mobile homes: 15
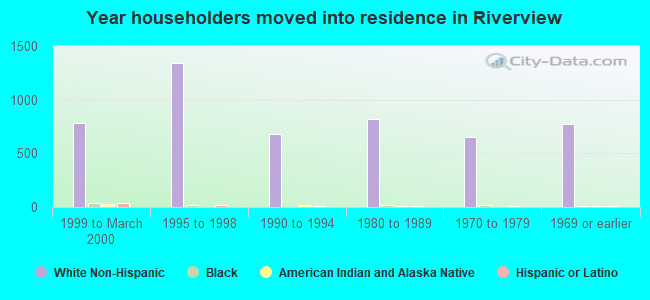
House/condo owner moved in on average 15 years ago
Renter moved in on average 6 years ago
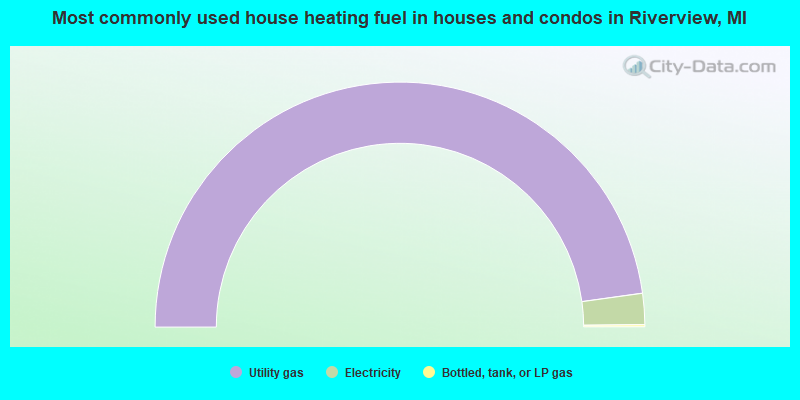
- 95.5%Utility gas
- 4.1%Electricity
- 0.3%Bottled, tank, or LP gas
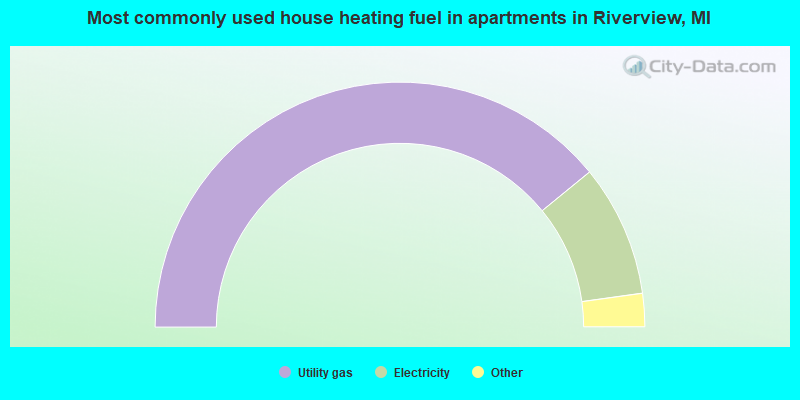
- 78.2%Utility gas
- 17.4%Electricity
- 2.3%No fuel used
- 1.7%Bottled, tank, or LP gas
- 0.3%Other fuel
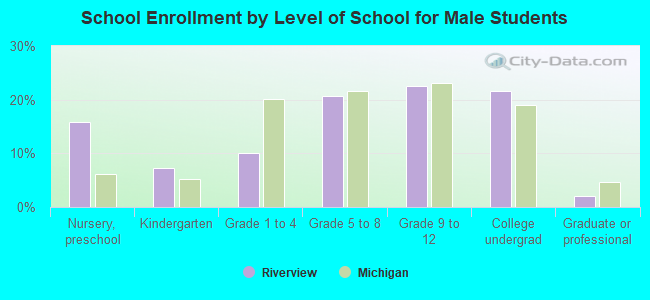
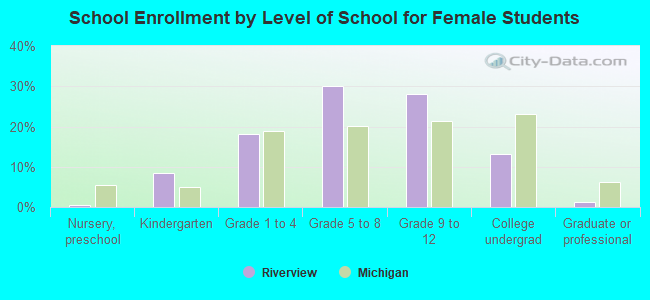
Private vs. public school enrollment:
| Here: | 0.0% |
| Michigan: | 12.4% |
| Here: | 0.0% |
| Michigan: | 9.8% |
| Here: | 8.6% |
| Michigan: | 14.9% |