Rosenberg, TX (Texas) Houses and Residents
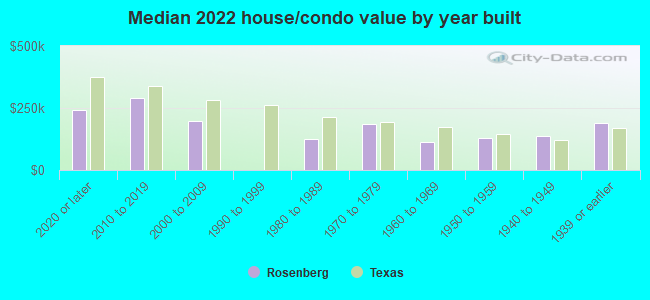
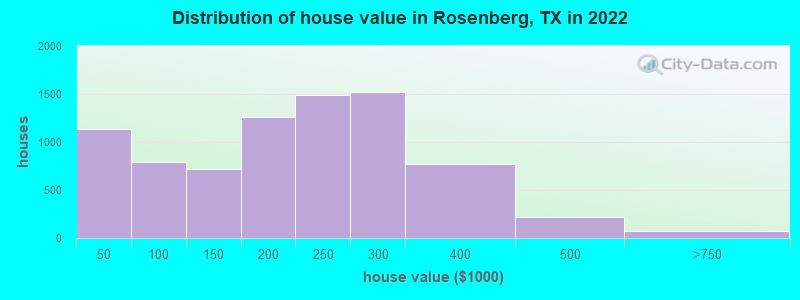
Estimated median house or condo value in 2022: $222,310 (it was $63,500 in 2000 )
Rosenberg:
$222,310Texas:
$275,400
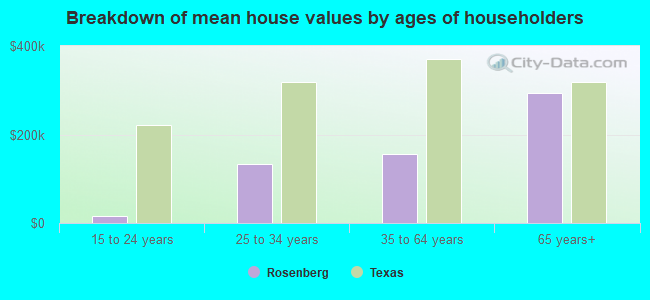
Lower value quartile - upper value quartile: $139,726 - $284,706Mean price in 2022: Detached houses: $210,513 Here:
$210,513State:
$369,058
Townhouses or other attached units: $301,855 Here:
$301,855State:
$327,631
Mobile homes: $85,557 Here:
$85,557State:
$124,413
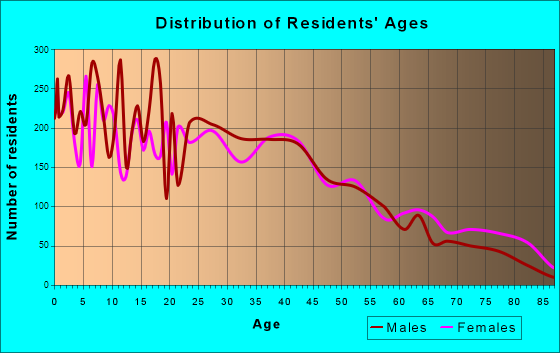
Total population: 34,468 (Urban population: 23,527, Rural population: 648 (4 farm, 644 nonfarm ))
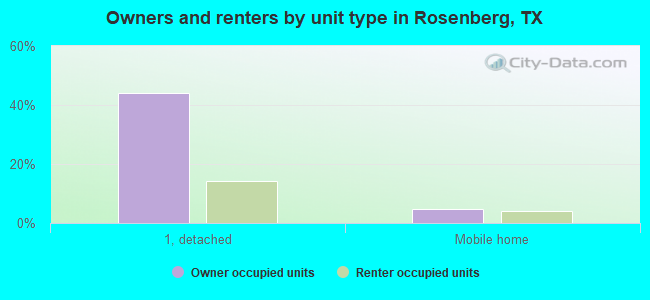
Houses: 16,597 (15,535 occupied: 8,417 owner occupied, 7,251 renter occupied )
% of renters here:
46%State:
38%
Housing density: 781 houses/condos per square mile
Median price asked for vacant for-sale houses and condos in 2022: $276,423.
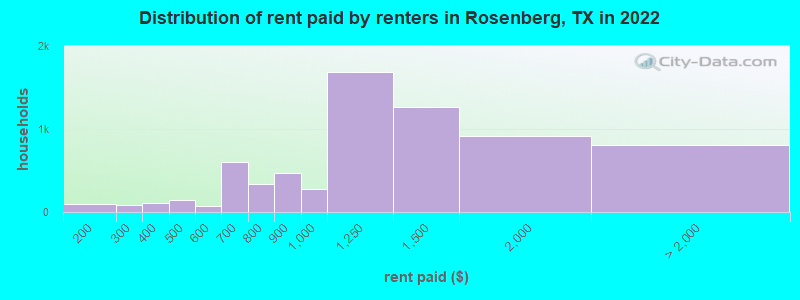
Median contract rent in 2022: $1,124 (lower quartile is $773, upper quartile is $1,412)
Median rent asked for vacant for-rent units in 2022: $1,616
Median gross rent in Rosenberg, TX in 2022: $1,315
Housing units in Rosenberg with a mortgage: 5,122 (62 second mortgage, 0 home equity loan, 72 both second mortgage and home equity loan )Houses without a mortgage: 26
Median household income for houses/condos with a mortgage: $79,897
Median household income for apartments without a mortgage: $72,436
Median monthly housing costs: $1,269
Data:
Median house or condo value ($)
Median house or condo value ($ change since 2000)
Median house or condo value ($) - White
Median house or condo value ($) - Black or African American
Median house or condo value ($) - Asian
Median house or condo value ($) - Hispanic or Latino
Median house or condo value ($) - American Indian and Alaska Native
Median house or condo value ($) - Multirace
Median house or condo value ($) - Other Race
Median price asked for mobile homes ($)
Household density (households per square mile)
Mean house or condo value by units in structure - 1, detached ($)
Mean house or condo value by units in structure - 1, attached ($)
Mean house or condo value by units in structure - 2 ($)
Mean house or condo value by units in structure by units in structure - 3 or 4 ($)
Mean house or condo value by units in structure - 5 or more ($)
Mean house or condo value by units in structure - Boat, RV, van, etc. ($)
Mean house or condo value by units in structure - Mobile home ($)
Median contract rent ($)
Median contract rent - Lower quartile ($)
Median contract rent - Upper quartile ($)
Median gross rent ($)
Urban houses (%)
Rural houses (%)
Houses occupied (%)
Houses occupied (% change since 2000)
Houses owner occupied (%)
Houses owner occupied (% change since 2000)
Houses renter occupied (%)
Houses renter occupied (% change since 2000)
Vacant housing units - For rent (%)
Vacant housing units - For rent (% change since 2000)
Vacant housing units - For sale only (%)
Vacant housing units - For sale only (% change since 2000)
Vacant housing units - Rented or sold, not occupied (%)
Vacant housing units - Rented or sold, not occupied (% change since 2000)
Vacant housing units - For seasonal, recreational, or occasional use (%)
Vacant housing units - For seasonal, recreational, or occasional use (% change since 2000)
Vacant housing units - For migrant workers (%)
Vacant housing units - For migrant workers (% change since 2000)
Vacant housing units - Other vacant (%)
Vacant housing units - Other vacant (% change since 2000)
Median monthly housing costs ($)
Median household income for houses/condos with a mortgage ($)
Median household income for houses/condos without a mortgage ($)
Median household income ($)
Median household income ($) - White
Median household income ($) - Black or African American
Median household income ($) - Asian
Median household income ($) - Hispanic or Latino
Median household income ($) - American Indian and Alaska Native
Median household income ($) - Multirace
Median household income ($) - Other Race
Mortgage status - with mortgage (%)
Mortgage status - with second mortgage (%)
Mortgage status - with home equity loan (%)
Mortgage status - with both second mortgage and home equity loan (%)
Mortgage status - without a mortgage (%)
Median year house/condo built
Median year apartment built
Household type by relationship - Male householder living alone (%)
Household type by relationship - Male householder not living alone (%)
Household type by relationship - Female householder living alone (%)
Household type by relationship - Female householder not living alone (%)
Household type by relationship - Opposite-Sex spouse (%)
Household type by relationship - Same-Sex spouse (%)
Household type by relationship - Opposite-Sex unmarried partner (%)
Household type by relationship - Same-Sex unmarried partner (%)
Household type by relationship - In group quarters (%)
Size of family households - 2-person household (%)
Size of family households - 3-person household (%)
Size of family households - 4-person household (%)
Size of family households - 5-person household (%)
Size of family households - 6-person household (%)
Size of family households - 7-or-more-person household (%)
Size of nonfamily households - 1-person household (%)
Size of nonfamily households - 2-person household (%)
Size of nonfamily households - 3-person household (%)
Size of nonfamily households - 4-person household (%)
Size of nonfamily households - 5-person household (%)
Size of nonfamily households - 6-person household (%)
Size of nonfamily households - 7-or-moreperson household (%)
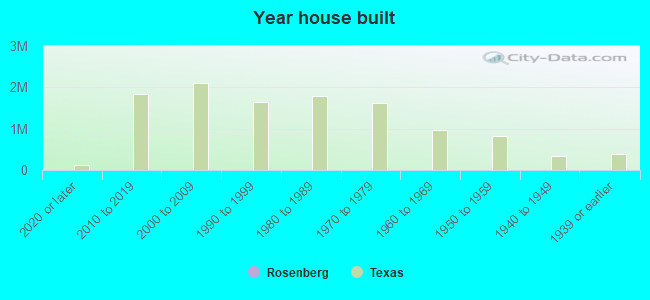
Year house built - Built 2010 or later (%)
Year house built - Built 2000 to 2009 (%)
Year house built - Built 1990 to 1999 (%)
Year house built - Built 1980 to 1989 (%)
Year house built - Built 1970 to 1979 (%)
Year house built - Built 1960 to 1969 (%)
Year house built - Built 1950 to 1959 (%)
Year house built - Built 1940 to 1949 (%)
Year house built - Built 1939 or earlier (%)
Median number of rooms in houses and condos
Median number of rooms in apartments
Median number of bedrooms in owner occupied houses
Mean number of bedrooms in owner occupied houses
Median number of bedrooms in renter occupied houses
Mean number of bedrooms in renter occupied houses
Median number of vehichles in owner occupied houses
Mean number of vehichles in owner occupied houses
Median number of vehichles in renter occupied houses
Mean number of vehichles in renter occupied houses
Rooms in owner-occupied houses - 1 room (%)
Rooms in owner-occupied houses - 2 rooms (%)
Rooms in owner-occupied houses - 3 rooms (%)
Rooms in owner-occupied houses - 4 rooms (%)
Rooms in owner-occupied houses - 5 rooms (%)
Rooms in owner-occupied houses - 6 rooms (%)
Rooms in owner-occupied houses - 7 rooms (%)
Rooms in owner-occupied houses - 8 rooms (%)
Rooms in owner-occupied houses - 9+ rooms (%)
Rooms in renter-occupied houses - 1 room (%)
Rooms in renter-occupied houses - 2 rooms (%)
Rooms in renter-occupied houses - 3 rooms (%)
Rooms in renter-occupied houses - 4 rooms (%)
Rooms in renter-occupied houses - 5 rooms (%)
Rooms in renter-occupied houses - 6 rooms (%)
Rooms in renter-occupied houses - 7 rooms (%)
Rooms in renter-occupied houses - 8 rooms (%)
Rooms in renter-occupied houses - 9+ rooms (%)
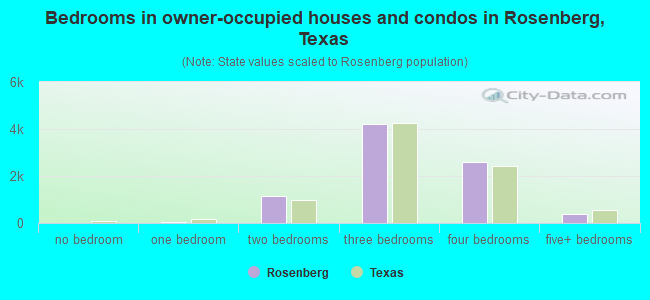
Bedrooms in owner-occupied houses - no bedrooms (%)
Bedrooms in owner-occupied houses - 1 bedroom (%)
Bedrooms in owner-occupied houses - 2 bedrooms (%)
Bedrooms in owner-occupied houses - 3 bedrooms (%)
Bedrooms in owner-occupied houses - 4 bedrooms (%)
Bedrooms in owner-occupied houses - 5+ bedrooms (%)
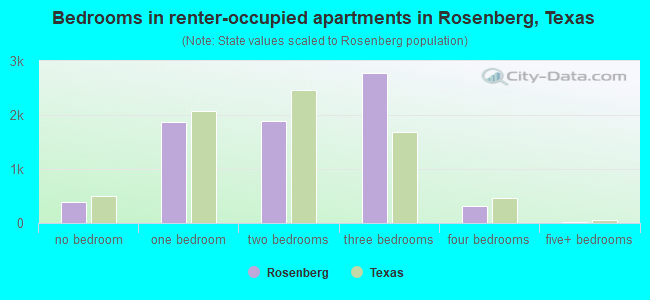
Bedrooms in renter-occupied houses - no bedrooms (%)
Bedrooms in renter-occupied houses - 1 bedroom (%)
Bedrooms in renter-occupied houses - 2 bedrooms (%)
Bedrooms in renter-occupied houses - 3 bedrooms (%)
Bedrooms in renter-occupied houses - 4 bedrooms (%)
Bedrooms in renter-occupied houses - 5+ bedrooms (%)
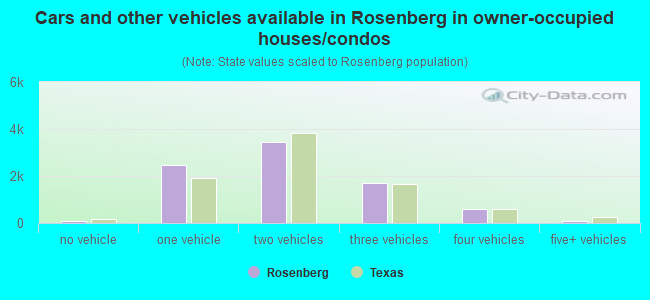
Vehicles available in owner-occupied houses - no vehicle available (%)
Vehicles available in owner-occupied houses - 1 vehicle available(%)
Vehicles available in owner-occupied houses - 2 Vehicles available (%)
Vehicles available in owner-occupied houses - 3 Vehicles available (%)
Vehicles available in owner-occupied houses - 4 Vehicles available (%)
Vehicles available in owner-occupied houses - 5+ Vehicles available (%)
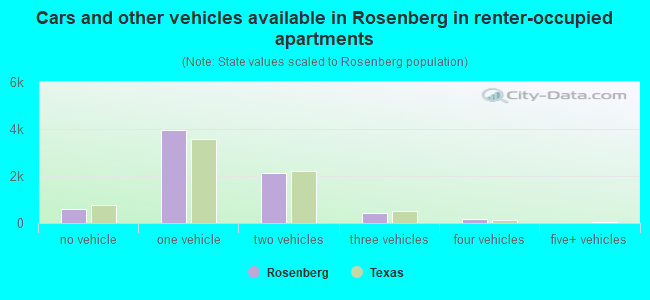
Vehicles available in renter-occupied houses - no vehicle available (%)
Vehicles available in renter-occupied houses - 1 vehicle available (%)
Vehicles available in renter-occupied houses - 2 Vehicles available (%)
Vehicles available in renter-occupied houses - 3 Vehicles available (%)
Vehicles available in renter-occupied houses - 4 Vehicles available (%)
Vehicles available in renter-occupied houses - 5+ Vehicles available (%)
Housing units in structures - 1, detached (%)
Housing units in structures - 1, attached (%)
Housing units in structures - 2 (%)
Housing units in structures - 3 or 4 (%)
Housing units in structures - 5 to 9 (%)
Housing units in structures - 10 to 19 (%)
Housing units in structures - 20 to 49 (%)
Housing units in structures - 50 or more (%)
Housing units in structures - Mobile home (%)
Housing units in structures - Boat, RV, van, etc. (%)
Housing units in structures - Owners - 1, detached (%)
Housing units in structures - Owners - 1, attached (%)
Housing units in structures - Owners - 2 (%)
Housing units in structures - Owners - 3 or 4 (%)
Housing units in structures - Owners - 5 to 9 (%)
Housing units in structures - Owners - 10 to 19 (%)
Housing units in structures - Owners - 20 to 49 (%)
Housing units in structures - Owners - 50 or more (%)
Housing units in structures - Owners - Mobile home (%)
Housing units in structures - Owners - Boat, RV, van, etc. (%)
Housing units in structures - Renters - 1, detached (%)
Housing units in structures - Renters - 1, attached (%)
Housing units in structures - Renters - 2 (%)
Housing units in structures - Renters - 3 or 4 (%)
Housing units in structures - Renters - 5 to 9 (%)
Housing units in structures - Renters - 10 to 19 (%)
Housing units in structures - Renters - 20 to 49 (%)
Housing units in structures - Renters - 50 or more (%)
Housing units in structures - Renters - Mobile home (%)
Housing units in structures - Renters - Boat, RV, van, etc. (%)
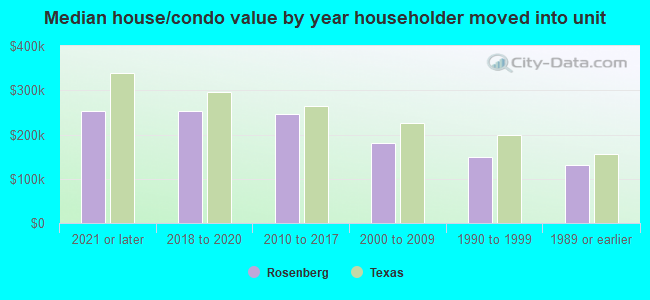
House/condo owner moved in on average (years ago)
Renter moved in on average (years ago)
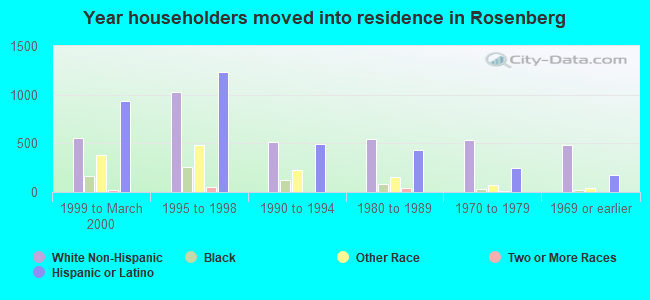
Year householder moved into unit - Moved in 1999 to March 2000 (%)
Year householder moved into unit - Moved in 1999 to March 2000 (%) - White
Year householder moved into unit - Moved in 1999 to March 2000 (%) - Black or African American
Year householder moved into unit - Moved in 1999 to March 2000 (%) - Asian
Year householder moved into unit - Moved in 1999 to March 2000 (%) - Hispanic or Latino
Year householder moved into unit - Moved in 1999 to March 2000 (%) - American Indian and Alaska Native
Year householder moved into unit - Moved in 1999 to March 2000 (%) - Multirace
Year householder moved into unit - Moved in 1999 to March 2000 (%) - Other Race
Year householder moved into unit - Moved in 1995 to 1998 (%)
Year householder moved into unit - Moved in 1995 to 1998 (%) - White
Year householder moved into unit - Moved in 1995 to 1998 (%) - Black or African American
Year householder moved into unit - Moved in 1995 to 1998 (%) - Asian
Year householder moved into unit - Moved in 1995 to 1998 (%) - Hispanic or Latino
Year householder moved into unit - Moved in 1995 to 1998 (%) - American Indian and Alaska Native
Year householder moved into unit - Moved in 1995 to 1998 (%) - Multirace
Year householder moved into unit - Moved in 1995 to 1998 (%) - Other Race
Year householder moved into unit - Moved in 1990 to 1994 (%)
Year householder moved into unit - Moved in 1990 to 1994 (%) - White
Year householder moved into unit - Moved in 1990 to 1994 (%) - Black or African American
Year householder moved into unit - Moved in 1990 to 1994 (%) - Asian
Year householder moved into unit - Moved in 1990 to 1994 (%) - Hispanic or Latino
Year householder moved into unit - Moved in 1990 to 1994 (%) - American Indian and Alaska Native
Year householder moved into unit - Moved in 1990 to 1994 (%) - Multirace
Year householder moved into unit - Moved in 1990 to 1994 (%) - Other Race
Year householder moved into unit - Moved in 1980 to 1989 (%)
Year householder moved into unit - Moved in 1980 to 1989 (%) - White
Year householder moved into unit - Moved in 1980 to 1989 (%) - Black or African American
Year householder moved into unit - Moved in 1980 to 1989 (%) - Asian
Year householder moved into unit - Moved in 1980 to 1989 (%) - Hispanic or Latino
Year householder moved into unit - Moved in 1980 to 1989 (%) - American Indian and Alaska Native
Year householder moved into unit - Moved in 1980 to 1989 (%) - Multirace
Year householder moved into unit - Moved in 1980 to 1989 (%) - Other Race
Year householder moved into unit - Moved in 1970 to 1979 (%)
Year householder moved into unit - Moved in 1970 to 1979 (%) - White
Year householder moved into unit - Moved in 1970 to 1979 (%) - Black or African American
Year householder moved into unit - Moved in 1970 to 1979 (%) - Asian
Year householder moved into unit - Moved in 1970 to 1979 (%) - Hispanic or Latino
Year householder moved into unit - Moved in 1970 to 1979 (%) - American Indian and Alaska Native
Year householder moved into unit - Moved in 1970 to 1979 (%) - Multirace
Year householder moved into unit - Moved in 1970 to 1979 (%) - Other Race
Year householder moved into unit - Moved in 1969 or earlier (%)
Year householder moved into unit - Moved in 1969 or earlier (%) - White
Year householder moved into unit - Moved in 1969 or earlier (%) - Black or African American
Year householder moved into unit - Moved in 1969 or earlier (%) - Asian
Year householder moved into unit - Moved in 1969 or earlier (%) - Hispanic or Latino
Year householder moved into unit - Moved in 1969 or earlier (%) - American Indian and Alaska Native
Year householder moved into unit - Moved in 1969 or earlier (%) - Multirace
Year householder moved into unit - Moved in 1969 or earlier (%) - Other Race
Housing units lacking complete plumbing facilities (%)
Housing units lacking complete kitchen facilities (%)
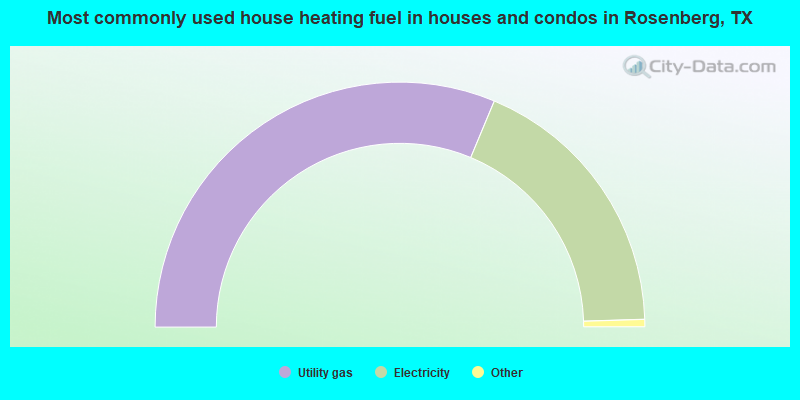
House heating fuel used in houses and condos - Utility gas (%)
House heating fuel used in houses and condos - Bottled, tank, or LP gas (%)
House heating fuel used in houses and condos - Electricity (%)
House heating fuel used in houses and condos - Fuel oil, kerosene, etc. (%)
House heating fuel used in houses and condos - Coal or coke (%)
House heating fuel used in houses and condos - Wood (%)
House heating fuel used in houses and condos - Solar energy (%)
House heating fuel used in houses and condos - Other fuel (%)
House heating fuel used in houses and condos - No fuel used (%)
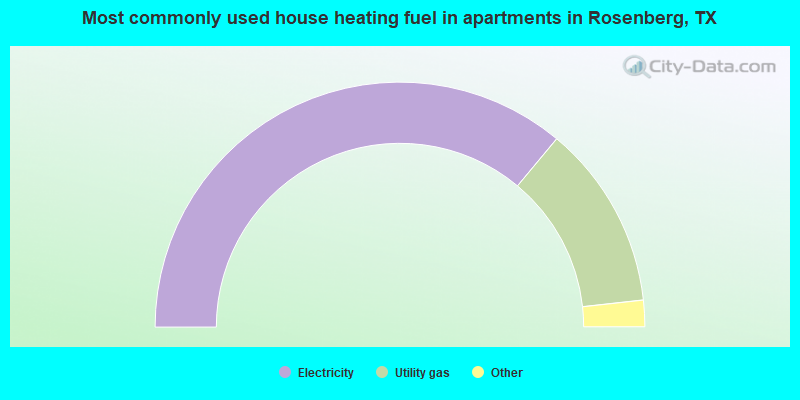
House heating fuel used in apartments - Utility gas (%)
House heating fuel used in apartments - Bottled, tank, or LP gas (%)
House heating fuel used in apartments - Electricity (%)
House heating fuel used in apartments - Fuel oil, kerosene, etc. (%)
House heating fuel used in apartments - Coal or coke (%)
House heating fuel used in apartments - Wood (%)
House heating fuel used in apartments - Solar energy (%)
House heating fuel used in apartments - Other fuel (%)
House heating fuel used in apartments - No fuel used (%)
Latest news about housing in Rosenberg, TX collected exclusively by city-data.com from local newspapers, TV, and radio stations
Median year house/condo built: 2005Median year apartment built: 1989Household type by relationship:
Households: 41,351
Male householders: 7,875 (2,713 living alone ), Female householders: 7,442 (1,810 living alone )6,782 spouses (6,782 opposite-sex spouses ), 950 unmarried partners , (850 opposite-sex unmarried partners ), 12,382 children (11,462 natural , 149 adopted , 769 stepchildren ), 1,721 grandchildren , 832 brothers or sisters , 1,196 parents , 0 foster children , 958 other relatives , 978 non-relatives In group quarters: 230
Size of family households: 3,396 2-persons , 2,881 3-persons , 1,748 4-persons , 1,587 5-persons , 351 6-persons , 399 7-or-more-persons .
Size of nonfamily households: 4,904 1-person , 444 2-persons , 324 3-persons .
4,485 married couples with children. single-parent households (571 men , 3,197 women ).
52.1% of residents of Rosenberg speak English at home. of residents speak Spanish at home (63% speak English very well , 18% speak English well , 12% speak English not well , 7% don't speak English at all ).of residents speak other Indo-European language at home (71% speak English very well , 19% speak English well , 2% speak English not well , 8% don't speak English at all ).of residents speak Asian or Pacific Island language at home (54% speak English very well , 27% speak English well , 19% speak English not well ).of residents speak other language at home (85% speak English very well , 15% speak English well ).
Foreign born population: 10,110 (24.4%)of them are naturalized citizens )
Median number of rooms in houses and condos:
Median number of rooms in apartments
Owner-occupied Renter-occupied
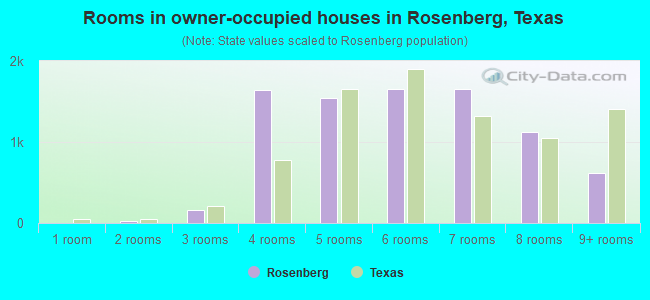
Rooms in owner-occupied houses in Rosenberg, Texas
0 1 room 20 2 rooms 159 3 rooms 1,641 4 rooms 1,549 5 rooms 1,653 6 rooms 1,654 7 rooms 1,122 8 rooms 620 9+ rooms
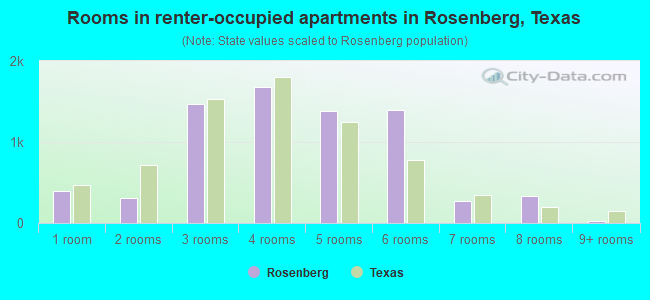
Rooms in renter-occupied apartments in Rosenberg, Texas
392 1 room 305 2 rooms 1,464 3 rooms 1,681 4 rooms 1,387 5 rooms 1,390 6 rooms 275 7 rooms 336 8 rooms 21 9+ rooms
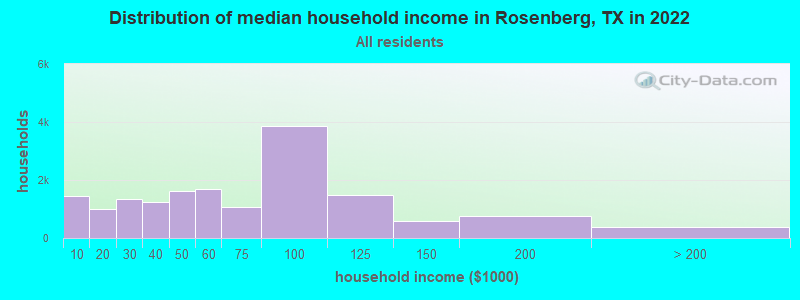
Rosenberg, TX household income distribution 1,450 Less than $10,0001,016 $10,000 to $19,9991,339 $20,000 to $29,9991,249 $30,000 to $39,9991,624 $40,000 to $49,9991,684 $50,000 to $59,9991,069 $60,000 to $74,9993,877 $75,000 to $99,9991,487 $100,000 to $124,999592 $125,000 to $149,999758 $150,000 to $199,999371 $200,000 or more
Home value of owner - occupied houses in 2022 in Rosenberg, TX 483 Less than $10,00075 $10,000 to $14,99919 $15,000 to $19,99979 $20,000 to $24,999241 $25,000 to $29,99929 $30,000 to $34,99948 $35,000 to $39,999161 $40,000 to $49,99924 $50,000 to $59,999119 $60,000 to $69,999183 $70,000 to $79,999252 $80,000 to $89,99955 $90,000 to $99,999526 $100,000 to $124,999193 $125,000 to $149,999792 $150,000 to $174,999468 $175,000 to $199,9991,488 $200,000 to $249,9991,522 $250,000 to $299,999773 $300,000 to $399,999221 $400,000 to $499,99968 $500,000 to $749,999Rent paid by renters in 2022 in Rosenberg, TX 70 $100 to $14925 $150 to $19953 $200 to $24929 $250 to $29958 $300 to $34949 $350 to $399144 $400 to $44913 $500 to $54954 $550 to $599436 $600 to $649172 $650 to $699204 $700 to $749128 $750 to $799473 $800 to $899281 $900 to $9991,683 $1,000 to $1,2491,262 $1,250 to $1,499915 $1,500 to $1,99979 $2,000 to $2,499732 No cash rent
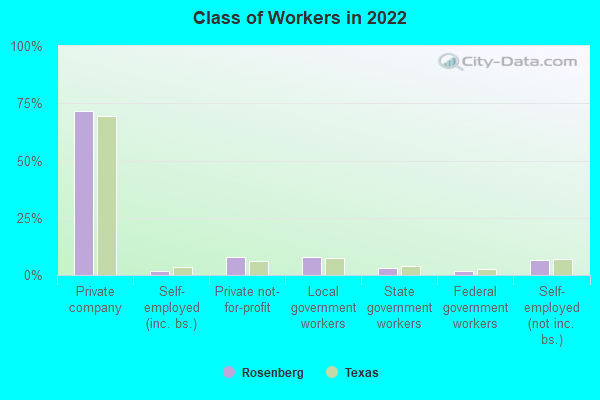
Percentage of workers working in this county: 70.9%Number of people working at home: 1,661 (8.1% of all workers )
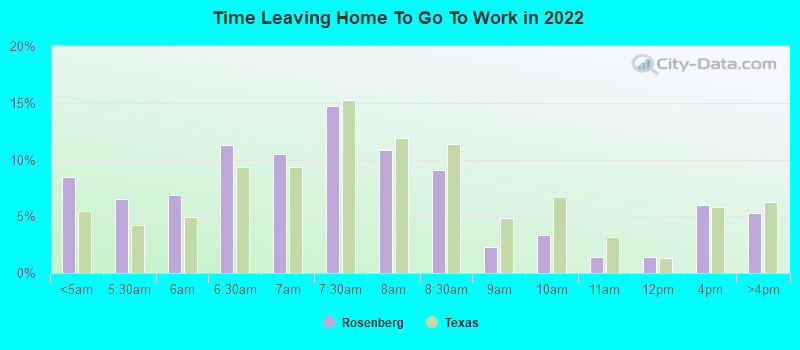
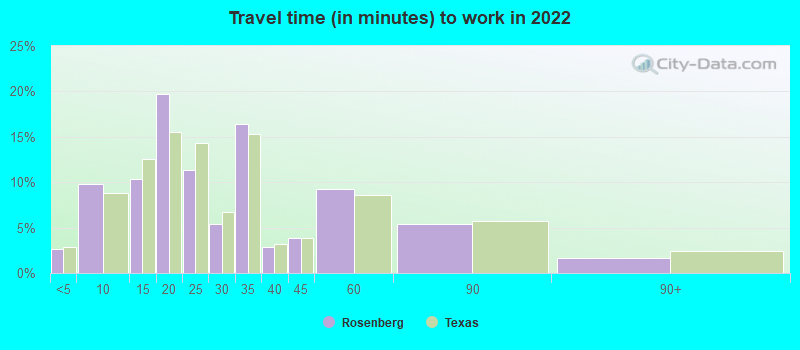
Travel time to work (commute)
Less than 5 minutes: 5315 to 9 minutes: 1,74810 to 14 minutes: 1,75515 to 19 minutes: 2,49720 to 24 minutes: 1,52025 to 29 minutes: 75630 to 34 minutes: 3,11535 to 39 minutes: 71840 to 44 minutes: 1,34245 to 59 minutes: 2,73560 to 89 minutes: 1,23690 or more minutes: 238
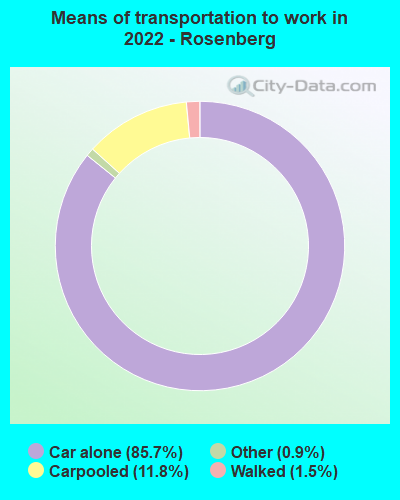
Means of transportation to work:
Drove a car alone: 15,698 (75.1%)Carpooled: 2,542 (12.2%)Taxi: 208 (1.0%)Bicycle: 8 (0.0%)Walked: 373 (1.8%)Worked at home: 1,661 (7.9%)
Unemployment by race in 2022
Unemployment rate for White non-Hispanic residents 0.6% Males2.3% FemalesUnemployment rate for Black residents 4.3% FemalesUnemployment rate for Asian residents 1.6% FemalesUnemployment rate for other race residents 0.5% Males0.5% FemalesUnemployment rate for two or more race residents 2.7% Males11.7% FemalesUnemployment rate for Hispanic or Latino residents 1.5% Males9.0% Females
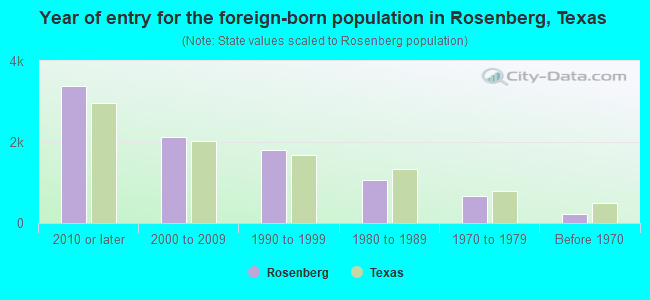
Year of entry for the foreign-born population in Rosenberg, Texas
3,375 2010 or later 2,135 2000 to 2009 1,812 1990 to 1999 1,072 1980 to 1989 656 1970 to 1979 223 Before 1970
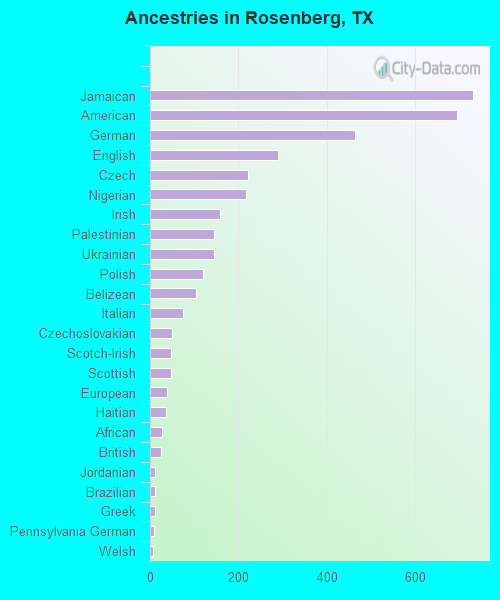
First ancestries reported:
Jamaican: 731 (2.5%)
American: 694 (2.4%)
German: 465 (1.6%)
English: 289 (1.0%)
Czech: 222 (0.8%)
Nigerian: 217 (0.8%)
Irish: 158 (0.5%)
Palestinian: 145 (0.5%)
Ukrainian: 145 (0.5%)
Polish: 121 (0.4%)
Belizean: 104 (0.4%)
Italian: 75 (0.3%)
Czechoslovakian: 49 (0.2%)
Scotch-Irish: 48 (0.2%)
Scottish: 47 (0.2%)
European: 38 (0.1%)
Haitian: 36 (0.1%)
African: 27 (0.09%)
British: 24 (0.08%)
Jordanian: 12 (0.04%)
Brazilian: 12 (0.04%)
Greek: 12 (0.04%)
Pennsylvania German: 9 (0.03%)
Welsh: 7 (0.02%)
Norwegian: 5 (0.02%)
Swedish: 5 (0.02%)
French: 4 (0.01%)
Northern European: 4 (0.01%) Most common places of birth for foreign-born residents (%): Mexico Rosenberg:
37.4% (3,639)Texas:
48.4% (2,411,723)
Philippines Rosenberg:
16.3% (1,590)Texas:
2.1% (103,148)
Venezuela Rosenberg:
7.6% (736)Texas:
1.5% (72,413)
El Salvador Rosenberg:
5.7% (556)Texas:
4.5% (224,455)
Dominican Republic Rosenberg:
5.1% (494)Texas:
0.3% (13,763)
Jamaica Rosenberg:
3.9% (380)Texas:
0.4% (17,748)
Pakistan Rosenberg:
3.7% (363)Texas:
1.2% (62,159)
Vietnam Rosenberg:
3.7% (360)Texas:
3.7% (184,770)
Colombia Rosenberg:
3.3% (319)Texas:
1.2% (61,555)
Honduras Rosenberg:
2.2% (212)Texas:
3.0% (147,182)
Nigeria Rosenberg:
1.9% (184)Texas:
1.9% (96,110)
Ecuador Rosenberg:
1.6% (160)Texas:
0.2% (12,456)
Place of birth for U.S.-born residents:
This state: 24,775Other state: 5,694Northeast: 1,026Midwest: 1,590South: 1,773West: 1,309 87.0% of Rosenberg residents lived in the same house 1 years ago.
Out of people who lived in different houses, 35.9% lived in this county.
Out of people who lived in different counties, 58.9% lived in Texas.
Rosenberg:
87.0%State average:
85.7%
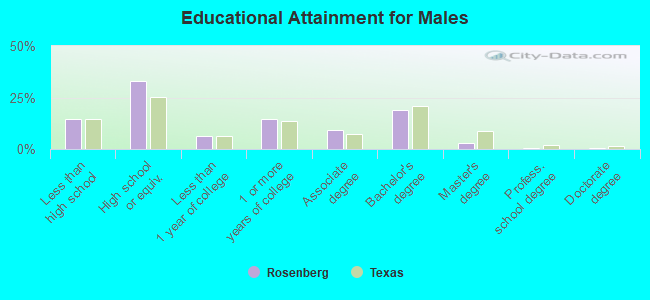
Education attainment for males 25 years and older:
No schooling: 242Nursery to 4th grade: 685th and 6th grade: 3787th and 8th grade: 969th grade: 18510th grade: 23611th grade: 24412th grade, no diploma: 391High school graduate (or equivalency): 4,174Less than 1 year of college: 791Some college more than 1 year, no degree: 1,858Associate degree: 1,169Bachelor's degree: 2,367Master's degree: 351Professional school degree: 48Doctorate degree: 40
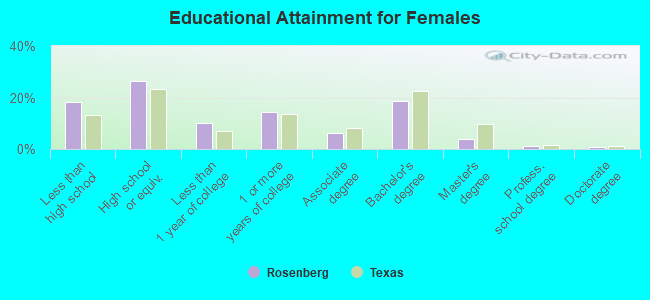
Education attainment for females 25 years and older:
No schooling: 428Nursery to 4th grade: 585th and 6th grade: 4987th and 8th grade: 1119th grade: 22510th grade: 33011th grade: 42712th grade, no diploma: 108High school graduate (or equivalency): 3,210Less than 1 year of college: 1,224Some college more than 1 year, no degree: 1,745Associate degree: 752Bachelor's degree: 2,237Master's degree: 488Professional school degree: 144Doctorate degree: 103
Housing units in structures:
One, detached: 10,143One, attached: 732Two: 1873 or 4: 1,0915 to 9: 90510 to 19: 91820 to 49: 63950 or more: 620Mobile homes: 1,359Median worth of mobile homes: $27,578
Housing units lacking complete plumbing facilities in 2022: 2.8%Housing units lacking complete kitchen facilities in 2022: 2.0%House/condo owner moved in on average 8 years ago
Renter moved in on average 3 years ago
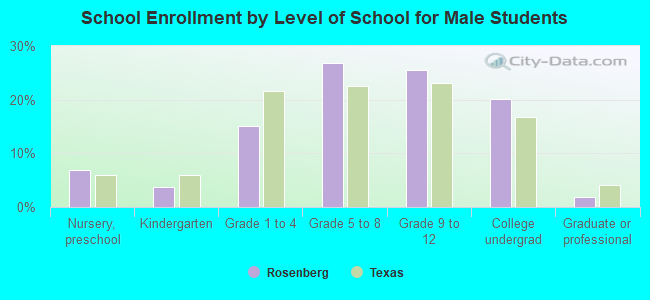
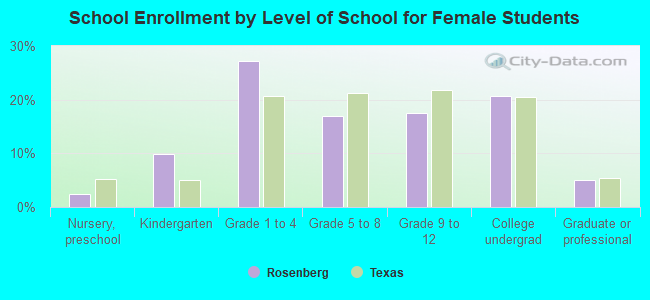
Private vs. public school enrollment:
Students in private schools in grades 1 to 8 (elementary and middle school): 275 Students in private schools in grades 9 to 12 (high school): 87 Students in private undergraduate colleges: 103