South Houston, TX (Texas) Houses and Residents
| South Houston: | $163,808 |
| Texas: | $275,400 |
Total population: 17,536 (Urban population: 15,713, Rural population: 0)
Houses: 5,618 (4,993 occupied: 2,628 owner occupied, 2,440 renter occupied)
| % of renters here: | 48% |
| State: | 38% |
Housing density: 1,856 houses/condos per square mile
Median price asked for vacant for-sale houses and condos in 2022 in this county: $417,614.
Median contract rent in 2022: $925 (lower quartile is $755, upper quartile is $1,154)
Median rent asked for vacant for-rent units in 2022: $770
Median gross rent in South Houston, TX in 2022: $1,147
Housing units in South Houston with a mortgage: 1,067 (35 second mortgage, 0 home equity loan, 28 both second mortgage and home equity loan)
Houses without a mortgage: 3
Median household income for houses/condos with a mortgage: $81,227
Median household income for apartments without a mortgage: $49,188
Median monthly housing costs: $1,049
Compare current foreclosures near South Houston, TX:
| Photo | Address | Area | Beds / Baths | Price | Details |
|---|---|---|---|---|---|

|
#1
Avenue G
South Houston, TX 77587
|
977 sq. feet
|
1 baths 3 beds |
show details | |

|
#2
Avenue L
South Houston, TX 77587
|
1,752 sq. feet
|
1 baths 3 beds |
show details | |

|
#3
Spencer Hwy
South Houston, TX 77587
|
- sq. feet
|
- baths - beds |
show details | |

|
#4
Indiana St, Trlr 17
South Houston, TX 77587
|
- sq. feet
|
- baths - beds |
show details | |

|
#5
Arkansas St
South Houston, TX 77587
|
- sq. feet
|
- baths - beds |
show details | |

|
#6
Oregon St
South Houston, TX 77587
|
- sq. feet
|
- baths - beds |
show details | |

|
#7
Briley St
Houston, TX 77004
|
3,256 sq. feet
|
2 baths 4 beds |
$280,800
|
show details |

|
#8
Briarhurst Dr Apt 35
Houston, TX 77057
|
1,092 sq. feet
|
2 baths 2 beds |
$174,900
|
show details |

|
#9
Creekview Dr
La Porte, TX 77571
|
2,986 sq. feet
|
2 baths 3 beds |
$169,900
|
show details |

|
#10
Park Dr
Channelview, TX 77530
|
2,946 sq. feet
|
3 baths 3 beds |
show details |
| Photo | Address | Area | Beds / Baths | Price | Details |
|---|---|---|---|---|---|

|
#11
Bringhurst St
Houston, TX 77020
|
- sq. feet
|
2 baths 2 beds |
show details | |

|
#12
Glenvalley Dr
La Porte, TX 77571
|
1,775 sq. feet
|
2 baths 2 beds |
show details | |

|
#13
N Heron Dr
Seabrook, TX 77586
|
1,925 sq. feet
|
2 baths 3 beds |
show details | |

|
#14
Alderson St
Houston, TX 77015
|
- sq. feet
|
3 baths 3 beds |
show details | |

|
#15
Larkspur St
Houston, TX 77051
|
1,038 sq. feet
|
1 baths 3 beds |
show details | |

|
#16
Belmark St
Houston, TX 77033
|
1,318 sq. feet
|
2 baths 3 beds |
show details | |

|
#17
Arce Rojo St
Channelview, TX 77530
|
- sq. feet
|
2 baths 4 beds |
show details | |

|
#18
Grasilla Dr
Houston, TX 77045
|
1,781 sq. feet
|
2 baths 3 beds |
show details | |

|
#19
Early Dew Ct
Houston, TX 77045
|
- sq. feet
|
2 baths 3 beds |
show details | |

|
#20
Hillcroft St
Houston, TX 77096
|
2,207 sq. feet
|
2 baths 3 beds |
show details |
| Photo | Address | Area | Beds / Baths | Price | Details |
|---|---|---|---|---|---|

|
#21
Rampart St
Houston, TX 77096
|
2,132 sq. feet
|
2 baths 3 beds |
show details | |

|
#22
Abercorn St
Rosharon, TX 77583
|
- sq. feet
|
3 baths 4 beds |
show details | |

|
#23
E 40th 1/2 St
Houston, TX 77022
|
1,156 sq. feet
|
2 baths 3 beds |
show details | |

|
#24
2nd St
Galena Park, TX 77547
|
1,655 sq. feet
|
1 baths 3 beds |
show details | |

|
#25
Orchard Trail Dr
Pearland, TX 77581
|
2,632 sq. feet
|
3 baths 4 beds |
show details | |

|
#26
Bay Oaks Dr
Kemah, TX 77565
|
1,972 sq. feet
|
2 baths 3 beds |
show details | |

|
#27
Catamore St
Houston, TX 77076
|
1,235 sq. feet
|
1 baths 3 beds |
show details | |

|
#28
Chenevert St
Houston, TX 77003
|
2,138 sq. feet
|
4 baths 3 beds |
show details | |

|
#29
Josephine St
Houston, TX 77026
|
1,184 sq. feet
|
2 baths 3 beds |
show details | |

|
#30
Garden Ridge Ct
Manvel, TX 77578
|
- sq. feet
|
2 baths 4 beds |
show details |
| Photo | Address | Area | Beds / Baths | Price | Details |
|---|---|---|---|---|---|

|
#31
Lavender St
Houston, TX 77026
|
1,845 sq. feet
|
2 baths 3 beds |
show details | |

|
#32
Ashburn St
Houston, TX 77061
|
2,181 sq. feet
|
2 baths 4 beds |
show details | |

|
#33
N Brompton Dr
Pearland, TX 77584
|
1,106 sq. feet
|
2 baths 2 beds |
show details | |

|
#34
Ashburn St
Houston, TX 77061
|
1,947 sq. feet
|
2 baths 3 beds |
show details | |

|
#35
Acorn Clearing Path
Houston, TX 77044
|
2,225 sq. feet
|
3 baths 4 beds |
show details | |

|
#36
Doskocil Dr
Houston, TX 77044
|
1,650 sq. feet
|
2 baths 3 beds |
show details | |

|
#37
Coronation Dr
Houston, TX 77034
|
4,058 sq. feet
|
3 baths 3 beds |
show details | |

|
#38
Peach Mill Ln
Dickinson, TX 77539
|
- sq. feet
|
3 baths 4 beds |
show details | |

|
#39
Bering Dr Unit 603
Houston, TX 77057
|
2,115 sq. feet
|
3 baths 3 beds |
show details | |

|
#40
Ney St
Houston, TX 77034
|
1,240 sq. feet
|
1 baths 3 beds |
show details |
| Photo | Address | Area | Beds / Baths | Price | Details |
|---|---|---|---|---|---|

|
#41
Laurel Springs Ln
Dickinson, TX 77539
|
- sq. feet
|
2 baths 3 beds |
show details | |

|
#42
Pine Mill Ct
Pearland, TX 77584
|
3,196 sq. feet
|
4 baths 4 beds |
show details | |

|
#43
Oak Crossing Dr
Pearland, TX 77581
|
1,605 sq. feet
|
2 baths 3 beds |
show details | |

|
#44
Tangerine St
Houston, TX 77051
|
1,102 sq. feet
|
2 baths 4 beds |
show details | |

|
#45
Tremont Park Ct
Rosharon, TX 77583
|
3,950 sq. feet
|
4 baths 5 beds |
show details | |

|
#46
Brookston St
Houston, TX 77045
|
1,434 sq. feet
|
2 baths 3 beds |
show details | |

|
#47
Regal Oaks Bend Ln
Houston, TX 77047
|
1,560 sq. feet
|
2 baths 3 beds |
show details | |

|
#48
Mason St
Houston, TX 77006
|
3,083 sq. feet
|
3 baths 3 beds |
show details | |

|
#49
Mountain Mist Trl
Houston, TX 77049
|
1,587 sq. feet
|
2 baths 3 beds |
show details | |

|
Check over 1 million property listings on Foreclosure.com!
|
browse all offers | |||


 | Apartments by Hobby Airport? (6 replies) |
| Moving to Houston: Woodlands vs Katy vs ?? (56 replies) |
| Towne Lake Worsening? (187 replies) |
| Southside, Pearland, Sugar Land? (42 replies) |
| If Houston is supposedly ugly and boring.. (181 replies) |
| Why are there so many blacks in west Houston? (73 replies) |

Median year apartment built: 1971
Household type by relationship:
Households: 16,356- Male householders: 2,174 (539 living alone), Female householders: 2,701 (472 living alone)
2,095 spouses (2,095 opposite-sex spouses), 324 unmarried partners, (315 opposite-sex unmarried partners), 6,438 children (6,208 natural, 65 adopted, 164 stepchildren), 992 grandchildren, 407 brothers or sisters, 435 parents, 0 foster children, 472 other relatives, 305 non-relatives
- In group quarters: 6
Size of family households: 1,155 2-persons, 805 3-persons, 671 4-persons, 488 5-persons, 304 6-persons, 433 7-or-more-persons.
Size of nonfamily households: 1,099 1-person, 104 2-persons, 7 3-persons.
2,442 married couples with children.
1,848 single-parent households (408 men, 1,440 women).
27.8% of residents of South Houston speak English at home.
72.1% of residents speak Spanish at home (64% speak English very well, 13% speak English well, 10% speak English not well, 13% don't speak English at all).
0.3% of residents speak other Indo-European language at home (7% speak English well, 93% speak English not well).
0.6% of residents speak Asian or Pacific Island language at home (15% speak English very well, 77% speak English well, 8% speak English not well).
Foreign born population: 4,652 (28.4%)
(28.3% of them are naturalized citizens)
| Here: | 5.4 |
| State: | 6.3 |
| Here: | 4.4 |
| State: | 4.0 |

- Bedrooms in owner-occupied houses and condos in South Houston, Texas
- 8no bedroom
- 1191 bedroom
- 4532 bedrooms
- 1,5063 bedrooms
- 5084 bedrooms
- 355+ bedrooms

- Bedrooms in renter-occupied apartments in South Houston, Texas
- 67no bedroom
- 4351 bedroom
- 1,0372 bedrooms
- 7823 bedrooms
- 894 bedrooms
- 295+ bedrooms

- Cars and other vehicles available in South Houston in owner-occupied houses/condos
- 55no vehicle
- 4401 vehicle
- 8622 vehicles
- 7453 vehicles
- 4334 vehicles
- 945+ vehicles

- Cars and other vehicles available in South Houston in renter-occupied apartments
- 187no vehicle
- 1,1911 vehicle
- 7812 vehicles
- 1833 vehicles
- 984 vehicles
- 05+ vehicles

- Rooms in owner-occupied houses in South Houston, Texas
- 81 room
- 472 rooms
- 1023 rooms
- 4244 rooms
- 6935 rooms
- 9236 rooms
- 2677 rooms
- 1218 rooms
- 439+ rooms

- Rooms in renter-occupied apartments in South Houston, Texas
- 671 room
- 822 rooms
- 4363 rooms
- 6334 rooms
- 5175 rooms
- 4086 rooms
- 2597 rooms
- 388 rooms
- 09+ rooms


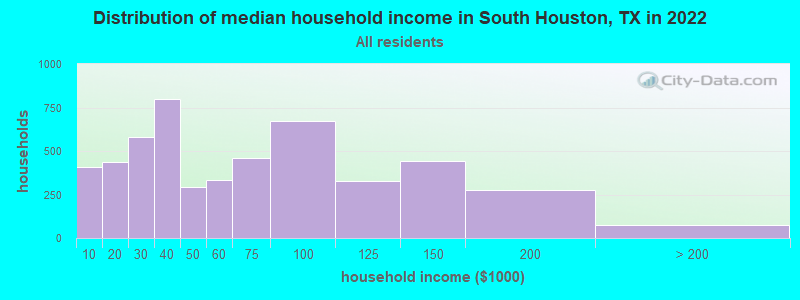
South Houston, TX household income distribution

- 407Less than $10,000
- 439$10,000 to $19,999
- 580$20,000 to $29,999
- 798$30,000 to $39,999
- 294$40,000 to $49,999
- 336$50,000 to $59,999
- 458$60,000 to $74,999
- 670$75,000 to $99,999
- 325$100,000 to $124,999
- 443$125,000 to $149,999
- 275$150,000 to $199,999
- 75$200,000 or more
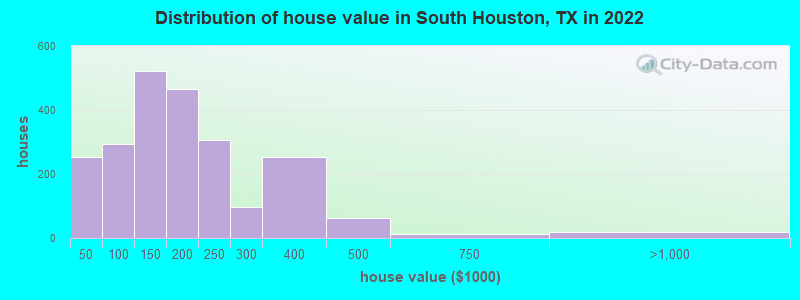
Home value of owner - occupied houses in 2022 in South Houston, TX
-
- 131Less than $10,000
- 8$10,000 to $14,999
- 43$15,000 to $19,999
- 10$30,000 to $34,999
- 18$35,000 to $39,999
- 41$40,000 to $49,999
- 45$50,000 to $59,999
- 34$60,000 to $69,999
- 30$70,000 to $79,999
- 118$80,000 to $89,999
- 24$90,000 to $99,999
- 321$100,000 to $124,999
- 200$125,000 to $149,999
- 227$150,000 to $174,999
- 238$175,000 to $199,999
- 306$200,000 to $249,999
- 97$250,000 to $299,999
- 252$300,000 to $399,999
- 61$400,000 to $499,999
- 13$500,000 to $749,999
- 19$750,000 to $999,999
Rent paid by renters in 2022 in South Houston, TX
-
- 28Less than $100
- 5$100 to $149
- 11$150 to $199
- 17$200 to $249
- 12$250 to $299
- 22$350 to $399
- 25$500 to $549
- 104$550 to $599
- 92$600 to $649
- 115$650 to $699
- 88$700 to $749
- 206$750 to $799
- 347$800 to $899
- 347$900 to $999
- 529$1,000 to $1,249
- 308$1,250 to $1,499
- 49$1,500 to $1,999
- 99No cash rent


Percentage of workers working in this county: 88.1%
Number of people working at home: 254 (3.6% of all workers)
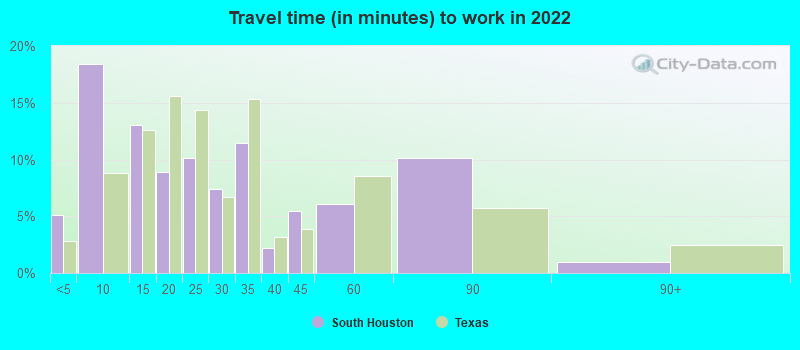
Travel time to work (commute)
- Less than 5 minutes: 114
- 5 to 9 minutes: 780
- 10 to 14 minutes: 748
- 15 to 19 minutes: 740
- 20 to 24 minutes: 849
- 25 to 29 minutes: 507
- 30 to 34 minutes: 1,032
- 35 to 39 minutes: 242
- 40 to 44 minutes: 137
- 45 to 59 minutes: 579
- 60 to 89 minutes: 505
- 90 or more minutes: 356
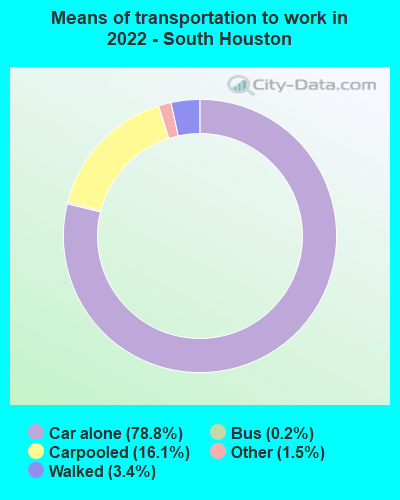
Means of transportation to work:
- Drove a car alone: 4,548 (72.6%)
- Carpooled: 1,089 (17.4%)
- Bus: 11 (0.2%)
- Taxi: 116 (1.9%)
- Walked: 189 (3.0%)
- Worked at home: 254 (4.1%)

- Unemployment by race in 2022
- Unemployment rate for White non-Hispanic residents
- 4.5%Males
- 16.3%Females
- Unemployment rate for Black residents
- 38.0%Males
- Unemployment rate for other race residents
- 8.0%Males
- Unemployment rate for two or more race residents
- 10.0%Males
- 4.4%Females
- Unemployment rate for Hispanic or Latino residents
- 8.7%Males
- 7.2%Females

- Year of entry for the foreign-born population in South Houston, Texas
- 9142010 or later
- 9692000 to 2009
- 1,0531990 to 1999
- 1,5431980 to 1989
- 9611970 to 1979
- 419Before 1970

First ancestries reported:
- African: 103 (0.8%)
- American: 98 (0.7%)
- English: 83 (0.6%)
- Irish: 49 (0.4%)
- European: 43 (0.3%)
- German: 36 (0.3%)
- Czech: 18 (0.1%)
- Italian: 17 (0.1%)
- Scotch-Irish: 14 (0.1%)
- Basque: 4 (0.03%)
- Cajun: 4 (0.03%)
- French: 4 (0.03%)
- Polish: 3 (0.02%)
Most common places of birth for foreign-born residents (%):
| South Houston: | 78.9% (3,672) |
| Texas: | 48.4% (2,411,723) |
| South Houston: | 7.0% (326) |
| Texas: | 4.5% (224,455) |
| South Houston: | 5.4% (252) |
| Texas: | 3.0% (147,182) |
Place of birth for U.S.-born residents:
- This state: 10,230
- Other state: 1,245
- Northeast: 117
- Midwest: 87
- South: 613
- West: 437
86.3% of South Houston residents lived in the same house 1 years ago.
Out of people who lived in different houses, 46.7% lived in this county.
Out of people who lived in different counties, 54.8% lived in Texas.
| South Houston: | 86.3% |
| State average: | 85.7% |
Education attainment for males 25 years and older:
- No schooling: 247
- Nursery to 4th grade: 97
- 5th and 6th grade: 241
- 7th and 8th grade: 247
- 9th grade: 246
- 10th grade: 103
- 11th grade: 277
- 12th grade, no diploma: 275
- High school graduate (or equivalency): 1,569
- Less than 1 year of college: 134
- Some college more than 1 year, no degree: 377
- Associate degree: 191
- Bachelor's degree: 195
- Master's degree: 45
- Professional school degree: 0
- Doctorate degree: 12

Education attainment for females 25 years and older:
- No schooling: 195
- Nursery to 4th grade: 325
- 5th and 6th grade: 314
- 7th and 8th grade: 85
- 9th grade: 264
- 10th grade: 108
- 11th grade: 147
- 12th grade, no diploma: 172
- High school graduate (or equivalency): 1,293
- Less than 1 year of college: 285
- Some college more than 1 year, no degree: 407
- Associate degree: 271
- Bachelor's degree: 470
- Master's degree: 78
- Professional school degree: 0
- Doctorate degree: 0


Housing units in structures:
- One, detached: 3,827
- One, attached: 101
- Two: 23
- 3 or 4: 273
- 5 to 9: 238
- 10 to 19: 518
- 20 to 49: 136
- 50 or more: 127
- Mobile homes: 364
- Boats, RVs, vans, etc.: 6
Housing units lacking complete kitchen facilities in 2022: 4.2%
House/condo owner moved in on average 17 years ago
Renter moved in on average 3 years ago

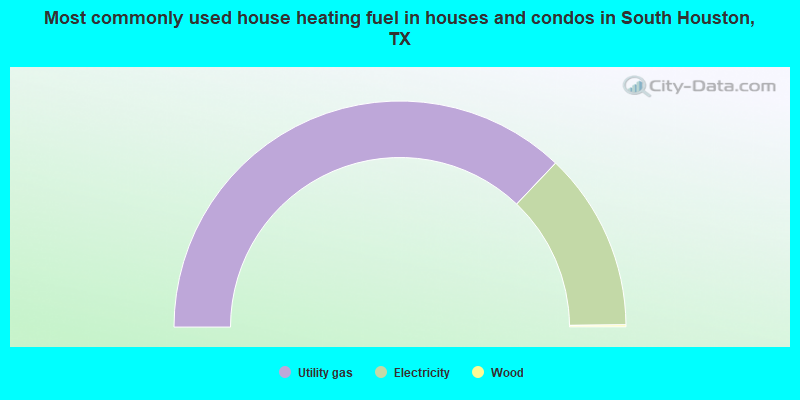
- 74.2%Utility gas
- 25.5%Electricity
- 0.3%Wood
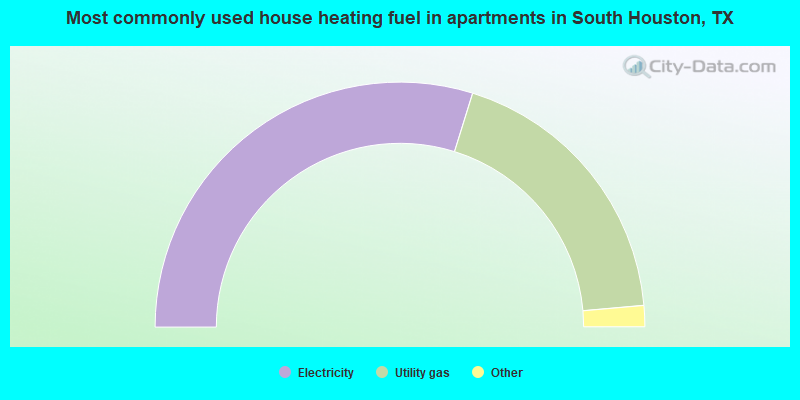
- 59.6%Electricity
- 37.6%Utility gas
- 1.6%No fuel used
- 0.7%Bottled, tank, or LP gas
- 0.4%Other fuel
Private vs. public school enrollment:
| Here: | 9.6% |
| Texas: | 8.8% |
| Here: | 9.3% |
| Texas: | 8.0% |
| Here: | 4.8% |
| Texas: | 16.2% |


