Waldorf, MD (Maryland) Houses and Residents
| Waldorf: | $379,300 |
| Maryland: | $398,100 |
Total population: 67,752 (Urban population: 22,338, Rural population: 59 (all nonfarm))
Houses: 31,625 (31,309 occupied: 22,931 owner occupied, 8,378 renter occupied)
| % of renters here: | 27% |
| State: | 32% |
Housing density: 2,475 houses/condos per square mile
Median price asked for vacant for-sale houses and condos in 2022: $283,146.
Median contract rent in 2022: $1,734 (lower quartile is $1,358, upper quartile is over $2,000)
Median rent asked for vacant for-rent units in 2022: $1,672
Median gross rent in Waldorf, MD in 2022: $1,894
Housing units in Waldorf with a mortgage: 19,436 (1,120 second mortgage, 54 home equity loan, 670 both second mortgage and home equity loan)
Houses without a mortgage: 278
Median household income for houses/condos with a mortgage: $127,716
Median household income for apartments without a mortgage: $112,346
Median monthly housing costs: $1,896
Compare current foreclosures in Waldorf, MD:
| Photo | Address | Area | Beds / Baths | Price | Details |
|---|---|---|---|---|---|

|
#1
Bannister Cir
Waldorf, MD 20602
|
1,196 sq. feet
|
3 baths 4 beds |
$449,900
|
show details |

|
#2
Meadowlark Ln
Waldorf, MD 20603
|
1,544 sq. feet
|
2 baths 3 beds |
show details | |

|
#3
Josephine Rd
Waldorf, MD 20601
|
2,086 sq. feet
|
3 baths 4 beds |
show details | |

|
#4
Damselfish Ct
Waldorf, MD 20603
|
2,380 sq. feet
|
3 baths 4 beds |
show details | |

|
#5
Mudville Ln
Waldorf, MD 20602
|
2,412 sq. feet
|
4 baths - beds |
show details | |

|
#6
Merseyside Pl
Waldorf, MD 20602
|
1,884 sq. feet
|
4 baths - beds |
show details | |

|
#7
Hatfield Ct
Waldorf, MD 20602
|
1,056 sq. feet
|
2 baths - beds |
show details | |

|
#8
Freedom Ct N
Waldorf, MD 20603
|
2,382 sq. feet
|
3 baths - beds |
show details | |

|
#9
Barnswallow Pl Apt A
Waldorf, MD 20603
|
2,496 sq. feet
|
4 baths - beds |
show details | |

|
#10
Woodchuck Pl
Waldorf, MD 20603
|
1,452 sq. feet
|
3 baths - beds |
show details |
| Photo | Address | Area | Beds / Baths | Price | Details |
|---|---|---|---|---|---|

|
#11
Willow View Pl
Waldorf, MD 20602
|
1,240 sq. feet
|
3 baths - beds |
show details | |

|
#12
Peanuts Ln
Waldorf, MD 20602
|
2,528 sq. feet
|
4 baths - beds |
show details | |

|
#13
Scotch Hills Pl
Waldorf, MD 20602
|
2,066 sq. feet
|
4 baths - beds |
show details | |

|
#14
Pepper Mill Ct
Waldorf, MD 20603
|
2,936 sq. feet
|
3 baths - beds |
show details | |

|
#15
Tyne Ct
Waldorf, MD 20601
|
1,776 sq. feet
|
3 baths - beds |
show details | |

|
#16
English Oak Ct
Waldorf, MD 20601
|
1,728 sq. feet
|
1 baths - beds |
show details | |

|
#17
Brightwell Ct
Waldorf, MD 20602
|
1,012 sq. feet
|
2 baths - beds |
show details | |

|
#18
Sunningdale Pl
Waldorf, MD 20602
|
1,690 sq. feet
|
3 baths - beds |
show details | |

|
#19
Westdale Ct
Waldorf, MD 20601
|
1,392 sq. feet
|
3 baths - beds |
show details | |

|
#20
Eagle Ct
Waldorf, MD 20603
|
1,240 sq. feet
|
2 baths - beds |
show details |
| Photo | Address | Area | Beds / Baths | Price | Details |
|---|---|---|---|---|---|

|
#21
Bethesda Dr
Waldorf, MD 20601
|
894 sq. feet
|
2 baths - beds |
show details | |

|
#22
Valley Oak Ct
Waldorf, MD 20601
|
820 sq. feet
|
2 baths - beds |
show details | |

|
#23
Plenty Gates Ct
Waldorf, MD 20601
|
3,071 sq. feet
|
4 baths - beds |
show details | |

|
#24
Edmont Pl
Waldorf, MD 20601
|
1,852 sq. feet
|
2 baths - beds |
show details | |

|
#25
Bridle Path Dr
Waldorf, MD 20601
|
996 sq. feet
|
3 baths - beds |
show details | |

|
#26
Echo Hill Pl
Waldorf, MD 20601
|
2,356 sq. feet
|
3 baths - beds |
show details | |

|
#27
Ocean Sunfish Ct
Waldorf, MD 20603
|
1,668 sq. feet
|
3 baths - beds |
show details | |

|
#28
Turtle Dove Pl
Waldorf, MD 20602
|
1,658 sq. feet
|
2 baths - beds |
show details | |

|
#29
Fullmoon Pl
Waldorf, MD 20603
|
1,660 sq. feet
|
2 baths - beds |
show details | |

|
#30
Muirfield Ct
Waldorf, MD 20602
|
2,758 sq. feet
|
3 baths - beds |
show details |
| Photo | Address | Area | Beds / Baths | Price | Details |
|---|---|---|---|---|---|

|
#31
Sharpersville Rd
Waldorf, MD 20601
|
1,497 sq. feet
|
2 baths - beds |
show details | |

|
#32
Creston Pl
Waldorf, MD 20601
|
2,283 sq. feet
|
3 baths - beds |
show details | |

|
#33
Bannister Cir
Waldorf, MD 20602
|
2,108 sq. feet
|
4 baths - beds |
show details | |

|
#34
Kempsford Field Pl
Waldorf, MD 20602
|
1,160 sq. feet
|
2 baths - beds |
show details | |

|
#35
Golden Eagle Pl
Waldorf, MD 20603
|
1,320 sq. feet
|
3 baths - beds |
show details | |

|
#36
Broadbill Dr
Waldorf, MD 20603
|
2,644 sq. feet
|
3 baths - beds |
show details | |

|
#37
Alyssa Ln
Waldorf, MD 20603
|
2,828 sq. feet
|
2 baths - beds |
show details | |

|
#38
Ashford Ln
Waldorf, MD 20603
|
4,000 sq. feet
|
3 baths - beds |
show details | |

|
#39
Stone Ave
Waldorf, MD 20602
|
1,689 sq. feet
|
1 baths - beds |
show details | |

|
#40
Grebe Pl
Waldorf, MD 20603
|
1,120 sq. feet
|
2 baths - beds |
show details |
| Photo | Address | Area | Beds / Baths | Price | Details |
|---|---|---|---|---|---|

|
#41
Hale Ct
Waldorf, MD 20603
|
2,465 sq. feet
|
2 baths - beds |
show details | |

|
#42
Water Hickory Ct
Waldorf, MD 20601
|
1,760 sq. feet
|
2 baths - beds |
show details | |

|
#43
Mockingbird Cir
Waldorf, MD 20603
|
1,078 sq. feet
|
2 baths - beds |
show details | |

|
#44
Sweetwood Pl
Waldorf, MD 20602
|
1,240 sq. feet
|
2 baths - beds |
show details | |

|
#45
Red Lion Pl
Waldorf, MD 20602
|
1,380 sq. feet
|
1 baths - beds |
show details | |

|
#46
Cheryl Turn
Waldorf, MD 20603
|
2,480 sq. feet
|
3 baths - beds |
show details | |

|
#47
Cloudberry Ct
Waldorf, MD 20603
|
2,962 sq. feet
|
3 baths - beds |
show details | |

|
#48
Cygnet Dr
Waldorf, MD 20601
|
2,568 sq. feet
|
2 baths - beds |
show details | |

|
#49
Scottsdale Pl
Waldorf, MD 20602
|
2,012 sq. feet
|
3 baths - beds |
show details | |

|
Check over 1 million property listings on Foreclosure.com!
|
browse all offers | |||

Latest news about housing in Waldorf, MD collected exclusively by city-data.com from local newspapers, TV, and radio stations

 | Looked at houses in Waldorf yesterday - expanding our search. (36 replies) |
| Looking for homes in MD commute to Alexandria and Suitland where to look. (14 replies) |
| Waldorf MD Just bought a house (6 replies) |
| Renting In Waldorf (5 replies) |
| What's the story with the white people in Prince George County? :) (192 replies) |
| Chesapeake bay seafood house in waldorf (1 reply) |

Median year apartment built: 1992
Household type by relationship:
Households: 84,642- Male householders: 14,382 (2,847 living alone), Female householders: 16,927 (5,506 living alone)
13,496 spouses (13,496 opposite-sex spouses), 2,742 unmarried partners, (2,742 opposite-sex unmarried partners), 29,431 children (28,021 natural, 316 adopted, 1,094 stepchildren), 2,282 grandchildren, 801 brothers or sisters, 1,170 parents, 0 foster children, 1,385 other relatives, 1,652 non-relatives
- In group quarters: 374
Size of family households: 6,318 2-persons, 7,328 3-persons, 4,348 4-persons, 976 5-persons, 1,510 6-persons, 701 7-or-more-persons.
Size of nonfamily households: 8,353 1-person, 1,230 2-persons, 545 3-persons.
12,539 married couples with children.
4,591 single-parent households (631 men, 3,960 women).
86.2% of residents of Waldorf speak English at home.
6.3% of residents speak Spanish at home (64% speak English very well, 17% speak English well, 11% speak English not well, 8% don't speak English at all).
2.1% of residents speak other Indo-European language at home (61% speak English very well, 26% speak English well, 8% speak English not well, 4% don't speak English at all).
2.1% of residents speak Asian or Pacific Island language at home (60% speak English very well, 29% speak English well, 8% speak English not well, 3% don't speak English at all).
2.4% of residents speak other language at home (83% speak English very well, 10% speak English well, 2% speak English not well, 6% don't speak English at all).
Foreign born population: 7,933 (9.4%)
(62.1% of them are naturalized citizens)
| Here: | 7.2 |
| State: | 7.3 |
| Here: | 5.0 |
| State: | 4.2 |
- Bedrooms in owner-occupied houses and condos in Waldorf, Maryland
- 0no bedroom
- 01 bedroom
- 6452 bedrooms
- 12,3303 bedrooms
- 7,3504 bedrooms
- 2,6065+ bedrooms
- Bedrooms in renter-occupied apartments in Waldorf, Maryland
- 409no bedroom
- 6971 bedroom
- 4,9882 bedrooms
- 2,1813 bedrooms
- 1034 bedrooms
- 05+ bedrooms
- Cars and other vehicles available in Waldorf in owner-occupied houses/condos
- 0no vehicle
- 5,7211 vehicle
- 10,7932 vehicles
- 4,4383 vehicles
- 1,1994 vehicles
- 7805+ vehicles
- Cars and other vehicles available in Waldorf in renter-occupied apartments
- 572no vehicle
- 3,9731 vehicle
- 2,6462 vehicles
- 1,0543 vehicles
- 884 vehicles
- 455+ vehicles
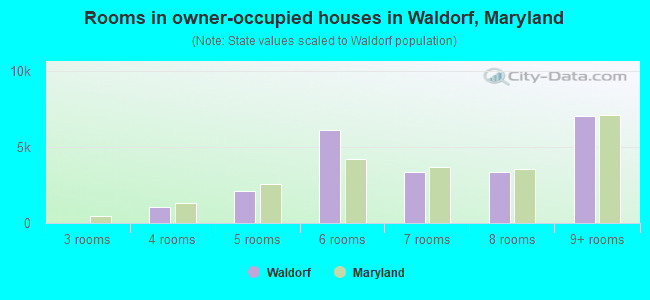
- Rooms in owner-occupied houses in Waldorf, Maryland
- 01 room
- 02 rooms
- 03 rooms
- 1,0524 rooms
- 2,0755 rooms
- 6,0896 rooms
- 3,3667 rooms
- 3,3368 rooms
- 7,0139+ rooms
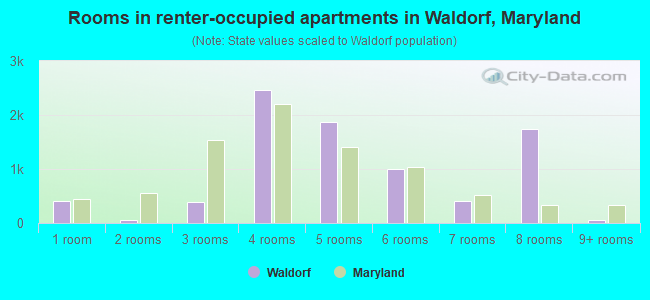
- Rooms in renter-occupied apartments in Waldorf, Maryland
- 4091 room
- 502 rooms
- 3803 rooms
- 2,4594 rooms
- 1,8795 rooms
- 9986 rooms
- 4137 rooms
- 1,7328 rooms
- 589+ rooms
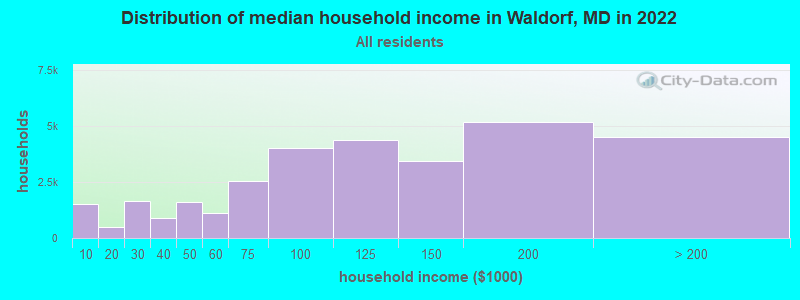
Waldorf, MD household income distribution

- 1,518Less than $10,000
- 499$10,000 to $19,999
- 1,651$20,000 to $29,999
- 874$30,000 to $39,999
- 1,620$40,000 to $49,999
- 1,107$50,000 to $59,999
- 2,551$60,000 to $74,999
- 4,001$75,000 to $99,999
- 4,365$100,000 to $124,999
- 3,443$125,000 to $149,999
- 5,183$150,000 to $199,999
- 4,497$200,000 or more
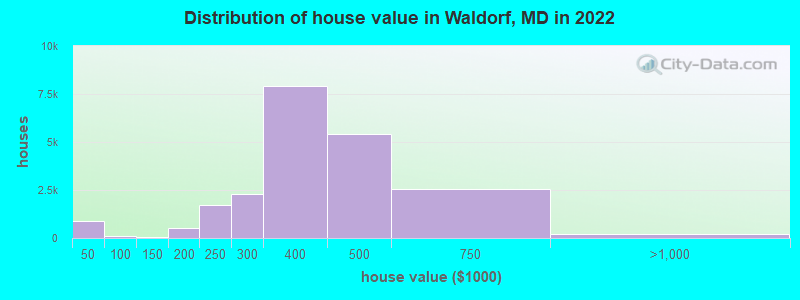
Home value of owner - occupied houses in 2022 in Waldorf, MD
-
- 545Less than $10,000
- 33$10,000 to $14,999
- 32$15,000 to $19,999
- 78$20,000 to $24,999
- 76$25,000 to $29,999
- 11$30,000 to $34,999
- 91$35,000 to $39,999
- 6$40,000 to $49,999
- 24$50,000 to $59,999
- 11$70,000 to $79,999
- 57$80,000 to $89,999
- 23$90,000 to $99,999
- 7$100,000 to $124,999
- 22$125,000 to $149,999
- 155$150,000 to $174,999
- 366$175,000 to $199,999
- 1,738$200,000 to $249,999
- 2,309$250,000 to $299,999
- 7,897$300,000 to $399,999
- 5,414$400,000 to $499,999
- 2,527$500,000 to $749,999
- 81$750,000 to $999,999
- 36$1,500,000 to $1,999,999
- 72$2,000,000 or more
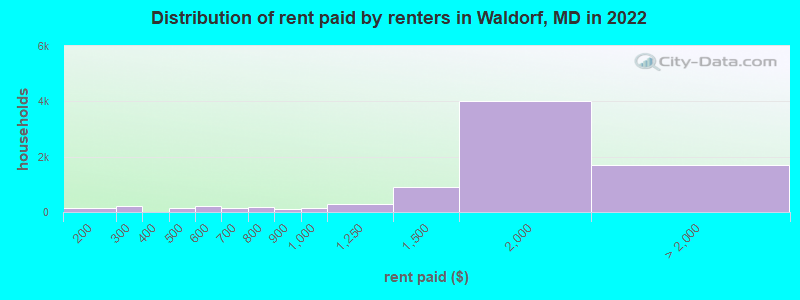
Rent paid by renters in 2022 in Waldorf, MD
-
- 47$100 to $149
- 91$150 to $199
- 141$200 to $249
- 73$250 to $299
- 8$300 to $349
- 130$450 to $499
- 175$500 to $549
- 48$550 to $599
- 33$600 to $649
- 101$650 to $699
- 174$700 to $749
- 106$800 to $899
- 128$900 to $999
- 303$1,000 to $1,249
- 887$1,250 to $1,499
- 3,994$1,500 to $1,999
- 1,258$2,000 to $2,499
- 221$2,500 to $2,999
- 21$3,000 to $3,499
- 15$3,500 or more
- 171No cash rent
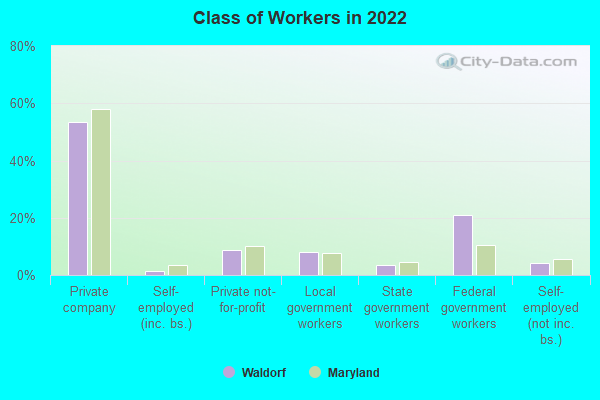
Percentage of workers working in this county: 45.0%
Number of people working at home: 6,708 (14.4% of all workers)

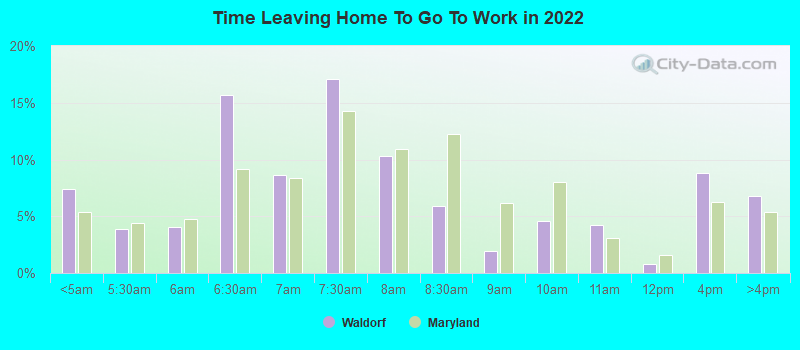
Travel time to work (commute)
- Less than 5 minutes: 556
- 5 to 9 minutes: 972
- 10 to 14 minutes: 2,477
- 15 to 19 minutes: 2,965
- 20 to 24 minutes: 3,336
- 25 to 29 minutes: 2,421
- 30 to 34 minutes: 4,070
- 35 to 39 minutes: 2,758
- 40 to 44 minutes: 1,534
- 45 to 59 minutes: 5,764
- 60 to 89 minutes: 8,101
- 90 or more minutes: 5,071
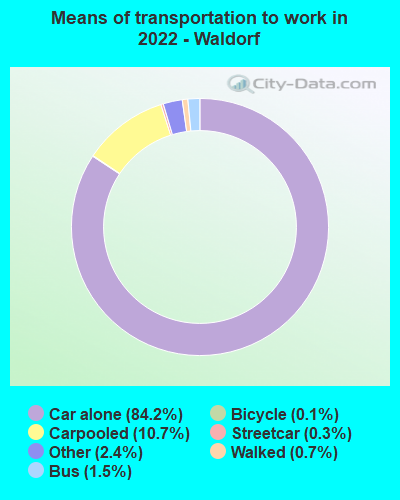
Means of transportation to work:
- Drove a car alone: 16,705 (64.0%)
- Carpooled: 2,263 (8.7%)
- Bus: 237 (0.9%)
- Subway or elevated rail: 56 (0.2%)
- Taxi: 527 (2.0%)
- Bicycle: 30 (0.1%)
- Walked: 138 (0.5%)
- Worked at home: 6,629 (25.4%)
- Unemployment by race in 2022
- Unemployment rate for Black residents
- 9.1%Males
- 9.4%Females
- Unemployment rate for American Indian and Alaska Native residents
- 37.2%Females
- Unemployment rate for Asian residents
- 1.8%Males
- 3.7%Females
- Unemployment rate for other race residents
- 2.8%Females
- Unemployment rate for two or more race residents
- 2.8%Males
- 6.1%Females
- Unemployment rate for Hispanic or Latino residents
- 3.1%Males
- 5.3%Females
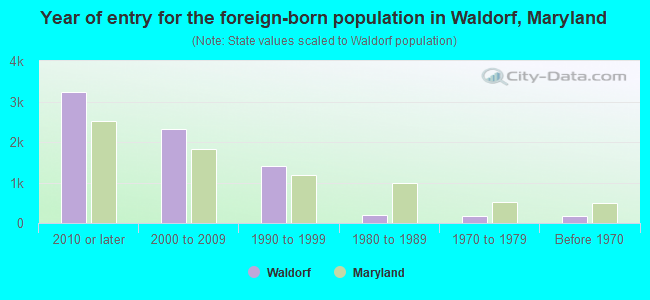
- Year of entry for the foreign-born population in Waldorf, Maryland
- 3,2332010 or later
- 2,3272000 to 2009
- 1,4131990 to 1999
- 2071980 to 1989
- 1741970 to 1979
- 165Before 1970
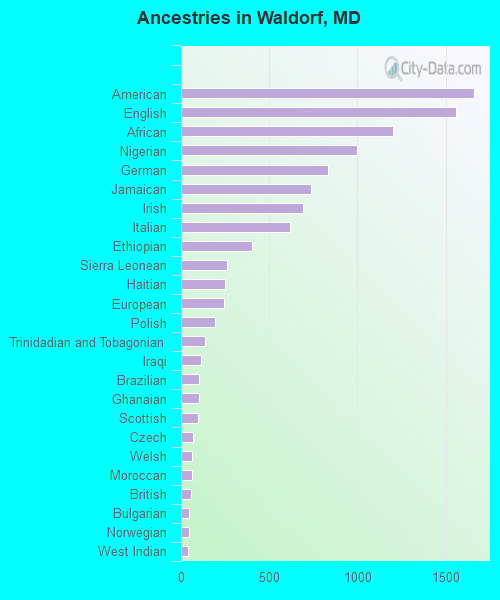
First ancestries reported:
- American: 1,663 (3.6%)
- English: 1,558 (3.4%)
- African: 1,202 (2.6%)
- Nigerian: 997 (2.2%)
- German: 835 (1.8%)
- Jamaican: 738 (1.6%)
- Irish: 693 (1.5%)
- Italian: 618 (1.3%)
- Ethiopian: 404 (0.9%)
- Sierra Leonean: 259 (0.6%)
- Haitian: 248 (0.5%)
- European: 241 (0.5%)
- Polish: 193 (0.4%)
- Trinidadian and Tobagonian: 136 (0.3%)
- Iraqi: 112 (0.2%)
- Brazilian: 104 (0.2%)
- Ghanaian: 104 (0.2%)
- Scottish: 98 (0.2%)
- Czech: 68 (0.1%)
- Welsh: 65 (0.1%)
- Moroccan: 63 (0.1%)
- British: 55 (0.1%)
- Bulgarian: 47 (0.1%)
- Norwegian: 46 (0.10%)
- West Indian: 42 (0.09%)
- British West Indian: 34 (0.07%)
- French: 32 (0.07%)
- Scotch-Irish: 25 (0.05%)
- Greek: 20 (0.04%)
- Slovak: 20 (0.04%)
- Finnish: 18 (0.04%)
- Northern European: 18 (0.04%)
- Barbadian: 17 (0.04%)
- Croatian: 12 (0.03%)
- Scandinavian: 11 (0.02%)
- Celtic: 10 (0.02%)
- Hungarian: 9 (0.02%)
- Guyanese: 7 (0.02%)
- Lebanese: 7 (0.02%)
- Ukrainian: 6 (0.01%)
- Dutch: 4 (0.01%)
Most common places of birth for foreign-born residents (%):
| Waldorf: | 10.8% (914) |
| Maryland: | 3.8% (36,698) |
| Waldorf: | 9.0% (760) |
| Maryland: | 4.6% (44,825) |
| Waldorf: | 8.6% (729) |
| Maryland: | 4.4% (42,350) |
| Waldorf: | 8.4% (708) |
| Maryland: | 2.8% (27,444) |
| Waldorf: | 7.2% (608) |
| Maryland: | 12.0% (115,412) |
| Waldorf: | 3.6% (301) |
| Maryland: | 1.8% (17,037) |
| Waldorf: | 3.4% (286) |
| Maryland: | 0.5% (4,689) |
| Waldorf: | 3.2% (273) |
| Maryland: | 3.5% (34,065) |
| Waldorf: | 3.0% (255) |
| Maryland: | 1.1% (10,233) |
| Waldorf: | 2.5% (212) |
| Maryland: | 1.4% (13,947) |
| Waldorf: | 2.4% (206) |
| Maryland: | 1.1% (10,205) |
| Waldorf: | 2.2% (190) |
| Maryland: | 3.2% (30,870) |
| Waldorf: | 2.1% (180) |
| Maryland: | 2.5% (23,969) |
| Waldorf: | 2.0% (165) |
| Maryland: | 0.6% (5,959) |
| Waldorf: | 1.9% (158) |
| Maryland: | 1.8% (17,161) |
| Waldorf: | 1.8% (156) |
| Maryland: | 6.4% (61,725) |
| Waldorf: | 1.6% (139) |
| Maryland: | 4.6% (44,742) |
Place of birth for U.S.-born residents:
- This state: 27,427
- Other state: 47,679
- Northeast: 7,296
- Midwest: 2,611
- South: 35,564
- West: 2,208
85.1% of Waldorf residents lived in the same house 1 years ago.
Out of people who lived in different houses, 23.0% lived in this county.
Out of people who lived in different counties, 53.6% lived in Maryland.
| Waldorf: | 85.1% |
| State average: | 88.5% |
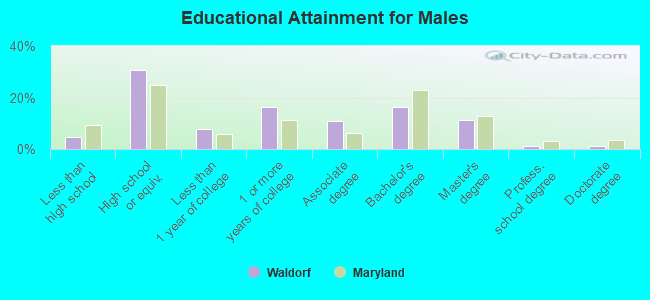
Education attainment for males 25 years and older:
- No schooling: 322
- Nursery to 4th grade: 47
- 5th and 6th grade: 89
- 7th and 8th grade: 57
- 9th grade: 75
- 10th grade: 201
- 11th grade: 115
- 12th grade, no diploma: 223
- High school graduate (or equivalency): 7,597
- Less than 1 year of college: 1,910
- Some college more than 1 year, no degree: 4,062
- Associate degree: 2,741
- Bachelor's degree: 4,048
- Master's degree: 2,818
- Professional school degree: 254
- Doctorate degree: 267
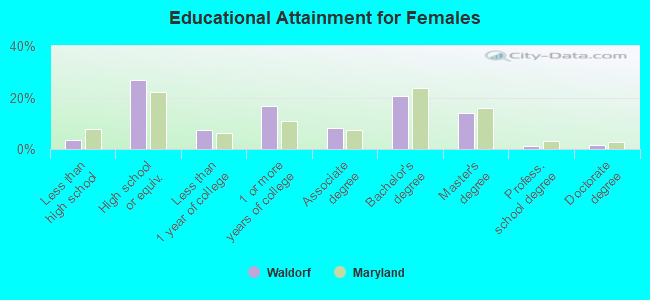
Education attainment for females 25 years and older:
- No schooling: 189
- Nursery to 4th grade: 53
- 5th and 6th grade: 62
- 7th and 8th grade: 83
- 9th grade: 51
- 10th grade: 199
- 11th grade: 87
- 12th grade, no diploma: 326
- High school graduate (or equivalency): 8,402
- Less than 1 year of college: 2,314
- Some college more than 1 year, no degree: 5,198
- Associate degree: 2,584
- Bachelor's degree: 6,448
- Master's degree: 4,374
- Professional school degree: 327
- Doctorate degree: 519


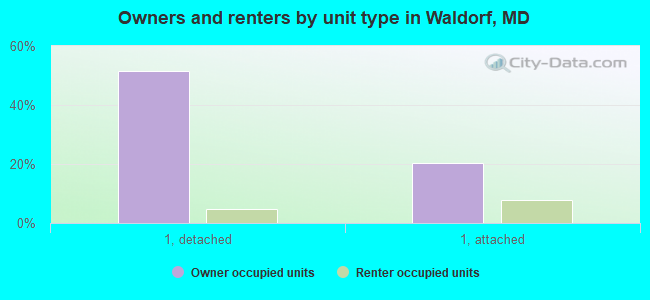
Housing units in structures:
- One, detached: 16,582
- One, attached: 8,979
- Two: 646
- 3 or 4: 243
- 5 to 9: 1,080
- 10 to 19: 2,583
- 20 to 49: 460
- 50 or more: 976
- Mobile homes: 76
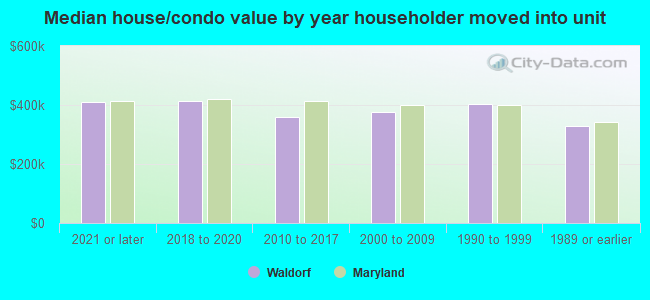
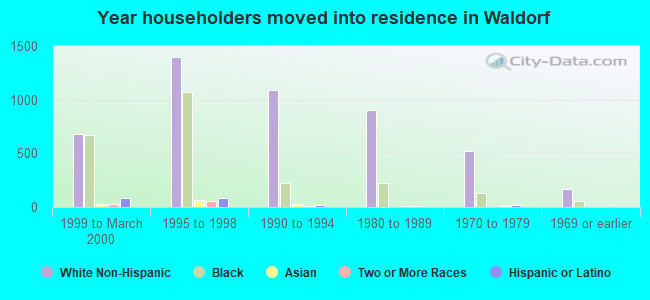
House/condo owner moved in on average 9 years ago
Renter moved in on average 3 years ago
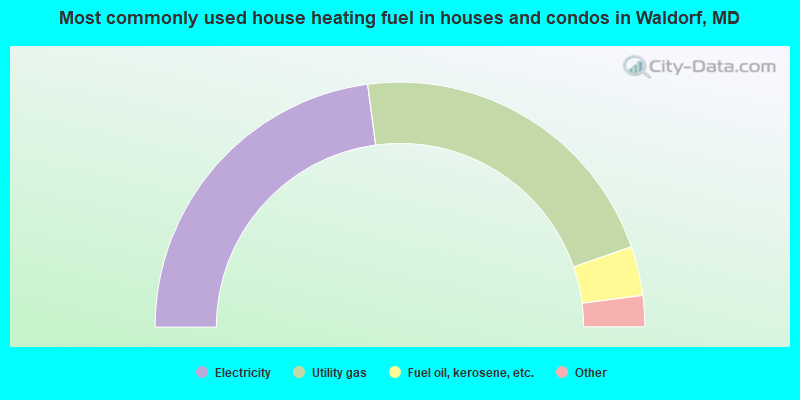
- 45.8%Electricity
- 43.6%Utility gas
- 6.5%Fuel oil, kerosene, etc.
- 2.1%Bottled, tank, or LP gas
- 1.0%Solar energy
- 0.5%Other fuel
- 0.4%Wood
- 0.1%No fuel used
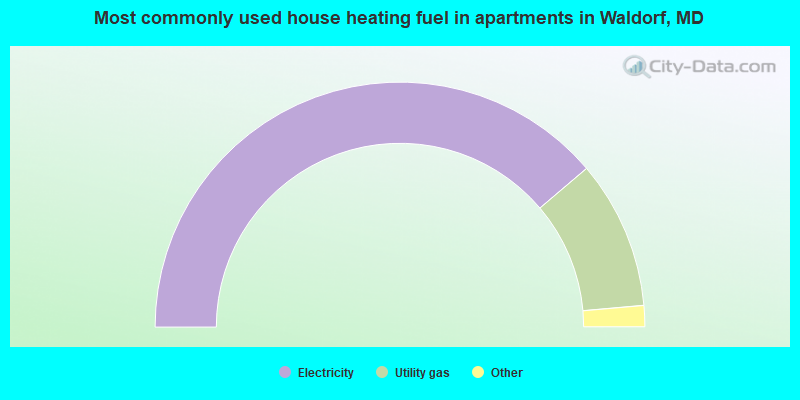
- 77.6%Electricity
- 19.6%Utility gas
- 1.8%Fuel oil, kerosene, etc.
- 0.5%Bottled, tank, or LP gas
- 0.5%No fuel used
Private vs. public school enrollment:
| Here: | 13.9% |
| Maryland: | 15.2% |
| Here: | 6.2% |
| Maryland: | 14.4% |
| Here: | 10.3% |
| Maryland: | 20.2% |