Walla Walla, WA (Washington) Houses and Residents
Estimated median house or condo value in 2022: $378,343 (it was $97,100 in 2000 )
Walla Walla:
$378,343Washington:
$569,500
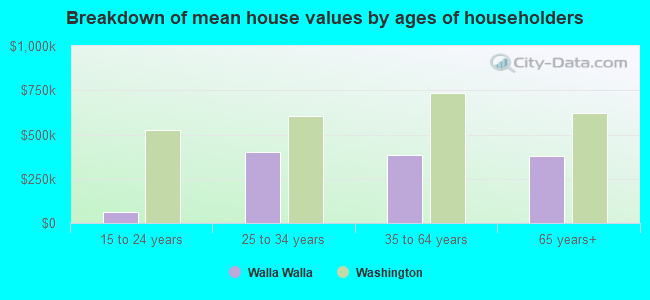
Lower value quartile - upper value quartile: $252,815 - $498,257Mean price in 2022: Detached houses: $383,285 Here:
$383,285State:
$734,307
Townhouses or other attached units: $485,914 Here:
$485,914State:
$657,697
In 5-or-more-unit structures: $299,980 Here:
$299,980State:
$503,183
Mobile homes: $60,509 Here:
$60,509State:
$218,362
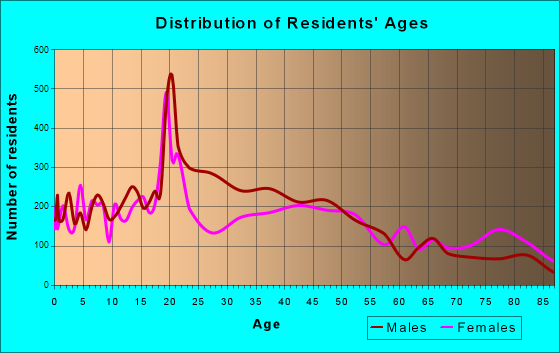
Total population: 31,910 (Urban population: 29,792 (all inside urban clusters), Rural population: 0)
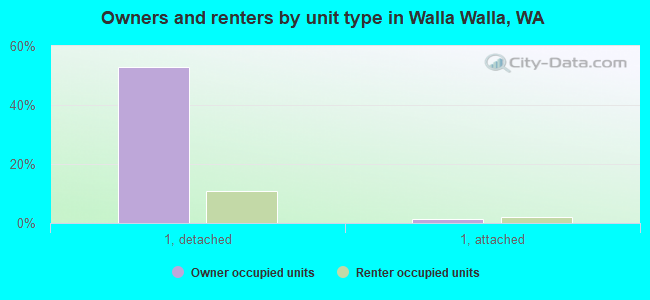
Houses: 14,437 (13,253 occupied: 8,036 owner occupied, 5,263 renter occupied )
% of renters here:
40%State:
36%
Housing density: 1,335 houses/condos per square mile
Median price asked for vacant for-sale houses and condos in 2022: $215,192.
Median contract rent in 2022: $988 (lower quartile is $722, upper quartile is $1,264)
Median rent asked for vacant for-rent units in 2022: $2,010
Median gross rent in Walla Walla, WA in 2022: $1,135
Housing units in Walla Walla with a mortgage: 4,242 (291 second mortgage, 4 home equity loan, 171 both second mortgage and home equity loan )Houses without a mortgage: 56
Median household income for houses/condos with a mortgage: $88,255
Median household income for apartments without a mortgage: $63,809
Median monthly housing costs: $1,077
Data:
Median house or condo value ($)
Median house or condo value ($ change since 2000)
Median house or condo value ($) - White
Median house or condo value ($) - Black or African American
Median house or condo value ($) - Asian
Median house or condo value ($) - Hispanic or Latino
Median house or condo value ($) - American Indian and Alaska Native
Median house or condo value ($) - Multirace
Median house or condo value ($) - Other Race
Median price asked for mobile homes ($)
Household density (households per square mile)
Mean house or condo value by units in structure - 1, detached ($)
Mean house or condo value by units in structure - 1, attached ($)
Mean house or condo value by units in structure - 2 ($)
Mean house or condo value by units in structure by units in structure - 3 or 4 ($)
Mean house or condo value by units in structure - 5 or more ($)
Mean house or condo value by units in structure - Boat, RV, van, etc. ($)
Mean house or condo value by units in structure - Mobile home ($)
Median contract rent ($)
Median contract rent - Lower quartile ($)
Median contract rent - Upper quartile ($)
Median gross rent ($)
Urban houses (%)
Rural houses (%)
Houses occupied (%)
Houses occupied (% change since 2000)
Houses owner occupied (%)
Houses owner occupied (% change since 2000)
Houses renter occupied (%)
Houses renter occupied (% change since 2000)
Vacant housing units - For rent (%)
Vacant housing units - For rent (% change since 2000)
Vacant housing units - For sale only (%)
Vacant housing units - For sale only (% change since 2000)
Vacant housing units - Rented or sold, not occupied (%)
Vacant housing units - Rented or sold, not occupied (% change since 2000)
Vacant housing units - For seasonal, recreational, or occasional use (%)
Vacant housing units - For seasonal, recreational, or occasional use (% change since 2000)
Vacant housing units - For migrant workers (%)
Vacant housing units - For migrant workers (% change since 2000)
Vacant housing units - Other vacant (%)
Vacant housing units - Other vacant (% change since 2000)
Median monthly housing costs ($)
Median household income for houses/condos with a mortgage ($)
Median household income for houses/condos without a mortgage ($)
Median household income ($)
Median household income ($) - White
Median household income ($) - Black or African American
Median household income ($) - Asian
Median household income ($) - Hispanic or Latino
Median household income ($) - American Indian and Alaska Native
Median household income ($) - Multirace
Median household income ($) - Other Race
Mortgage status - with mortgage (%)
Mortgage status - with second mortgage (%)
Mortgage status - with home equity loan (%)
Mortgage status - with both second mortgage and home equity loan (%)
Mortgage status - without a mortgage (%)
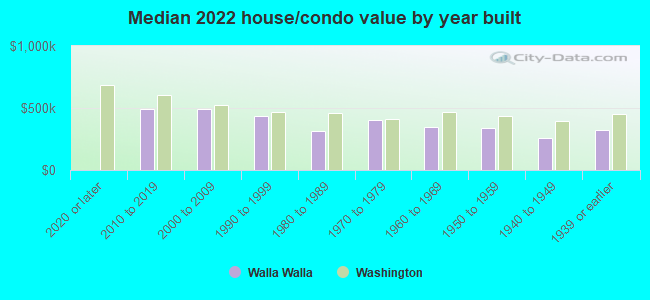
Median year house/condo built
Median year apartment built
Household type by relationship - Male householder living alone (%)
Household type by relationship - Male householder not living alone (%)
Household type by relationship - Female householder living alone (%)
Household type by relationship - Female householder not living alone (%)
Household type by relationship - Opposite-Sex spouse (%)
Household type by relationship - Same-Sex spouse (%)
Household type by relationship - Opposite-Sex unmarried partner (%)
Household type by relationship - Same-Sex unmarried partner (%)
Household type by relationship - In group quarters (%)
Size of family households - 2-person household (%)
Size of family households - 3-person household (%)
Size of family households - 4-person household (%)
Size of family households - 5-person household (%)
Size of family households - 6-person household (%)
Size of family households - 7-or-more-person household (%)
Size of nonfamily households - 1-person household (%)
Size of nonfamily households - 2-person household (%)
Size of nonfamily households - 3-person household (%)
Size of nonfamily households - 4-person household (%)
Size of nonfamily households - 5-person household (%)
Size of nonfamily households - 6-person household (%)
Size of nonfamily households - 7-or-moreperson household (%)
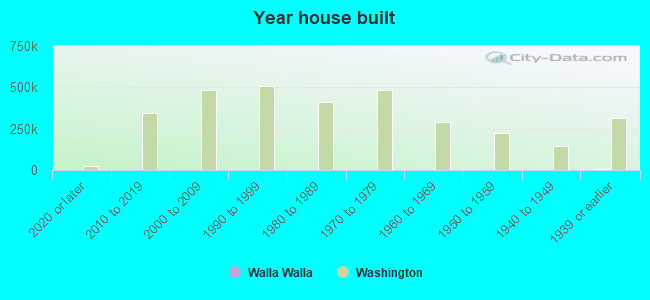
Year house built - Built 2010 or later (%)
Year house built - Built 2000 to 2009 (%)
Year house built - Built 1990 to 1999 (%)
Year house built - Built 1980 to 1989 (%)
Year house built - Built 1970 to 1979 (%)
Year house built - Built 1960 to 1969 (%)
Year house built - Built 1950 to 1959 (%)
Year house built - Built 1940 to 1949 (%)
Year house built - Built 1939 or earlier (%)
Median number of rooms in houses and condos
Median number of rooms in apartments
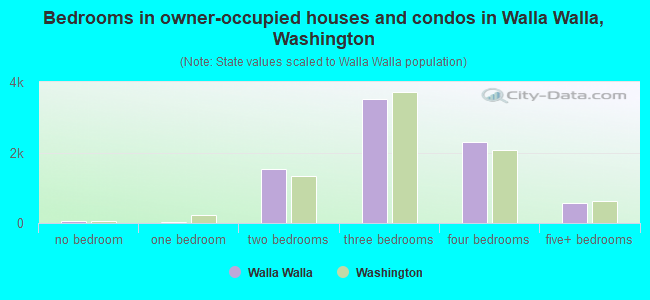
Median number of bedrooms in owner occupied houses
Mean number of bedrooms in owner occupied houses
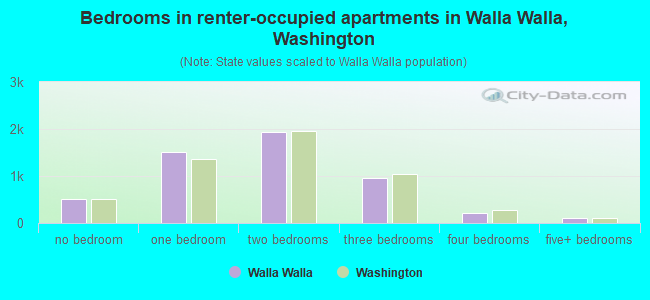
Median number of bedrooms in renter occupied houses
Mean number of bedrooms in renter occupied houses
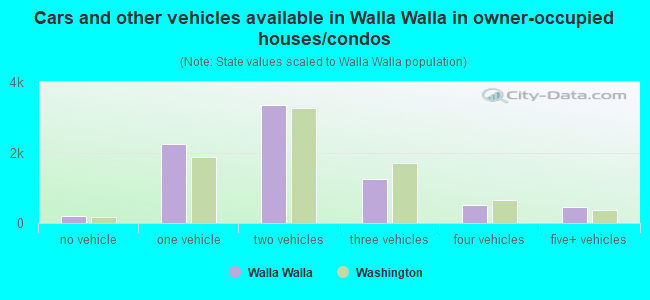
Median number of vehichles in owner occupied houses
Mean number of vehichles in owner occupied houses
Median number of vehichles in renter occupied houses
Mean number of vehichles in renter occupied houses
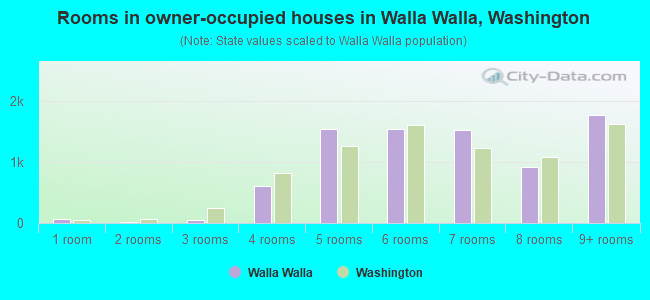
Rooms in owner-occupied houses - 1 room (%)
Rooms in owner-occupied houses - 2 rooms (%)
Rooms in owner-occupied houses - 3 rooms (%)
Rooms in owner-occupied houses - 4 rooms (%)
Rooms in owner-occupied houses - 5 rooms (%)
Rooms in owner-occupied houses - 6 rooms (%)
Rooms in owner-occupied houses - 7 rooms (%)
Rooms in owner-occupied houses - 8 rooms (%)
Rooms in owner-occupied houses - 9+ rooms (%)
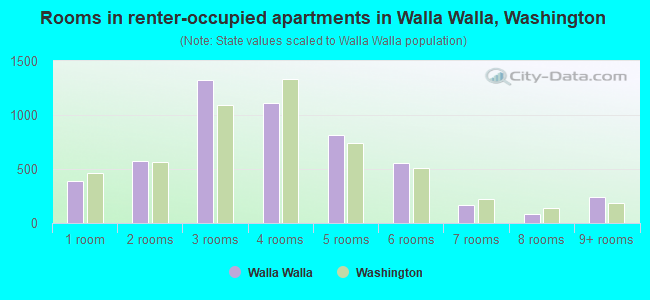
Rooms in renter-occupied houses - 1 room (%)
Rooms in renter-occupied houses - 2 rooms (%)
Rooms in renter-occupied houses - 3 rooms (%)
Rooms in renter-occupied houses - 4 rooms (%)
Rooms in renter-occupied houses - 5 rooms (%)
Rooms in renter-occupied houses - 6 rooms (%)
Rooms in renter-occupied houses - 7 rooms (%)
Rooms in renter-occupied houses - 8 rooms (%)
Rooms in renter-occupied houses - 9+ rooms (%)
Bedrooms in owner-occupied houses - no bedrooms (%)
Bedrooms in owner-occupied houses - 1 bedroom (%)
Bedrooms in owner-occupied houses - 2 bedrooms (%)
Bedrooms in owner-occupied houses - 3 bedrooms (%)
Bedrooms in owner-occupied houses - 4 bedrooms (%)
Bedrooms in owner-occupied houses - 5+ bedrooms (%)
Bedrooms in renter-occupied houses - no bedrooms (%)
Bedrooms in renter-occupied houses - 1 bedroom (%)
Bedrooms in renter-occupied houses - 2 bedrooms (%)
Bedrooms in renter-occupied houses - 3 bedrooms (%)
Bedrooms in renter-occupied houses - 4 bedrooms (%)
Bedrooms in renter-occupied houses - 5+ bedrooms (%)
Vehicles available in owner-occupied houses - no vehicle available (%)
Vehicles available in owner-occupied houses - 1 vehicle available(%)
Vehicles available in owner-occupied houses - 2 Vehicles available (%)
Vehicles available in owner-occupied houses - 3 Vehicles available (%)
Vehicles available in owner-occupied houses - 4 Vehicles available (%)
Vehicles available in owner-occupied houses - 5+ Vehicles available (%)
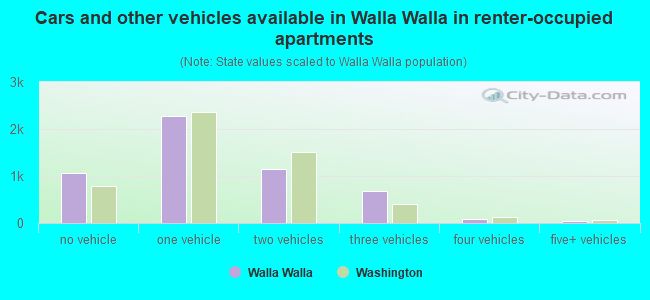
Vehicles available in renter-occupied houses - no vehicle available (%)
Vehicles available in renter-occupied houses - 1 vehicle available (%)
Vehicles available in renter-occupied houses - 2 Vehicles available (%)
Vehicles available in renter-occupied houses - 3 Vehicles available (%)
Vehicles available in renter-occupied houses - 4 Vehicles available (%)
Vehicles available in renter-occupied houses - 5+ Vehicles available (%)
Housing units in structures - 1, detached (%)
Housing units in structures - 1, attached (%)
Housing units in structures - 2 (%)
Housing units in structures - 3 or 4 (%)
Housing units in structures - 5 to 9 (%)
Housing units in structures - 10 to 19 (%)
Housing units in structures - 20 to 49 (%)
Housing units in structures - 50 or more (%)
Housing units in structures - Mobile home (%)
Housing units in structures - Boat, RV, van, etc. (%)
Housing units in structures - Owners - 1, detached (%)
Housing units in structures - Owners - 1, attached (%)
Housing units in structures - Owners - 2 (%)
Housing units in structures - Owners - 3 or 4 (%)
Housing units in structures - Owners - 5 to 9 (%)
Housing units in structures - Owners - 10 to 19 (%)
Housing units in structures - Owners - 20 to 49 (%)
Housing units in structures - Owners - 50 or more (%)
Housing units in structures - Owners - Mobile home (%)
Housing units in structures - Owners - Boat, RV, van, etc. (%)
Housing units in structures - Renters - 1, detached (%)
Housing units in structures - Renters - 1, attached (%)
Housing units in structures - Renters - 2 (%)
Housing units in structures - Renters - 3 or 4 (%)
Housing units in structures - Renters - 5 to 9 (%)
Housing units in structures - Renters - 10 to 19 (%)
Housing units in structures - Renters - 20 to 49 (%)
Housing units in structures - Renters - 50 or more (%)
Housing units in structures - Renters - Mobile home (%)
Housing units in structures - Renters - Boat, RV, van, etc. (%)
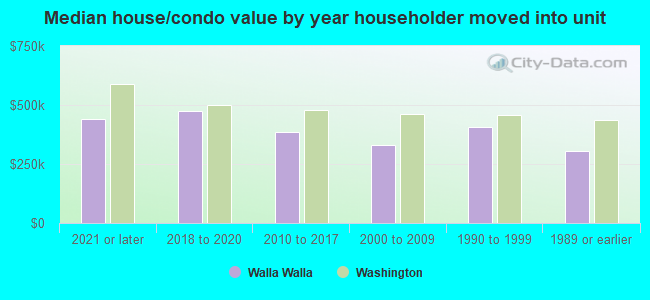
House/condo owner moved in on average (years ago)
Renter moved in on average (years ago)
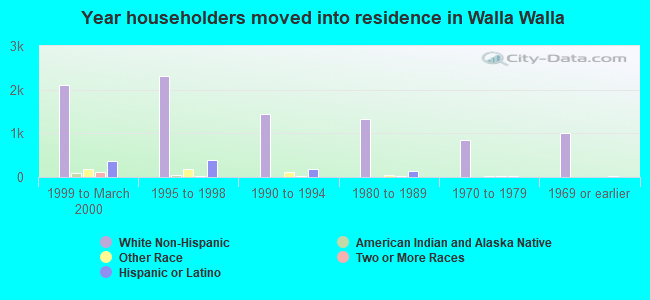
Year householder moved into unit - Moved in 1999 to March 2000 (%)
Year householder moved into unit - Moved in 1999 to March 2000 (%) - White
Year householder moved into unit - Moved in 1999 to March 2000 (%) - Black or African American
Year householder moved into unit - Moved in 1999 to March 2000 (%) - Asian
Year householder moved into unit - Moved in 1999 to March 2000 (%) - Hispanic or Latino
Year householder moved into unit - Moved in 1999 to March 2000 (%) - American Indian and Alaska Native
Year householder moved into unit - Moved in 1999 to March 2000 (%) - Multirace
Year householder moved into unit - Moved in 1999 to March 2000 (%) - Other Race
Year householder moved into unit - Moved in 1995 to 1998 (%)
Year householder moved into unit - Moved in 1995 to 1998 (%) - White
Year householder moved into unit - Moved in 1995 to 1998 (%) - Black or African American
Year householder moved into unit - Moved in 1995 to 1998 (%) - Asian
Year householder moved into unit - Moved in 1995 to 1998 (%) - Hispanic or Latino
Year householder moved into unit - Moved in 1995 to 1998 (%) - American Indian and Alaska Native
Year householder moved into unit - Moved in 1995 to 1998 (%) - Multirace
Year householder moved into unit - Moved in 1995 to 1998 (%) - Other Race
Year householder moved into unit - Moved in 1990 to 1994 (%)
Year householder moved into unit - Moved in 1990 to 1994 (%) - White
Year householder moved into unit - Moved in 1990 to 1994 (%) - Black or African American
Year householder moved into unit - Moved in 1990 to 1994 (%) - Asian
Year householder moved into unit - Moved in 1990 to 1994 (%) - Hispanic or Latino
Year householder moved into unit - Moved in 1990 to 1994 (%) - American Indian and Alaska Native
Year householder moved into unit - Moved in 1990 to 1994 (%) - Multirace
Year householder moved into unit - Moved in 1990 to 1994 (%) - Other Race
Year householder moved into unit - Moved in 1980 to 1989 (%)
Year householder moved into unit - Moved in 1980 to 1989 (%) - White
Year householder moved into unit - Moved in 1980 to 1989 (%) - Black or African American
Year householder moved into unit - Moved in 1980 to 1989 (%) - Asian
Year householder moved into unit - Moved in 1980 to 1989 (%) - Hispanic or Latino
Year householder moved into unit - Moved in 1980 to 1989 (%) - American Indian and Alaska Native
Year householder moved into unit - Moved in 1980 to 1989 (%) - Multirace
Year householder moved into unit - Moved in 1980 to 1989 (%) - Other Race
Year householder moved into unit - Moved in 1970 to 1979 (%)
Year householder moved into unit - Moved in 1970 to 1979 (%) - White
Year householder moved into unit - Moved in 1970 to 1979 (%) - Black or African American
Year householder moved into unit - Moved in 1970 to 1979 (%) - Asian
Year householder moved into unit - Moved in 1970 to 1979 (%) - Hispanic or Latino
Year householder moved into unit - Moved in 1970 to 1979 (%) - American Indian and Alaska Native
Year householder moved into unit - Moved in 1970 to 1979 (%) - Multirace
Year householder moved into unit - Moved in 1970 to 1979 (%) - Other Race
Year householder moved into unit - Moved in 1969 or earlier (%)
Year householder moved into unit - Moved in 1969 or earlier (%) - White
Year householder moved into unit - Moved in 1969 or earlier (%) - Black or African American
Year householder moved into unit - Moved in 1969 or earlier (%) - Asian
Year householder moved into unit - Moved in 1969 or earlier (%) - Hispanic or Latino
Year householder moved into unit - Moved in 1969 or earlier (%) - American Indian and Alaska Native
Year householder moved into unit - Moved in 1969 or earlier (%) - Multirace
Year householder moved into unit - Moved in 1969 or earlier (%) - Other Race
Housing units lacking complete plumbing facilities (%)
Housing units lacking complete kitchen facilities (%)
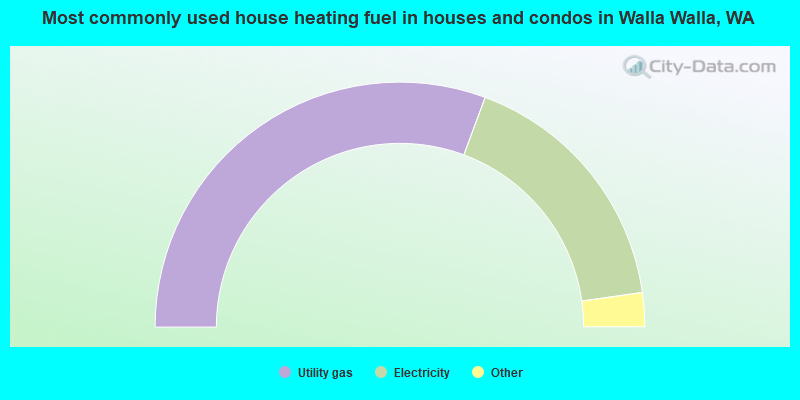
House heating fuel used in houses and condos - Utility gas (%)
House heating fuel used in houses and condos - Bottled, tank, or LP gas (%)
House heating fuel used in houses and condos - Electricity (%)
House heating fuel used in houses and condos - Fuel oil, kerosene, etc. (%)
House heating fuel used in houses and condos - Coal or coke (%)
House heating fuel used in houses and condos - Wood (%)
House heating fuel used in houses and condos - Solar energy (%)
House heating fuel used in houses and condos - Other fuel (%)
House heating fuel used in houses and condos - No fuel used (%)
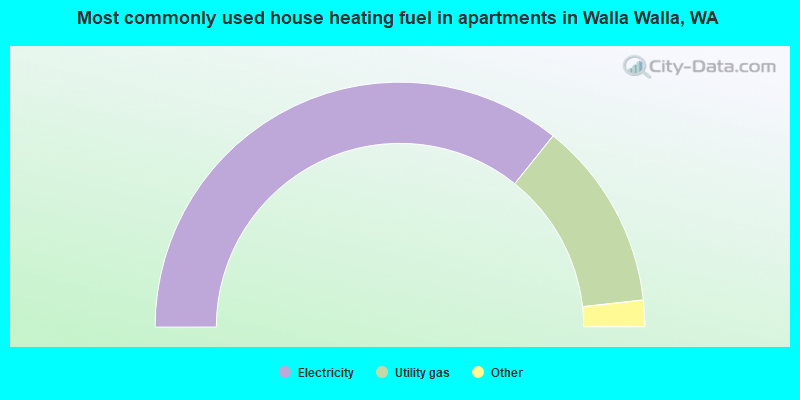
House heating fuel used in apartments - Utility gas (%)
House heating fuel used in apartments - Bottled, tank, or LP gas (%)
House heating fuel used in apartments - Electricity (%)
House heating fuel used in apartments - Fuel oil, kerosene, etc. (%)
House heating fuel used in apartments - Coal or coke (%)
House heating fuel used in apartments - Wood (%)
House heating fuel used in apartments - Solar energy (%)
House heating fuel used in apartments - Other fuel (%)
House heating fuel used in apartments - No fuel used (%)
Median year house/condo built: 1962Median year apartment built: 1972Household type by relationship:
Households: 34,269
Male householders: 5,582 (1,649 living alone ), Female householders: 7,444 (3,212 living alone )5,137 spouses (5,084 opposite-sex spouses ), 894 unmarried partners , (845 opposite-sex unmarried partners ), 8,672 children (8,219 natural , 213 adopted , 238 stepchildren ), 662 grandchildren , 168 brothers or sisters , 324 parents , 9 foster children , 369 other relatives , 1,459 non-relatives In group quarters: 3,546
Size of family households: 3,122 2-persons , 1,660 3-persons , 1,204 4-persons , 912 5-persons , 277 6-persons , 73 7-or-more-persons .
Size of nonfamily households: 5,131 1-person , 763 2-persons , 172 3-persons , 24 4-persons , 13 5-persons .
3,505 married couples with children. single-parent households (722 men , 1,606 women ).
78.8% of residents of Walla Walla speak English at home. of residents speak Spanish at home (61% speak English very well , 17% speak English well , 18% speak English not well , 3% don't speak English at all ).of residents speak other Indo-European language at home (75% speak English very well , 15% speak English well , 10% speak English not well ).of residents speak Asian or Pacific Island language at home (63% speak English very well , 32% speak English well , 4% speak English not well , 1% don't speak English at all ).of residents speak other language at home (98% speak English very well , 2% speak English well ).
Foreign born population: 3,644 (10.6%)of them are naturalized citizens )
Median number of rooms in houses and condos:
Median number of rooms in apartments
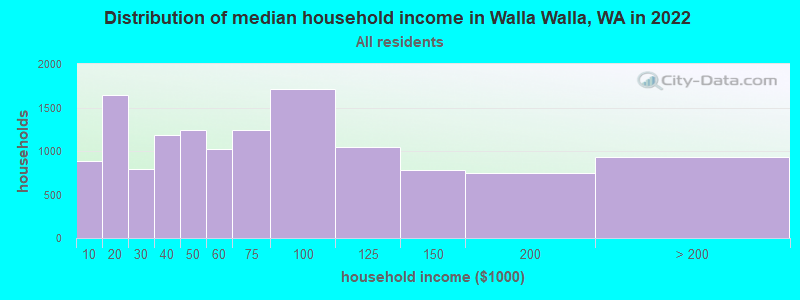
Walla Walla, WA household income distribution 888 Less than $10,0001,641 $10,000 to $19,999790 $20,000 to $29,9991,181 $30,000 to $39,9991,242 $40,000 to $49,9991,025 $50,000 to $59,9991,241 $60,000 to $74,9991,714 $75,000 to $99,9991,043 $100,000 to $124,999781 $125,000 to $149,999752 $150,000 to $199,999936 $200,000 or more
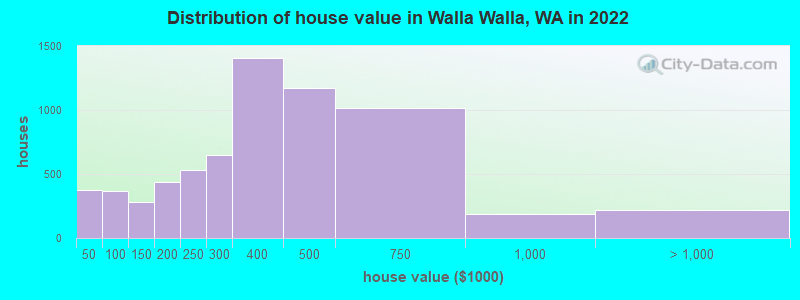
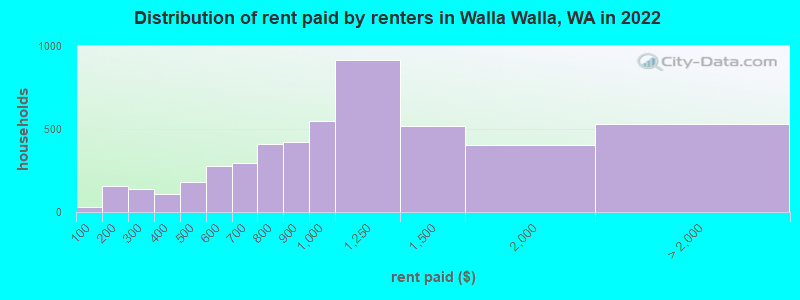
Home value of owner - occupied houses in 2022 in Walla Walla, WA 191 Less than $10,00073 $15,000 to $19,99916 $20,000 to $24,9998 $25,000 to $29,99915 $30,000 to $34,99969 $40,000 to $49,99952 $50,000 to $59,99946 $60,000 to $69,999101 $70,000 to $79,99960 $80,000 to $89,99935 $90,000 to $99,999150 $100,000 to $124,999127 $125,000 to $149,999176 $150,000 to $174,999264 $175,000 to $199,999527 $200,000 to $249,999648 $250,000 to $299,9991,406 $300,000 to $399,9991,169 $400,000 to $499,9991,016 $500,000 to $749,999185 $750,000 to $999,999143 $1,000,000 to $1,499,99919 $1,500,000 to $1,999,99954 $2,000,000 or moreRent paid by renters in 2022 in Walla Walla, WA 29 Less than $100158 $150 to $19975 $200 to $24965 $250 to $29991 $300 to $34919 $350 to $399108 $400 to $44973 $450 to $499230 $500 to $54947 $550 to $599225 $600 to $64970 $650 to $699163 $700 to $749243 $750 to $799421 $800 to $899545 $900 to $999915 $1,000 to $1,249516 $1,250 to $1,499402 $1,500 to $1,999268 $2,000 to $2,499106 $2,500 to $2,99920 $3,000 to $3,4995 $3,500 or more128 No cash rent
Percentage of workers working in this county: 96.8%Number of people working at home: 2,479 (16.2% of all workers )
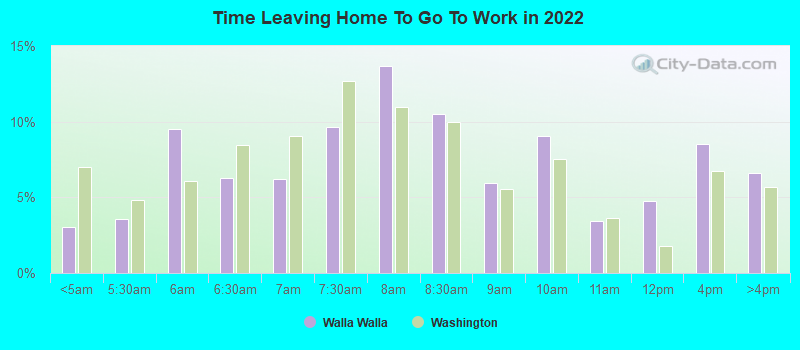
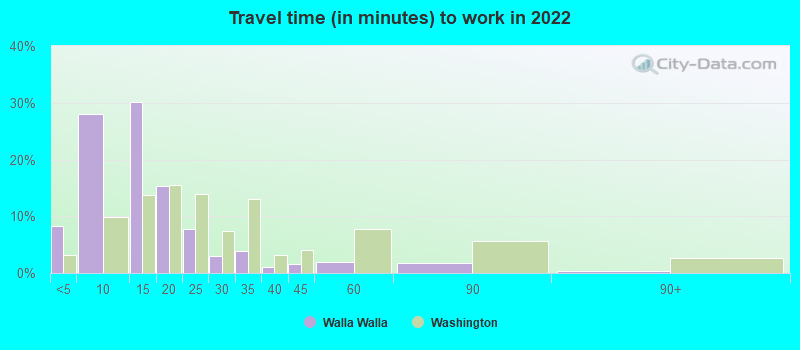
Travel time to work (commute)
Less than 5 minutes: 1,4605 to 9 minutes: 4,31210 to 14 minutes: 4,20615 to 19 minutes: 1,47320 to 24 minutes: 46825 to 29 minutes: 10530 to 34 minutes: 34235 to 39 minutes: 17940 to 44 minutes: 6945 to 59 minutes: 11460 to 89 minutes: 29790 or more minutes: 97
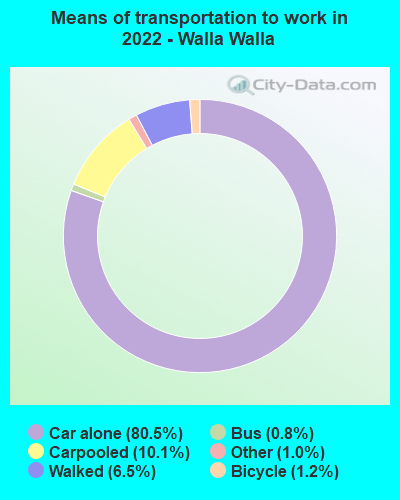
Means of transportation to work:
Drove a car alone: 15,005 (69.9%)Carpooled: 1,940 (9.0%)Bus : 95 (0.4%)Light rail, streetcar or trolley : 2 (0.0%)Taxi: 172 (0.8%)Bicycle: 202 (0.9%)Walked: 1,236 (5.8%)Worked at home: 2,479 (11.6%)
Unemployment by race in 2022
Unemployment rate for White non-Hispanic residents 3.5% Males4.1% FemalesUnemployment rate for American Indian and Alaska Native residents 74.6% FemalesUnemployment rate for Asian residents 11.5% Males6.9% FemalesUnemployment rate for other race residents 7.1% MalesUnemployment rate for two or more race residents 3.9% Males7.8% FemalesUnemployment rate for Hispanic or Latino residents 10.2% Males9.5% Females
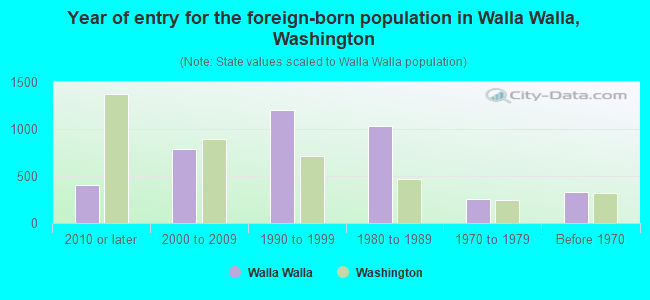
Year of entry for the foreign-born population in Walla Walla, Washington
404 2010 or later 787 2000 to 2009 1,204 1990 to 1999 1,032 1980 to 1989 254 1970 to 1979 332 Before 1970
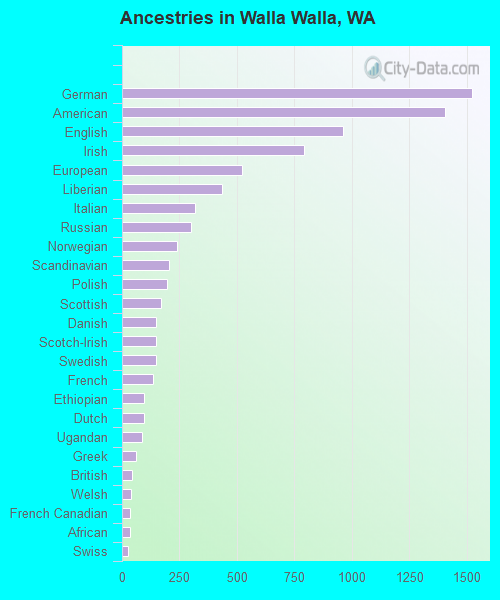
First ancestries reported:
German: 1,520 (9.5%)
American: 1,406 (8.7%)
English: 961 (6.0%)
Irish: 793 (4.9%)
European: 524 (3.3%)
Liberian: 437 (2.7%)
Italian: 319 (2.0%)
Russian: 300 (1.9%)
Norwegian: 240 (1.5%)
Scandinavian: 204 (1.3%)
Polish: 197 (1.2%)
Scottish: 168 (1.0%)
Danish: 149 (0.9%)
Scotch-Irish: 147 (0.9%)
Swedish: 147 (0.9%)
French: 134 (0.8%)
Ethiopian: 95 (0.6%)
Dutch: 94 (0.6%)
Ugandan: 86 (0.5%)
Greek: 61 (0.4%)
British: 43 (0.3%)
Welsh: 40 (0.2%)
French Canadian: 34 (0.2%)
African: 33 (0.2%)
Swiss: 27 (0.2%)
Eastern European: 25 (0.2%)
Yugoslavian: 24 (0.1%)
Canadian: 22 (0.1%)
Finnish: 21 (0.1%)
Northern European: 14 (0.09%)
Ukrainian: 14 (0.09%)
Czech: 14 (0.09%)
Estonian: 12 (0.07%)
Czechoslovakian: 12 (0.07%)
Portuguese: 11 (0.07%)
Turkish: 11 (0.07%)
Lithuanian: 10 (0.06%)
New Zealander: 9 (0.06%)
Kenyan: 2 (0.01%) Most common places of birth for foreign-born residents (%): Mexico Walla Walla:
43.3% (1,579)Washington:
21.1% (241,655)
Liberia Walla Walla:
10.5% (381)Washington:
0.1% (1,150)
Other Eastern Europe Walla Walla:
6.3% (229)Washington:
0.3% (3,673)
China, excluding Hong Kong and Taiwan Walla Walla:
5.3% (194)Washington:
7.4% (84,470)
El Salvador Walla Walla:
5.3% (194)Washington:
1.2% (13,745)
Ethiopia Walla Walla:
2.7% (98)Washington:
1.6% (17,938)
Korea Walla Walla:
2.5% (92)Washington:
4.3% (48,886)
India Walla Walla:
2.3% (83)Washington:
8.9% (101,353)
Canada Walla Walla:
2.3% (83)Washington:
4.1% (47,238)
Peru Walla Walla:
2.2% (79)Washington:
0.4% (4,914)
Germany Walla Walla:
1.9% (68)Washington:
1.6% (17,761)
Place of birth for U.S.-born residents:
This state: 16,394Other state: 12,938Northeast: 869Midwest: 2,171South: 1,842West: 8,054 82.1% of Walla Walla residents lived in the same house 1 years ago.
Out of people who lived in different houses, 29.9% lived in this county.
Out of people who lived in different counties, 64.1% lived in Washington.
Walla Walla:
82.1%State average:
85.2%
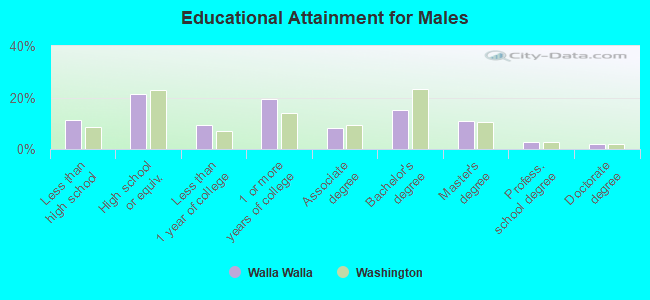
Education attainment for males 25 years and older:
No schooling: 127Nursery to 4th grade: 795th and 6th grade: 697th and 8th grade: 1199th grade: 9810th grade: 34111th grade: 24812th grade, no diploma: 269High school graduate (or equivalency): 2,537Less than 1 year of college: 1,095Some college more than 1 year, no degree: 2,284Associate degree: 957Bachelor's degree: 1,778Master's degree: 1,267Professional school degree: 318Doctorate degree: 231
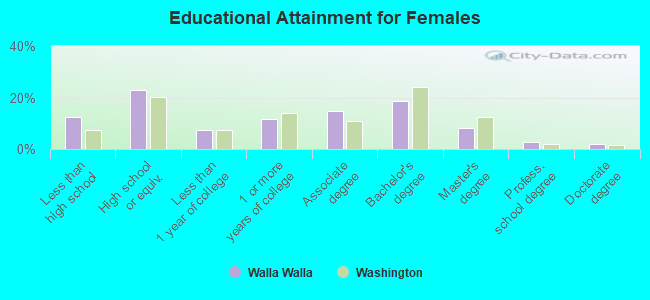
Education attainment for females 25 years and older:
No schooling: 319Nursery to 4th grade: 1495th and 6th grade: 247th and 8th grade: 1939th grade: 5710th grade: 6211th grade: 11812th grade, no diploma: 412High school graduate (or equivalency): 2,487Less than 1 year of college: 813Some college more than 1 year, no degree: 1,251Associate degree: 1,602Bachelor's degree: 2,015Master's degree: 898Professional school degree: 284Doctorate degree: 191
Housing units in structures:
One, detached: 9,663One, attached: 657Two: 4733 or 4: 6095 to 9: 94810 to 19: 23320 to 49: 65050 or more: 747Mobile homes: 392Boats, RVs, vans, etc.: 59Median worth of mobile homes: $73,614
Housing units lacking complete plumbing facilities in 2022: 0.5%Housing units lacking complete kitchen facilities in 2022: 4.2%House/condo owner moved in on average 12 years ago
Renter moved in on average 4 years ago
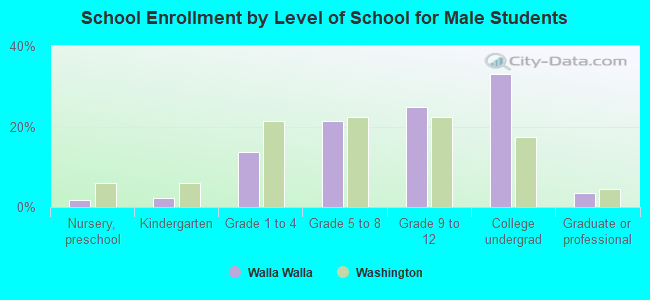
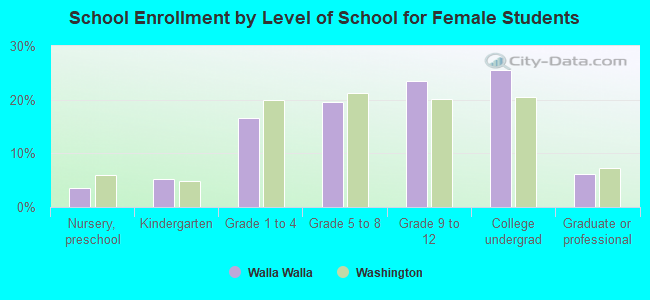
Private vs. public school enrollment:
Students in private schools in grades 1 to 8 (elementary and middle school): 43 Here:
1.3%Washington:
12.4%
Students in private schools in grades 9 to 12 (high school): 42 Students in private undergraduate colleges: 1,190 Here:
44.4%Washington:
16.5%