Housing density: 970 houses/condos per square mile
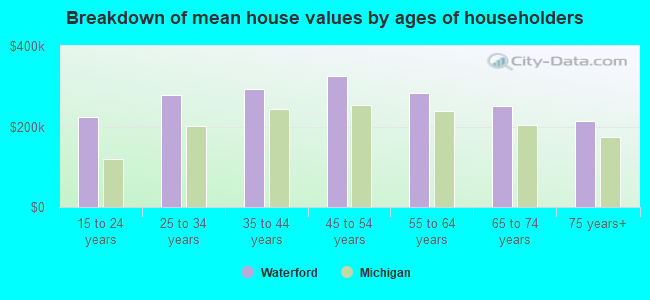
Median price asked for vacant for-sale houses and condos in 2022 in this county: $461,051.
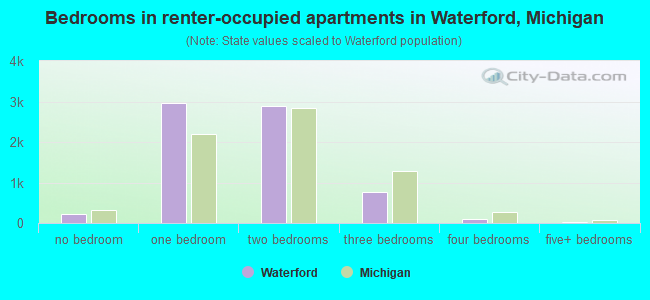
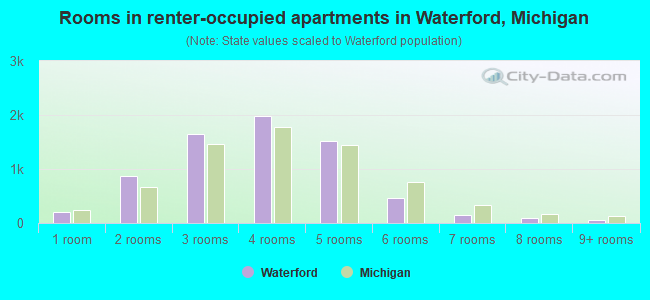
Median contract rent in 2022: $977 (lower quartile is $796, upper quartile is $1,203)
Median rent asked for vacant for-rent units in 2022: $1,069
Median gross rent in Waterford, MI in 2022: $1,105
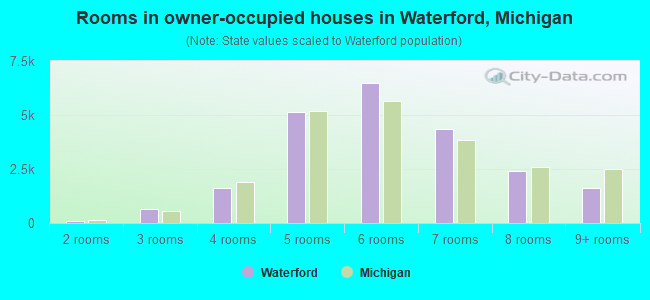
Housing units in Waterford with a mortgage: 16,385 (1,252 second mortgage, 2,708 home equity loan, 33 both second mortgage and home equity loan) Houses without a mortgage: 4,529
In family households: 991,308 (229,879 male householders, 88,273 female householders)
245,359 spouses, 357,851 children (336,608 natural, 9,065 adopted, 12,178 stepchildren), 17,232 grandchildren, 9,916 brothers or sisters, 9,607 parents, foster children, 9,514 other relatives, 18,102 non-relatives
In nonfamily households: 198,558 (74,525 male householders (58,779 living alone)), 91,021 female householders (79,609 living alone)), 33,012 nonrelatives
In group quarters: 12,496 (6,064 institutionalized population)
230,851 married couples with children.
50,553 single-parent households (10,503 men, 40,050 women).
92.5% of residents of Waterford speak English at home.
2.5% of residents speak Spanish at home (66% speak English very well, 17% speak English well, 10% speak English not well, 8% don't speak English at all).
3.2% of residents speak other Indo-European language at home (68% speak English very well, 19% speak English well, 12% speak English not well, 1% don't speak English at all).
1.0% of residents speak Asian or Pacific Island language at home (58% speak English very well, 30% speak English well, 8% speak English not well, 4% don't speak English at all).
0.9% of residents speak other language at home (85% speak English very well, 12% speak English well, 2% speak English not well, 1% don't speak English at all).
Foreign born population: 5,118 (6.6%)
(52.0% of them are naturalized citizens)
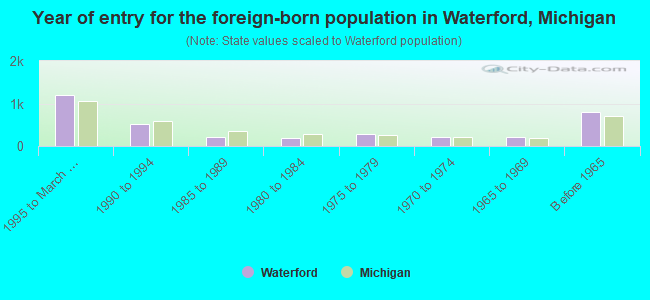
Year of entry for the foreign-born population in Waterford, Michigan
1,1991995 to March 2000
5241990 to 1994
2191985 to 1989
1951980 to 1984
2861975 to 1979
2051970 to 1974
2171965 to 1969
802Before 1965
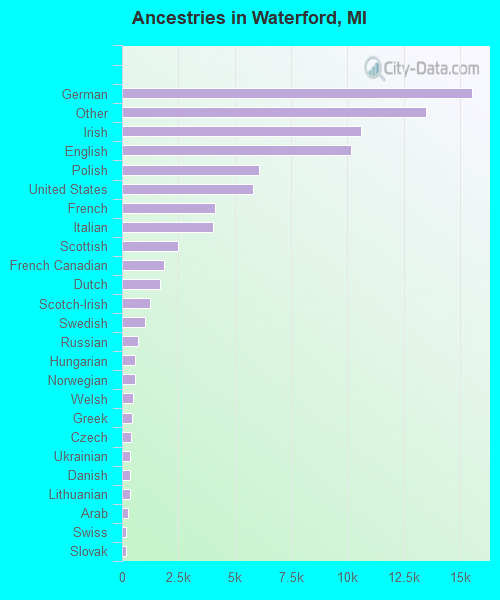
First ancestries reported:
German: 15,514 (18.7%)
Other: 13,504 (16.2%)
Irish: 10,595 (12.7%)
English: 10,169 (12.2%)
Polish: 6,070 (7.3%)
United States: 5,828 (7.0%)
French: 4,119 (5.0%)
Italian: 4,032 (4.8%)
Scottish: 2,474 (3.0%)
French Canadian: 1,866 (2.2%)
Dutch: 1,669 (2.0%)
Scotch-Irish: 1,237 (1.5%)
Swedish: 1,015 (1.2%)
Russian: 710 (0.9%)
Hungarian: 593 (0.7%)
Norwegian: 568 (0.7%)
Welsh: 477 (0.6%)
Greek: 457 (0.5%)
Czech: 383 (0.5%)
Ukrainian: 370 (0.4%)
Danish: 348 (0.4%)
Lithuanian: 339 (0.4%)
Arab: 259 (0.3%)
Swiss: 170 (0.2%)
Slovak: 161 (0.2%)
Subsaharan African: 156 (0.2%)
West Indian: 68 (0.08%)
Most common places of birth for foreign-born residents (%):
Canada
Waterford:
15.4% (563)
Michigan:
9.5% (49,515)
Mexico
Waterford:
13.6% (497)
Michigan:
11.2% (58,392)
United Kingdom
Waterford:
9.8% (357)
Michigan:
3.9% (20,614)
Other Eastern Europe
Waterford:
9.4% (341)
Michigan:
2.9% (14,958)
Iraq
Waterford:
5.0% (183)
Michigan:
6.1% (31,927)
Germany
Waterford:
4.9% (180)
Michigan:
4.4% (22,814)
India
Waterford:
4.4% (159)
Michigan:
6.9% (36,323)
Poland
Waterford:
3.7% (134)
Michigan:
2.9% (15,303)
Korea
Waterford:
3.6% (132)
Michigan:
3.5% (18,107)
Philippines
Waterford:
2.8% (103)
Michigan:
2.6% (13,679)
Russia
Waterford:
2.7% (98)
Michigan:
1.3% (6,817)
Vietnam
Waterford:
2.2% (79)
Michigan:
2.1% (10,869)
Romania
Waterford:
1.9% (68)
Michigan:
1.6% (8,579)
Place of birth for U.S.-born residents:
This state: 56,731
Other state: 12,482
Northeast: 2,019
Midwest: 5,010
South: 4,203
West: 1,250
55% of Waterford residents lived in the same house 5 years ago. Out of people who lived in different houses, 73% lived in this county. Out of people who lived in different counties, 62% lived in Michigan.
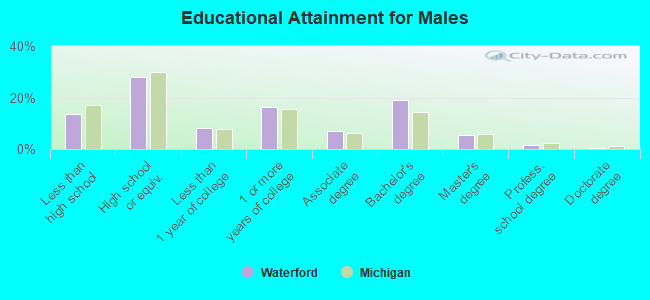
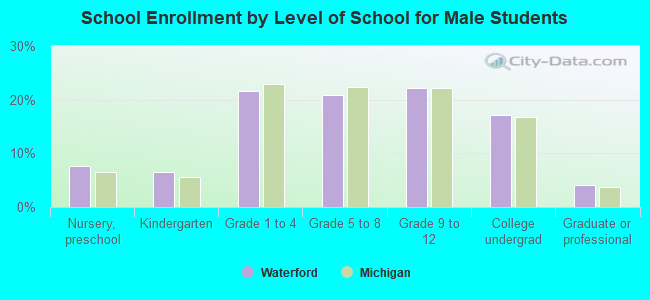
Education attainment for males 25 years and older:
No schooling: 199
Nursery to 4th grade: 29
5th and 6th grade: 137
7th and 8th grade: 369
9th grade: 411
10th grade: 591
11th grade: 790
12th grade, no diploma: 841
High school graduate (or equivalency): 6,864
Less than 1 year of college: 2,012
Some college more than 1 year, no degree: 4,015
Associate degree: 1,693
Bachelor's degree: 4,664
Master's degree: 1,376
Professional school degree: 365
Doctorate degree: 103
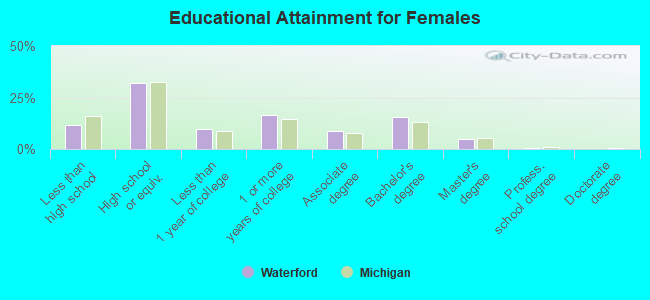
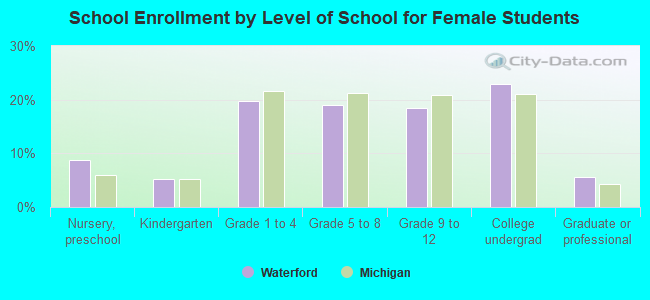
Education attainment for females 25 years and older:
No schooling: 55
Nursery to 4th grade: 23
5th and 6th grade: 103
7th and 8th grade: 415
9th grade: 438
10th grade: 561
11th grade: 701
12th grade, no diploma: 751
High school graduate (or equivalency): 8,291
Less than 1 year of college: 2,502
Some college more than 1 year, no degree: 4,189
Associate degree: 2,216
Bachelor's degree: 4,020
Master's degree: 1,257
Professional school degree: 174
Doctorate degree: 55
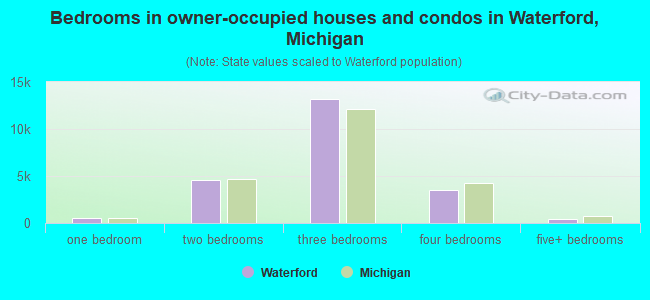
Housing units in structures:
One, detached: 22,469
One, attached: 1,206
Two: 222
3 or 4: 730
5 to 9: 1,563
10 to 19: 1,952
20 to 49: 843
50 or more: 1,201
Mobile homes: 191
Boats, RVs, vans, etc.: 6
Median worth of mobile homes: $11,237
Housing units lacking complete plumbing facilities: 0.2%
Housing units lacking complete kitchen facilities: 0.8%