The median household income in Abilene, TX in 2022 was $61,694, which was 17.2% less than the median annual income of $72,284 across the entire state of Texas. Compared to the median income of $33,007 in 2000 this represents an increase of 46.5%. The per capita income in 2022 was $28,917, which means an increase of 42.7% compared to 2000 when it was $16,577.
Whole page based on the data from 2000 / 2022 when the population of Abilene, Texas was 115,930 / 128,149
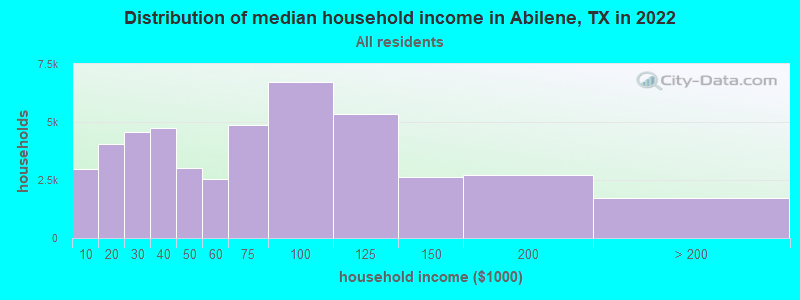
Income statistics for all residents
Median household income in Abilene, TX in 2022:
Abilene:
$61,694
State:
$72,284
Change in median household income between 2000 and 2022:
Abilene, Texas:
+86.9%
State:
+81.0%
Number of households with income < $10k:
Abilene:
6.4% (2,955)
State:
5.5% (611,011)
Number of households with income $10k - 20k:
Abilene:
8.9% (4,069)
State:
6.7% (743,157)
Number of households with income $20k - 30k:
Abilene:
9.9% (4,566)
State:
7.2% (803,381)
Number of households with income $30k - 40k:
Abilene:
10.3% (4,731)
State:
7.8% (866,080)
Number of households with income $40k - 50k:
Abilene:
6.6% (3,015)
Texas:
7.3% (810,440)
Number of households with income $50k - 60k:
Abilene:
5.6% (2,557)
Texas:
7.2% (799,783)
Number of households with income $60k - 75k:
Abilene:
10.6% (4,862)
State:
9.9% (1,095,384)
Number of households with income $75k - 100k:
Abilene:
14.6% (6,728)
State:
12.8% (1,419,057)
Number of households with income $100k - 125k:
Abilene:
11.6% (5,348)
State:
9.5% (1,054,577)
Number of households with income $125k - 150k:
Abilene:
5.8% (2,641)
State:
6.7% (741,518)
Number of households with income $150k - 200k:
Abilene:
5.9% (2,710)
State:
8.7% (961,776)
Number of households with income > $200k:
Abilene:
3.8% (1,744)
Texas:
10.7% (1,181,544)
Aggregate household income in Abilene in 2022: $3,560,865,600
Median family income in Abilene in 2022:
Abilene:
$80,923
State:
$86,267
Number of families with income < $10k:
Abilene:
5.6% (1,681)
State:
4.0% (297,884)
Number of families with income $10k - 20k:
Abilene:
6.3% (1,888)
State:
4.3% (324,514)
Number of families with income $20k - 30k:
Abilene:
5.3% (1,591)
State:
5.8% (430,949)
Number of families with income $30k - 40k:
Abilene:
9.5% (2,840)
Texas:
6.6% (493,535)
Number of families with income $40k - 50k:
Abilene:
5.4% (1,619)
Texas:
6.7% (499,663)
Number of families with income $50k - 60k:
Abilene:
5.1% (1,535)
Texas:
6.6% (492,203)
Number of families with income $60k - 75k:
Abilene:
10.6% (3,190)
Texas:
9.5% (710,229)
Number of families with income $75k - 100k:
Abilene:
19.3% (5,788)
State:
13.6% (1,015,480)
Number of families with income $100k - 125k:
Abilene:
11.5% (3,442)
Texas:
10.7% (797,961)
Number of families with income $125k - 150k:
Abilene:
7.9% (2,373)
State:
8.1% (602,985)
Number of families with income $150k - 200k:
Abilene:
8.2% (2,451)
State:
10.7% (804,459)
Number of families with income > $200k:
Abilene:
5.5% (1,637)
Texas:
13.5% (1,013,514)
Median non-family income in Abilene in 2022:
Abilene:
$35,923
State:
$45,999
Change in median non-family income between 2000 and 2022:
Abilene, Texas:
+79.6%
State:
+79.5%
Median per capita income in Abilene in 2022:
Abilene:
$28,917
Texas:
$38,123
Change in median per capita income between 2000 and 2022:
Abilene, Texas:
+74.4%
State:
+94.3%
Income statistics for White residents
Median household income in Abilene, TX in 2022:
Abilene:
$67,186
Texas:
$82,032
Change in median household income between 2000 and 2022:
Abilene, Texas:
+93.5%
State:
+91.0%
Number of households with income < $10k:
Abilene:
6.1% (1,914)
Texas:
4.7% (273,716)
Number of households with income $10k - 20k:
Abilene:
8.1% (2,541)
Texas:
5.5% (322,702)
Number of households with income $20k - 30k:
Abilene:
7.6% (2,386)
State:
6.2% (363,947)
Number of households with income $30k - 40k:
Abilene:
8.8% (2,777)
Texas:
6.8% (399,275)
Number of households with income $40k - 50k:
Abilene:
6.4% (2,019)
State:
6.5% (383,417)
Number of households with income $50k - 60k:
Abilene:
4.9% (1,530)
State:
6.6% (388,535)
Number of households with income $60k - 75k:
Abilene:
12.3% (3,863)
State:
9.7% (566,295)
Number of households with income $75k - 100k:
Abilene:
14.4% (4,529)
State:
13.0% (760,276)
Number of households with income $100k - 125k:
Abilene:
14.1% (4,420)
State:
10.2% (597,596)
Number of households with income $125k - 150k:
Abilene:
6.9% (2,170)
State:
7.4% (436,830)
Number of households with income $150k - 200k:
Abilene:
5.1% (1,598)
Texas:
9.9% (583,067)
Number of households with income > $200k:
Abilene:
5.2% (1,632)
Texas:
13.5% (792,647)
Aggregate household income in Abilene in 2022: $2,652,268,000
Median family income in Abilene in 2022:
Abilene:
$84,400
State:
$101,788
Number of families with income < $10k:
Abilene:
5.4% (1,121)
State:
2.8% (108,142)
Number of families with income $10k - 20k:
Abilene:
5.9% (1,232)
Texas:
2.9% (113,421)
Number of families with income $20k - 30k:
Abilene:
3.4% (715)
State:
4.1% (157,688)
Number of families with income $30k - 40k:
Abilene:
5.9% (1,233)
State:
5.2% (198,847)
Number of families with income $40k - 50k:
Abilene:
5.7% (1,186)
State:
5.6% (216,490)
Number of families with income $50k - 60k:
Abilene:
4.1% (867)
State:
5.7% (220,689)
Number of families with income $60k - 75k:
Abilene:
12.4% (2,593)
State:
9.0% (346,106)
Number of families with income $75k - 100k:
Abilene:
19.0% (3,982)
Texas:
13.7% (527,363)
Number of families with income $100k - 125k:
Abilene:
14.8% (3,102)
Texas:
11.6% (448,411)
Number of families with income $125k - 150k:
Abilene:
9.6% (2,012)
State:
9.2% (355,798)
Number of families with income $150k - 200k:
Abilene:
6.6% (1,373)
State:
12.5% (480,185)
Number of families with income > $200k:
Abilene:
7.3% (1,525)
State:
17.6% (677,490)
Median non-family income in Abilene in 2022:
Abilene:
$38,678
State:
$50,587
Change in median non-family income between 2000 and 2022:
Abilene, Texas:
+90.5%
State:
+87.7%
Median per capita income in Abilene in 2022:
Abilene:
$33,865
State:
$47,740
Change in median per capita income between 2000 and 2022:
Abilene, Texas:
+85.6%
Texas:
+114.3%
Income statistics for Black or African American residents
Median household income in Abilene, TX in 2022:
Abilene:
$39,258
State:
$55,759
Change in median household income between 2000 and 2022:
Abilene, Texas:
+51.5%
Texas:
+90.3%
Number of households with income < $10k:
Abilene:
7.9% (343)
State:
8.9% (126,378)
Number of households with income $10k - 20k:
Abilene:
13.1% (568)
State:
9.9% (140,369)
Number of households with income $20k - 30k:
Abilene:
7.4% (324)
Texas:
8.5% (120,639)
Number of households with income $30k - 40k:
Abilene:
13.8% (601)
Texas:
9.7% (137,517)
Number of households with income $40k - 50k:
Abilene:
10.0% (435)
Texas:
8.0% (112,973)
Number of households with income $50k - 60k:
Abilene:
9.4% (408)
State:
8.3% (117,156)
Number of households with income $60k - 75k:
Abilene:
11.1% (481)
Texas:
10.4% (147,462)
Number of households with income $75k - 100k:
Abilene:
10.1% (438)
State:
11.5% (162,718)
Number of households with income $100k - 125k:
Abilene:
8.3% (360)
Texas:
8.2% (115,829)
Number of households with income $125k - 150k:
Abilene:
3.5% (154)
State:
4.9% (69,556)
Number of households with income $150k - 200k:
Abilene:
4.7% (205)
Texas:
6.4% (90,701)
Number of households with income > $200k:
Abilene:
0.8% (33)
State:
5.5% (77,988)
Aggregate household income in Abilene in 2022: $325,224,500
Median family income in Abilene in 2022:
Abilene:
$92,685
State:
$69,134
Number of families with income < $10k:
Abilene:
6.8% (192)
State:
6.8% (55,625)
Number of families with income $10k - 20k:
Abilene:
7.6% (216)
State:
6.8% (55,300)
Number of families with income $20k - 30k:
Abilene:
10.2% (290)
State:
7.1% (57,877)
Number of families with income $30k - 40k:
Abilene:
13.8% (391)
Texas:
8.5% (68,776)
Number of families with income $40k - 50k:
Abilene:
5.8% (165)
Texas:
7.1% (57,907)
Number of families with income $50k - 60k:
Abilene:
7.9% (225)
State:
7.3% (59,511)
Number of families with income $60k - 75k:
Abilene:
14.8% (421)
State:
10.1% (81,994)
Number of families with income $75k - 100k:
Abilene:
10.2% (288)
State:
12.7% (103,723)
Number of families with income $100k - 125k:
Abilene:
10.1% (288)
State:
9.4% (76,609)
Number of families with income $125k - 150k:
Abilene:
4.4% (124)
State:
6.8% (55,615)
Number of families with income $150k - 200k:
Abilene:
7.2% (205)
Texas:
9.4% (76,146)
Number of families with income > $200k:
Abilene:
1.1% (32)
Texas:
7.9% (64,439)
Median non-family income in Abilene in 2022:
Abilene:
$30,004
State:
$40,133
Change in median non-family income between 2000 and 2022:
Abilene, Texas:
+51.4%
Texas:
+102.2%
Median per capita income in Abilene in 2022:
Abilene:
$23,108
State:
$30,490
Change in median per capita income between 2000 and 2022:
Abilene, Texas:
+91.8%
State:
+113.9%
Income statistics for Asian residents
Median household income in Abilene, TX in 2022:
Abilene:
$71,500
Texas:
$107,673
Change in median household income between 2000 and 2022:
Abilene, Texas:
+146.9%
Texas:
+115.1%
Number of households with income < $10k:
Abilene:
17.4% (163)
Texas:
5.2% (29,885)
Number of households with income $10k - 20k:
Abilene:
12.7% (119)
Texas:
4.7% (27,044)
Number of households with income $20k - 30k:
Abilene:
10.8% (101)
State:
4.1% (23,363)
Number of households with income $30k - 40k:
Abilene:
2.9% (27)
State:
4.1% (23,309)
Number of households with income $40k - 50k:
Abilene:
8.9% (83)
Texas:
5.2% (29,826)
Number of households with income $50k - 60k:
Abilene:
2.3% (22)
State:
4.7% (26,512)
Number of households with income $60k - 75k:
Abilene:
7.0% (66)
State:
6.5% (36,905)
Number of households with income $75k - 100k:
Abilene:
19.4% (182)
State:
11.3% (64,350)
Number of households with income $100k - 125k:
Abilene:
6.0% (56)
State:
11.4% (64,714)
Number of households with income $125k - 150k:
Abilene:
4.9% (46)
Texas:
9.3% (52,719)
Number of households with income $150k - 200k:
Abilene:
5.5% (52)
Texas:
12.5% (70,953)
Number of households with income > $200k:
Abilene:
2.1% (20)
State:
21.1% (120,260)
Aggregate household income in Abilene in 2022: $59,335,400
Median family income in Abilene in 2022:
Abilene:
$97,098
Texas:
$123,328
Number of families with income < $10k:
Abilene:
7.1% (36)
Texas:
3.1% (13,567)
Number of families with income $10k - 20k:
Abilene:
2.3% (12)
Texas:
3.0% (13,043)
Number of families with income $20k - 30k:
Abilene:
3.4% (17)
State:
3.4% (14,738)
Number of families with income $30k - 40k:
Abilene:
4.8% (24)
Texas:
3.4% (15,033)
Number of families with income $40k - 50k:
Abilene:
16.9% (85)
State:
4.9% (21,622)
Number of families with income $50k - 60k:
Abilene:
4.7% (24)
Texas:
4.7% (20,568)
Number of families with income $60k - 75k:
Abilene:
4.6% (23)
State:
6.1% (26,637)
Number of families with income $75k - 100k:
Abilene:
25.2% (127)
State:
10.7% (46,626)
Number of families with income $100k - 125k:
Abilene:
9.1% (46)
Texas:
11.3% (49,585)
Number of families with income $125k - 150k:
Abilene:
11.2% (56)
State:
9.8% (43,043)
Number of families with income $150k - 200k:
Abilene:
10.7% (54)
State:
14.7% (64,203)
Median non-family income in Abilene in 2022:
Abilene:
$2,499
State:
$64,320
Change in median non-family income between 2000 and 2022:: -88.2%
Abilene, Texas:
-88.2%
State:
+131.1%
Median per capita income in Abilene in 2022:
Abilene:
$23,218
State:
$48,626
Change in median per capita income between 2000 and 2022:
Abilene, Texas:
+76.1%
Texas:
+132.0%
Income statistics for Hispanic or Latino residents
Median household income in Abilene, TX in 2022:
Abilene:
$53,693
State:
$60,504
Change in median household income between 2000 and 2022:
Abilene, Texas:
+100.5%
State:
+102.5%
Number of households with income < $10k:
Abilene:
5.3% (519)
State:
5.8% (213,953)
Number of households with income $10k - 20k:
Abilene:
11.6% (1,142)
Texas:
8.0% (297,456)
Number of households with income $20k - 30k:
Abilene:
11.5% (1,132)
State:
9.2% (340,166)
Number of households with income $30k - 40k:
Abilene:
13.2% (1,304)
State:
9.5% (354,336)
Number of households with income $40k - 50k:
Abilene:
6.8% (669)
Texas:
8.8% (327,013)
Number of households with income $50k - 60k:
Abilene:
9.8% (962)
State:
8.3% (308,818)
Number of households with income $60k - 75k:
Abilene:
9.3% (921)
State:
10.9% (405,109)
Number of households with income $75k - 100k:
Abilene:
14.6% (1,436)
Texas:
13.8% (511,639)
Number of households with income $100k - 125k:
Abilene:
6.8% (669)
Texas:
8.6% (319,728)
Number of households with income $125k - 150k:
Abilene:
1.8% (179)
State:
5.7% (210,932)
Number of households with income $150k - 200k:
Abilene:
8.6% (848)
State:
6.4% (236,055)
Number of households with income > $200k:
Abilene:
0.8% (83)
State:
5.1% (189,259)
Aggregate household income in Abilene in 2022: $630,999,900
Median family income in Abilene in 2022:
Abilene:
$54,084
State:
$65,080
Number of families with income < $10k:
Abilene:
3.7% (274)
State:
5.3% (147,493)
Number of families with income $10k - 20k:
Abilene:
10.7% (787)
Texas:
6.3% (174,531)
Number of families with income $20k - 30k:
Abilene:
12.6% (928)
State:
8.6% (238,528)
Number of families with income $30k - 40k:
Abilene:
17.3% (1,271)
State:
9.1% (251,999)
Number of families with income $40k - 50k:
Abilene:
3.7% (275)
State:
8.6% (240,188)
Number of families with income $50k - 60k:
Abilene:
11.9% (877)
State:
8.0% (223,566)
Number of families with income $60k - 75k:
Abilene:
7.3% (539)
Texas:
10.9% (302,688)
Number of families with income $75k - 100k:
Abilene:
13.2% (970)
State:
14.3% (398,554)
Number of families with income $100k - 125k:
Abilene:
4.7% (346)
Texas:
9.5% (264,007)
Number of families with income $125k - 150k:
Abilene:
2.9% (213)
State:
6.2% (171,274)
Number of families with income $150k - 200k:
Abilene:
11.1% (814)
Texas:
7.3% (202,259)
Number of families with income > $200k:
Abilene:
0.9% (65)
State:
5.9% (165,129)
Median non-family income in Abilene in 2022:
Abilene:
$35,197
State:
$39,934
Change in median non-family income between 2000 and 2022:
Abilene, Texas:
+105.4%
State:
+109.1%
Median per capita income in Abilene in 2022:
Abilene:
$18,600
Texas:
$24,862
Change in median per capita income between 2000 and 2022:
Abilene, Texas:
+94.1%
State:
+130.8%
Income statistics for American Indian and Alaska Native residents
Median household income in Abilene, TX in 2022:
Abilene:
$61,916
State:
$65,765
Change in median household income between 2000 and 2022:
Abilene, Texas:
+79.7%
Texas:
+88.3%
Number of households with income < $10k:
Abilene:
2.3% (3)
State:
4.1% (3,398)
Number of households with income $10k - 20k:
Abilene:
7.0% (9)
Texas:
8.3% (6,949)
Number of households with income $20k - 30k:
Abilene:
0.0% (0)
State:
9.3% (7,742)
Number of households with income $30k - 40k:
Abilene:
21.9% (28)
State:
9.1% (7,627)
Number of households with income $40k - 50k:
Abilene:
21.1% (27)
State:
7.1% (5,922)
Number of households with income $50k - 60k:
Abilene:
0.0% (0)
State:
8.1% (6,761)
Number of households with income $60k - 75k:
Abilene:
21.9% (28)
State:
12.7% (10,588)
Number of households with income $75k - 100k:
Abilene:
13.3% (17)
State:
13.0% (10,903)
Number of households with income $100k - 125k:
Abilene:
0.0% (0)
Texas:
9.9% (8,256)
Number of households with income $125k - 150k:
Abilene:
0.0% (0)
Texas:
5.2% (4,355)
Number of households with income $150k - 200k:
Abilene:
12.5% (16)
Texas:
6.7% (5,623)
Number of households with income > $200k:
Abilene:
0.0% (0)
Texas:
6.6% (5,522)
Aggregate household income in Abilene in 2022: $8,185,106
Median per capita income in Abilene in 2022:
Abilene:
$21,363
Texas:
$28,166
Change in median per capita income between 2000 and 2022:
Abilene, Texas:
+6.2%
State:
+77.2%
Income statistics for Multirace residents
Median household income in Abilene, TX in 2022:
Abilene:
$48,242
State:
$62,748
Change in median household income between 2000 and 2022:
Abilene, Texas:
+66.2%
Texas:
+92.3%
Number of households with income < $10k:
Abilene:
6.3% (454)
State:
5.5% (122,324)
Number of households with income $10k - 20k:
Abilene:
11.1% (795)
State:
8.2% (182,232)
Number of households with income $20k - 30k:
Abilene:
9.6% (687)
Texas:
8.5% (189,456)
Number of households with income $30k - 40k:
Abilene:
16.3% (1,170)
State:
8.9% (197,499)
Number of households with income $40k - 50k:
Abilene:
10.3% (737)
Texas:
8.7% (191,735)
Number of households with income $50k - 60k:
Abilene:
5.4% (387)
State:
8.0% (177,535)
Number of households with income $60k - 75k:
Abilene:
9.9% (710)
State:
10.5% (232,479)
Number of households with income $75k - 100k:
Abilene:
10.9% (780)
State:
13.1% (290,448)
Number of households with income $100k - 125k:
Abilene:
7.7% (555)
State:
8.6% (191,595)
Number of households with income $125k - 150k:
Abilene:
2.5% (176)
State:
6.0% (133,361)
Number of households with income $150k - 200k:
Abilene:
8.9% (639)
Texas:
7.2% (159,195)
Number of households with income > $200k:
Abilene:
1.1% (77)
State:
6.7% (148,064)
Aggregate household income in Abilene in 2022: $454,770,200
Median family income in Abilene in 2022:
Abilene:
$43,514
State:
$69,780
Number of families with income < $10k:
Abilene:
3.8% (182)
Texas:
4.4% (70,825)
Number of families with income $10k - 20k:
Abilene:
4.7% (230)
Texas:
5.9% (95,279)
Number of families with income $20k - 30k:
Abilene:
15.9% (773)
State:
7.8% (126,627)
Number of families with income $30k - 40k:
Abilene:
20.9% (1,012)
State:
8.5% (137,626)
Number of families with income $40k - 50k:
Abilene:
6.3% (305)
State:
8.4% (135,809)
Number of families with income $50k - 60k:
Abilene:
7.9% (382)
State:
7.9% (127,739)
Number of families with income $60k - 75k:
Abilene:
9.4% (454)
State:
10.5% (169,549)
Number of families with income $75k - 100k:
Abilene:
8.3% (402)
State:
14.0% (226,284)
Number of families with income $100k - 125k:
Abilene:
4.5% (217)
Texas:
9.5% (153,597)
Number of families with income $125k - 150k:
Abilene:
4.3% (210)
State:
6.7% (107,900)
Number of families with income $150k - 200k:
Abilene:
12.5% (605)
State:
8.5% (137,607)
Number of families with income > $200k:
Abilene:
1.6% (77)
State:
7.9% (127,299)
Median non-family income in Abilene in 2022:
Abilene:
$31,488
State:
$40,634
Change in median non-family income between 2000 and 2022:
Abilene, Texas:
+125.6%
State:
+77.2%
Median per capita income in Abilene in 2022:
Abilene:
$20,337
Texas:
$26,785
Income statistics for other residents
Median household income in Abilene, TX in 2022:
Abilene:
$37,184
State:
$57,114
Number of households with income < $10k:
Abilene:
6.3% (240)
State:
5.9% (54,162)
Number of households with income $10k - 20k:
Abilene:
12.6% (476)
Texas:
6.8% (62,891)
Number of households with income $20k - 30k:
Abilene:
10.7% (404)
State:
10.6% (97,294)
Number of households with income $30k - 40k:
Abilene:
12.2% (461)
State:
10.8% (99,670)
Number of households with income $40k - 50k:
Abilene:
6.6% (249)
State:
9.3% (85,548)
Number of households with income $50k - 60k:
Abilene:
6.7% (255)
Texas:
9.0% (82,757)
Number of households with income $60k - 75k:
Abilene:
15.7% (593)
State:
10.9% (100,326)
Number of households with income $75k - 100k:
Abilene:
15.5% (588)
Texas:
14.0% (128,767)
Number of households with income $100k - 125k:
Abilene:
9.6% (364)
Texas:
8.2% (75,218)
Number of households with income $125k - 150k:
Abilene:
1.7% (66)
State:
4.8% (44,223)
Number of households with income $150k - 200k:
Abilene:
2.3% (87)
Texas:
5.6% (51,376)
Number of households with income > $200k:
Abilene:
0.0% (0)
State:
4.0% (36,393)
Aggregate household income in Abilene in 2022: $57,613,500
Median family income in Abilene in 2022:
Abilene:
$37,239
State:
$60,064
Number of families with income < $10k:
Abilene:
8.3% (196)
State:
6.8% (47,502)
Number of families with income $10k - 20k:
Abilene:
12.4% (291)
Texas:
6.0% (41,763)
Number of families with income $20k - 30k:
Abilene:
8.6% (201)
Texas:
9.9% (68,761)
Number of families with income $30k - 40k:
Abilene:
13.0% (306)
Texas:
9.7% (67,685)
Number of families with income $40k - 50k:
Abilene:
6.8% (159)
Texas:
9.0% (62,441)
Number of families with income $50k - 60k:
Abilene:
6.8% (160)
State:
8.5% (59,321)
Number of families with income $60k - 75k:
Abilene:
8.6% (203)
State:
11.2% (77,588)
Number of families with income $75k - 100k:
Abilene:
19.8% (466)
State:
14.5% (101,032)
Number of families with income $100k - 125k:
Abilene:
9.4% (221)
State:
8.8% (61,439)
Number of families with income $125k - 150k:
Abilene:
2.7% (64)
State:
5.1% (35,727)
Number of families with income $150k - 200k:
Abilene:
3.6% (85)
State:
5.9% (41,211)
Median non-family income in Abilene in 2022:
Abilene:
$47,658
State:
$38,690
Median per capita income in Abilene in 2022:
Abilene:
$14,754
Texas:
$23,899
Change in median per capita income between 2000 and 2022:
Abilene, Texas:
+60.5%
Texas:
+135.2%
Discuss Abilene, Texas (TX) on our hugely popular Texas forum.