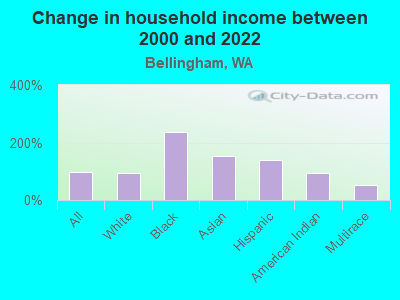
The median household income in Bellingham, WA in 2022 was $64,748, which was 41.0% less than the median annual income of $91,306 across the entire state of Washington. Compared to the median income of $32,530 in 2000 this represents an increase of 49.8%. The per capita income in 2022 was $40,681, which means an increase of 52.1% compared to 2000 when it was $19,483.
Whole page based on the data from 2000 / 2022 when the population of Bellingham, Washington was 67,171 / 93,899
Income statistics for all residents
Median household income in Bellingham, WA in 2022:
Bellingham:
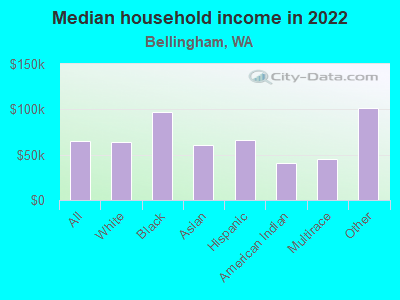
$64,748
Washington:
$91,306
Change in median household income between 2000 and 2022:
Bellingham, Washington:
+99.0%
State:
+99.5%
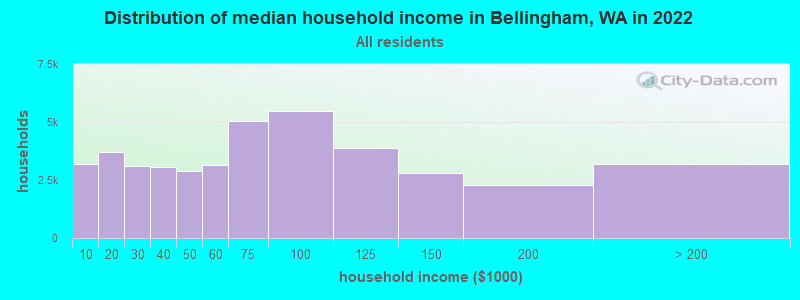
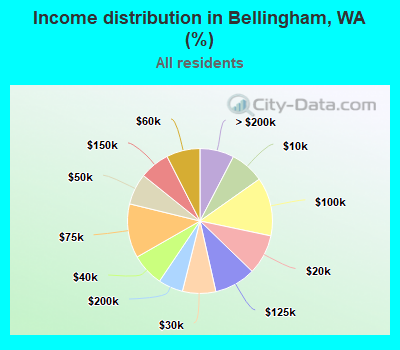
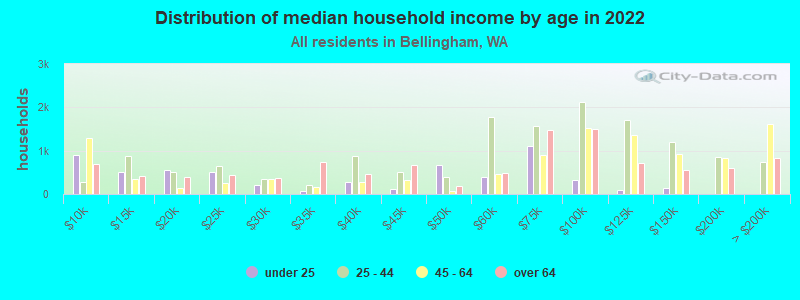
Number of households with income < $10k:
Bellingham:
7.6% (3,170)
State:
4.5% (139,331)
Number of households with income $10k - 20k:
Bellingham:
8.9% (3,727)
Washington:
5.0% (154,508)
Number of households with income $20k - 30k:
Bellingham:
7.4% (3,101)
State:
5.4% (166,555)
Number of households with income $30k - 40k:
Bellingham:
7.3% (3,043)
State:
5.5% (170,324)
Number of households with income $40k - 50k:
Bellingham:
7.0% (2,907)
Washington:
6.0% (183,941)
Number of households with income $50k - 60k:
Bellingham:
7.5% (3,134)
State:
6.1% (187,395)
Number of households with income $60k - 75k:
Bellingham:
12.1% (5,046)
Washington:
8.7% (266,771)
Number of households with income $75k - 100k:
Bellingham:
13.1% (5,460)
State:
13.1% (404,672)
Number of households with income $100k - 125k:
Bellingham:
9.3% (3,862)
State:
11.0% (337,911)
Number of households with income $125k - 150k:
Bellingham:
6.7% (2,804)
State:
8.0% (244,934)
Number of households with income $150k - 200k:
Bellingham:
5.5% (2,306)
State:
10.5% (323,812)
Number of households with income > $200k:
Bellingham:
7.6% (3,186)
State:
16.2% (499,799)
Aggregate household income in Bellingham in 2022: $3,769,422,200
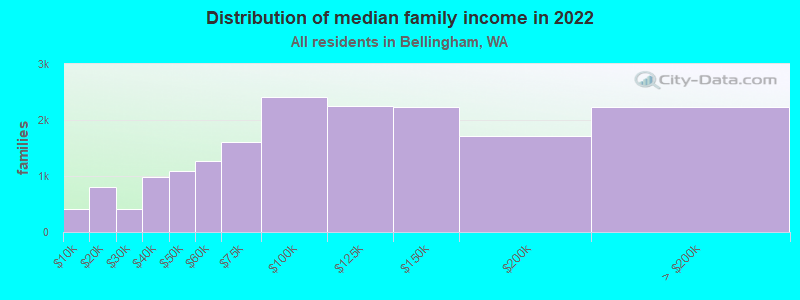
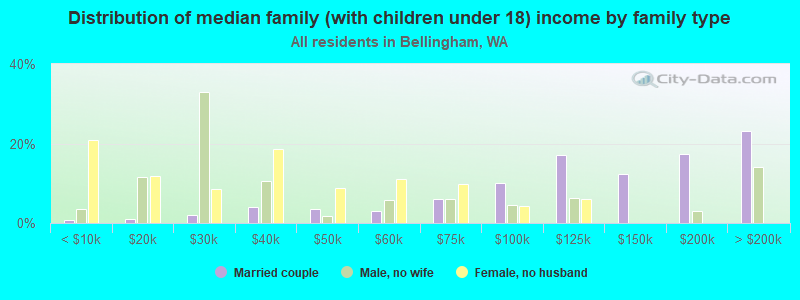
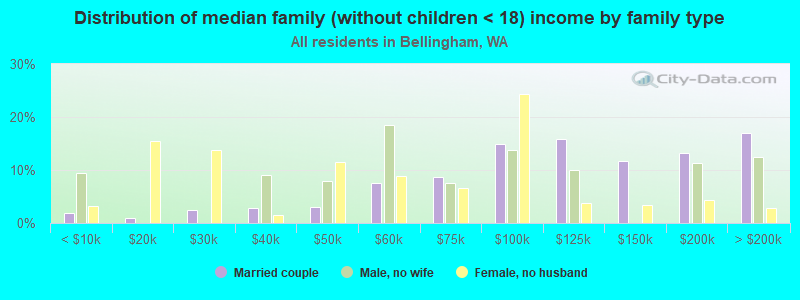
Median family income in Bellingham in 2022:
Bellingham:
$98,520
Washington:
$109,192
Number of families with income < $10k:
Bellingham:
2.3% (406)
State:
2.9% (55,953)
Number of families with income $10k - 20k:
Bellingham:
4.6% (795)
State:
2.6% (50,138)
Number of families with income $20k - 30k:
Bellingham:
2.4% (411)
Washington:
3.2% (61,974)
Number of families with income $30k - 40k:
Bellingham:
5.6% (976)
Washington:
4.1% (80,240)
Number of families with income $40k - 50k:
Bellingham:
6.3% (1,088)
State:
4.9% (94,310)
Number of families with income $50k - 60k:
Bellingham:
7.3% (1,261)
State:
5.3% (101,674)
Number of families with income $60k - 75k:
Bellingham:
9.2% (1,599)
State:
8.2% (158,348)
Number of families with income $75k - 100k:
Bellingham:
13.9% (2,409)
State:
13.8% (267,812)
Number of families with income $100k - 125k:
Bellingham:
13.0% (2,253)
State:
12.4% (240,213)
Number of families with income $125k - 150k:
Bellingham:
12.8% (2,228)
State:
9.3% (180,011)
Number of families with income $150k - 200k:
Bellingham:
9.8% (1,710)
Washington:
13.0% (250,874)
Number of families with income > $200k:
Bellingham:
12.9% (2,232)
State:
20.4% (393,898)
Median non-family income in Bellingham in 2022:
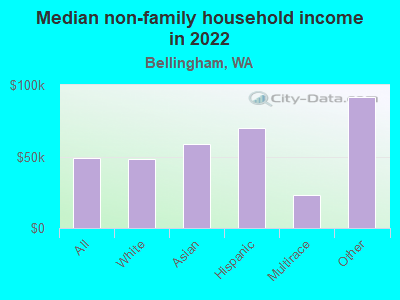
Bellingham:
$48,902
State:
$57,299
Change in median non-family income between 2000 and 2022:
Bellingham, Washington:
+128.8%
State:
+94.9%
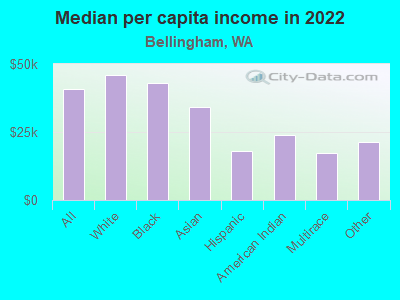
Median per capita income in Bellingham in 2022:
Bellingham:
$40,681
Washington:
$50,764
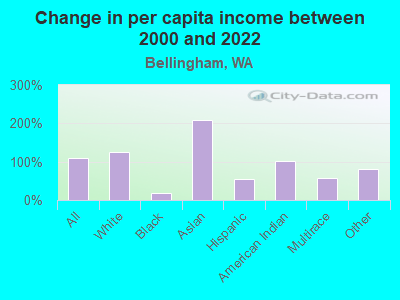
Change in median per capita income between 2000 and 2022:
Bellingham, Washington:
+108.8%
State:
+121.0%
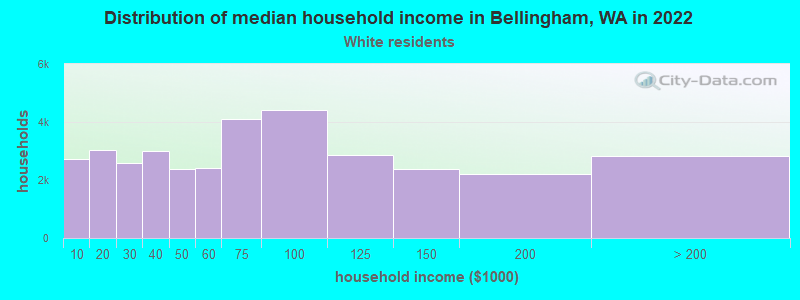
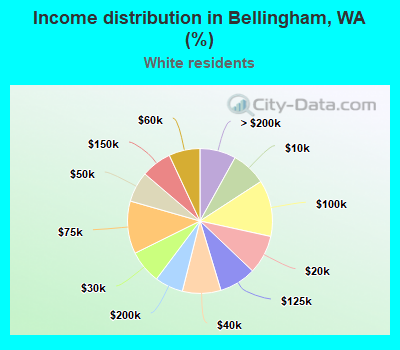
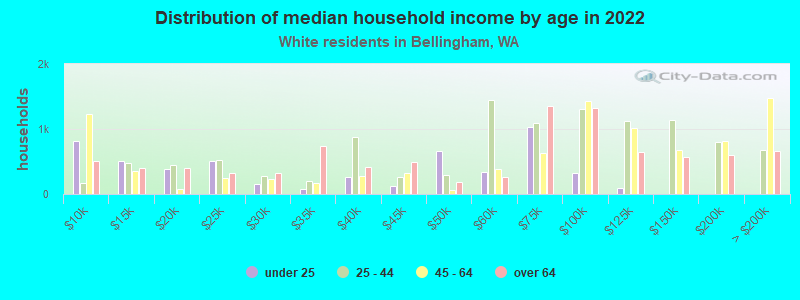
Income statistics for White residents
Median household income in Bellingham, WA in 2022:
Bellingham:
$64,477
Washington:
$91,916
Change in median household income between 2000 and 2022:
Bellingham, Washington:
+94.0%
Washington:
+95.4%
Number of households with income < $10k:
Bellingham:
7.8% (2,728)
State:
4.3% (95,850)
Number of households with income $10k - 20k:
Bellingham:
8.7% (3,032)
Washington:
4.8% (106,421)
Number of households with income $20k - 30k:
Bellingham:
7.4% (2,595)
State:
5.5% (122,860)
Number of households with income $30k - 40k:
Bellingham:
8.6% (3,003)
State:
5.4% (119,627)
Number of households with income $40k - 50k:
Bellingham:
6.8% (2,378)
State:
5.9% (132,276)
Number of households with income $50k - 60k:
Bellingham:
6.9% (2,426)
Washington:
6.1% (136,212)
Number of households with income $60k - 75k:
Bellingham:
11.8% (4,112)
Washington:
8.8% (196,086)
Number of households with income $75k - 100k:
Bellingham:
12.6% (4,397)
Washington:
13.4% (299,192)
Number of households with income $100k - 125k:
Bellingham:
8.2% (2,874)
Washington:
11.3% (252,209)
Number of households with income $125k - 150k:
Bellingham:
6.8% (2,376)
State:
7.9% (175,962)
Number of households with income $150k - 200k:
Bellingham:
6.3% (2,204)
State:
10.7% (239,156)
Number of households with income > $200k:
Bellingham:
8.0% (2,811)
State:
16.1% (359,917)
Aggregate household income in Bellingham in 2022: $3,230,161,800
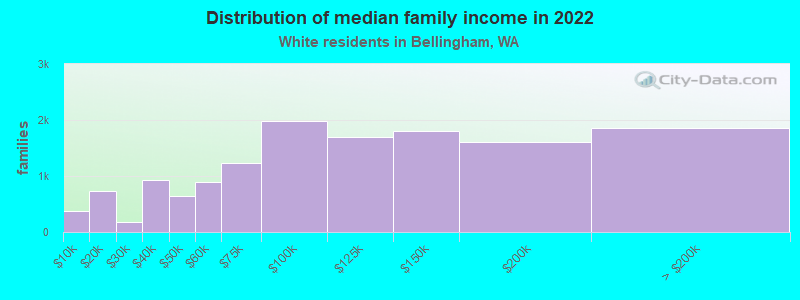
Median family income in Bellingham in 2022:
Bellingham:
$99,970
State:
$112,511
Number of families with income < $10k:
Bellingham:
2.7% (373)
State:
2.4% (33,676)
Number of families with income $10k - 20k:
Bellingham:
5.3% (736)
State:
2.0% (28,228)
Number of families with income $20k - 30k:
Bellingham:
1.3% (177)
State:
2.9% (39,288)
Number of families with income $30k - 40k:
Bellingham:
6.7% (936)
Washington:
3.6% (50,190)
Number of families with income $40k - 50k:
Bellingham:
4.6% (647)
Washington:
4.6% (63,009)
Number of families with income $50k - 60k:
Bellingham:
6.4% (890)
State:
5.0% (69,270)
Number of families with income $60k - 75k:
Bellingham:
8.9% (1,235)
State:
8.2% (112,369)
Number of families with income $75k - 100k:
Bellingham:
14.2% (1,975)
State:
14.1% (194,214)
Number of families with income $100k - 125k:
Bellingham:
12.2% (1,695)
State:
13.2% (182,184)
Number of families with income $125k - 150k:
Bellingham:
12.9% (1,800)
State:
9.5% (130,928)
Number of families with income $150k - 200k:
Bellingham:
11.5% (1,608)
State:
13.7% (188,621)
Number of families with income > $200k:
Bellingham:
13.3% (1,857)
State:
20.8% (285,982)
Median non-family income in Bellingham in 2022:
Bellingham:
$48,186
State:
$56,103
Change in median non-family income between 2000 and 2022:
Bellingham, Washington:
+121.7%
Washington:
+87.7%
Median per capita income in Bellingham in 2022:
Bellingham:
$46,058
State:
$55,212
Change in median per capita income between 2000 and 2022:
Bellingham, Washington:
+126.0%
State:
+123.8%
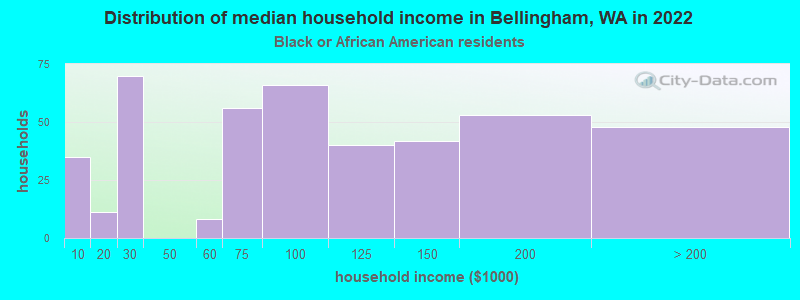
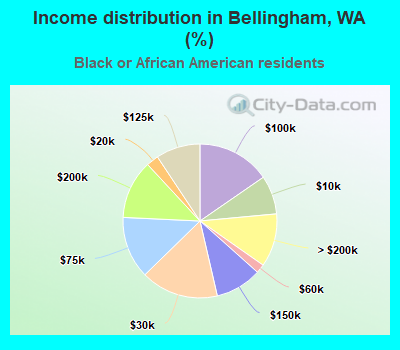
Income statistics for Black or African American residents
Median household income in Bellingham, WA in 2022:
Bellingham:
$96,567
Washington:
$68,202
Number of households with income < $10k:
Bellingham:
8.2% (35)
State:
7.2% (8,014)
Number of households with income $10k - 20k:
Bellingham:
2.6% (11)
Washington:
8.0% (8,904)
Number of households with income $20k - 30k:
Bellingham:
16.3% (70)
State:
7.4% (8,207)
Number of households with income $30k - 40k:
Bellingham:
0.0% (0)
Washington:
5.6% (6,220)
Number of households with income $40k - 50k:
Bellingham:
0.0% (0)
Washington:
9.5% (10,585)
Number of households with income $50k - 60k:
Bellingham:
1.9% (8)
State:
7.3% (8,078)
Number of households with income $60k - 75k:
Bellingham:
13.1% (56)
State:
8.7% (9,704)
Number of households with income $75k - 100k:
Bellingham:
15.4% (66)
State:
12.9% (14,315)
Number of households with income $100k - 125k:
Bellingham:
9.3% (40)
State:
7.7% (8,592)
Number of households with income $125k - 150k:
Bellingham:
9.8% (42)
State:
8.9% (9,840)
Number of households with income $150k - 200k:
Bellingham:
12.4% (53)
State:
7.6% (8,434)
Number of households with income > $200k:
Bellingham:
11.2% (48)
Washington:
9.1% (10,075)
Aggregate household income in Bellingham in 2022: $50,553,100
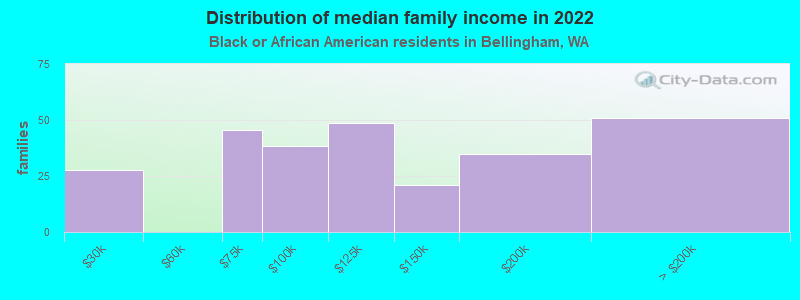
Median family income in Bellingham in 2022:
Bellingham:
$112,124
Washington:
$82,165
Number of families with income $20k - 30k:
Bellingham:
10.3% (28)
Washington:
4.7% (3,151)
Number of families with income $60k - 75k:
Bellingham:
17.1% (45)
State:
9.3% (6,231)
Number of families with income $75k - 100k:
Bellingham:
14.4% (38)
Washington:
14.8% (9,876)
Number of families with income $100k - 125k:
Bellingham:
18.3% (49)
State:
9.0% (6,018)
Number of families with income $125k - 150k:
Bellingham:
7.8% (21)
Washington:
9.5% (6,348)
Number of families with income $150k - 200k:
Bellingham:
13.0% (35)
State:
8.6% (5,737)
Number of families with income > $200k:
Bellingham:
19.1% (51)
State:
12.0% (8,041)
Median per capita income in Bellingham in 2022:
Bellingham:
$43,097
State:
$38,209
Change in median per capita income between 2000 and 2022:
Bellingham, Washington:
+18.7%
Washington:
+115.3%
Income statistics for Asian residents
Median household income in Bellingham, WA in 2022:
Bellingham:
$61,074
State:
$125,692
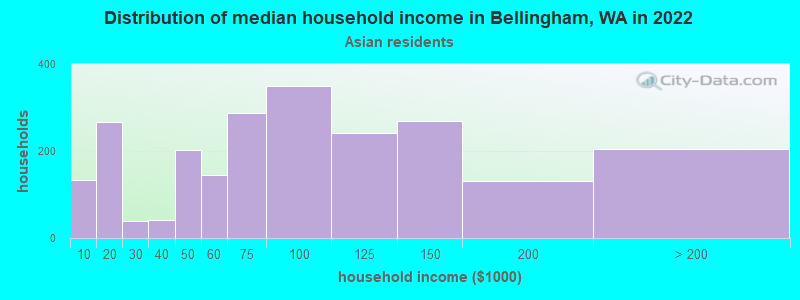
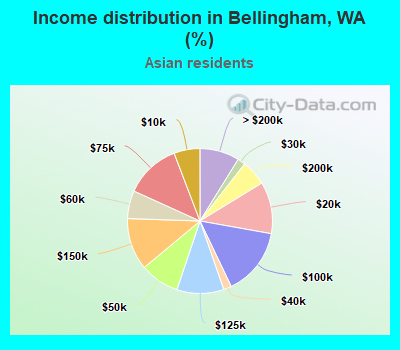
Number of households with income < $10k:
Bellingham:
5.8% (134)
State:
4.9% (14,099)
Number of households with income $10k - 20k:
Bellingham:
11.6% (267)
State:
3.5% (9,873)
Number of households with income $20k - 30k:
Bellingham:
1.7% (40)
State:
2.9% (8,352)
Number of households with income $30k - 40k:
Bellingham:
1.8% (41)
State:
4.0% (11,415)
Number of households with income $40k - 50k:
Bellingham:
8.8% (203)
State:
4.0% (11,421)
Number of households with income $50k - 60k:
Bellingham:
6.2% (144)
Washington:
4.2% (12,100)
Number of households with income $60k - 75k:
Bellingham:
12.4% (287)
State:
6.3% (17,903)
Number of households with income $75k - 100k:
Bellingham:
15.1% (349)
State:
10.4% (29,663)
Number of households with income $100k - 125k:
Bellingham:
10.5% (242)
Washington:
9.4% (26,839)
Number of households with income $125k - 150k:
Bellingham:
11.6% (268)
Washington:
8.5% (24,200)
Number of households with income $150k - 200k:
Bellingham:
5.7% (132)
Washington:
12.6% (35,976)
Number of households with income > $200k:
Bellingham:
8.8% (204)
Washington:
29.2% (83,109)
Aggregate household income in Bellingham in 2022: $220,582,600
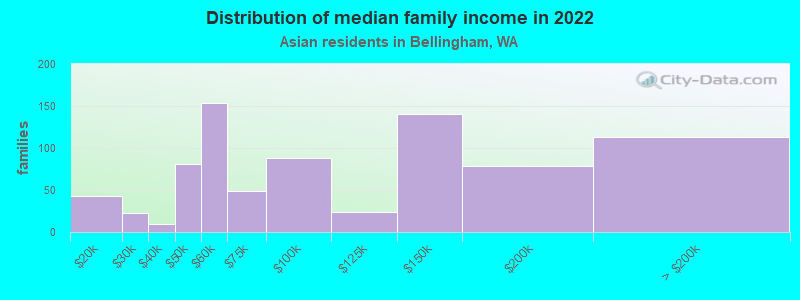
Median family income in Bellingham in 2022:
Bellingham:
$92,948
State:
$143,595
Number of families with income $10k - 20k:
Bellingham:
5.4% (43)
State:
2.2% (4,150)
Number of families with income $20k - 30k:
Bellingham:
2.9% (23)
State:
1.9% (3,558)
Number of families with income $30k - 40k:
Bellingham:
1.2% (10)
State:
3.1% (5,734)
Number of families with income $40k - 50k:
Bellingham:
10.1% (81)
State:
3.6% (6,707)
Number of families with income $50k - 60k:
Bellingham:
19.1% (153)
State:
4.1% (7,663)
Number of families with income $60k - 75k:
Bellingham:
6.2% (49)
State:
5.1% (9,490)
Number of families with income $75k - 100k:
Bellingham:
10.9% (88)
Washington:
11.7% (21,919)
Number of families with income $100k - 125k:
Bellingham:
3.0% (24)
Washington:
9.3% (17,280)
Number of families with income $125k - 150k:
Bellingham:
17.6% (141)
State:
8.4% (15,602)
Number of families with income $150k - 200k:
Bellingham:
9.7% (78)
State:
13.3% (24,789)
Number of families with income > $200k:
Bellingham:
14.0% (113)
State:
34.4% (64,250)
Median non-family income in Bellingham in 2022:
Bellingham:
$58,750
Washington:
$84,971
Median per capita income in Bellingham in 2022:
Bellingham:
$34,240
State:
$67,666
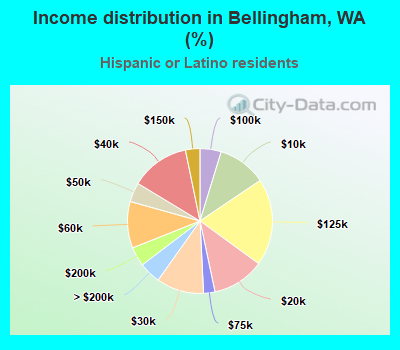
Income statistics for Hispanic or Latino residents
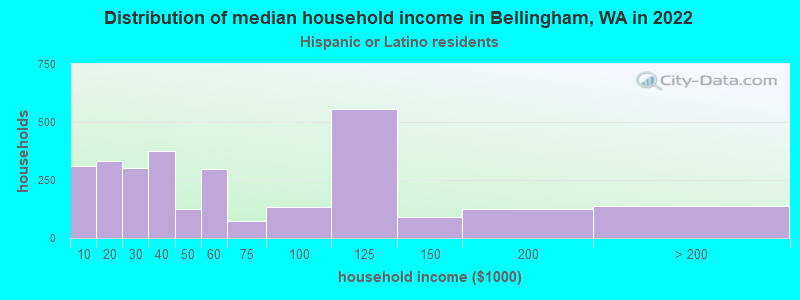
Median household income in Bellingham, WA in 2022:
Bellingham:
$65,978
State:
$74,770
Change in median household income between 2000 and 2022:
Bellingham, Washington:
+140.1%
State:
+128.3%
Number of households with income < $10k:
Bellingham:
10.8% (309)
Washington:
4.9% (14,456)
Number of households with income $10k - 20k:
Bellingham:
11.6% (332)
State:
5.3% (15,449)
Number of households with income $20k - 30k:
Bellingham:
10.6% (302)
Washington:
6.8% (20,016)
Number of households with income $30k - 40k:
Bellingham:
13.1% (374)
State:
7.7% (22,548)
Number of households with income $40k - 50k:
Bellingham:
4.3% (123)
State:
7.3% (21,450)
Number of households with income $50k - 60k:
Bellingham:
10.4% (296)
State:
7.7% (22,744)
Number of households with income $60k - 75k:
Bellingham:
2.6% (73)
State:
10.5% (30,737)
Number of households with income $75k - 100k:
Bellingham:
4.7% (135)
State:
14.9% (43,843)
Number of households with income $100k - 125k:
Bellingham:
19.5% (555)
State:
11.1% (32,554)
Number of households with income $125k - 150k:
Bellingham:
3.2% (92)
State:
7.4% (21,624)
Number of households with income $150k - 200k:
Bellingham:
4.3% (123)
Washington:
7.3% (21,360)
Number of households with income > $200k:
Bellingham:
4.8% (138)
State:
9.2% (27,055)
Aggregate household income in Bellingham in 2022: $256,314,200
Median family income in Bellingham in 2022:
Bellingham:
$59,743
Washington:
$76,866
Number of families with income < $10k:
Bellingham:
0.8% (11)
State:
4.4% (9,443)
Number of families with income $10k - 20k:
Bellingham:
9.9% (130)
Washington:
3.5% (7,524)
Number of families with income $20k - 30k:
Bellingham:
19.8% (261)
State:
5.6% (12,052)
Number of families with income $30k - 40k:
Bellingham:
7.1% (95)
State:
8.3% (17,803)
Number of families with income $40k - 50k:
Bellingham:
3.3% (43)
State:
7.7% (16,361)
Number of families with income $50k - 60k:
Bellingham:
13.5% (179)
State:
7.9% (16,852)
Number of families with income $75k - 100k:
Bellingham:
8.9% (118)
State:
14.4% (30,698)
Number of families with income $100k - 125k:
Bellingham:
16.6% (219)
State:
11.4% (24,331)
Number of families with income $125k - 150k:
Bellingham:
4.1% (55)
Washington:
7.5% (16,099)
Number of families with income $150k - 200k:
Bellingham:
4.1% (55)
State:
8.2% (17,551)
Number of families with income > $200k:
Bellingham:
11.9% (158)
State:
9.7% (20,653)
Median non-family income in Bellingham in 2022:
Bellingham:
$70,168
State:
$54,173
Median per capita income in Bellingham in 2022:
Bellingham:
$18,051
Washington:
$28,252
Change in median per capita income between 2000 and 2022:
Bellingham, Washington:
+54.0%
State:
+150.2%
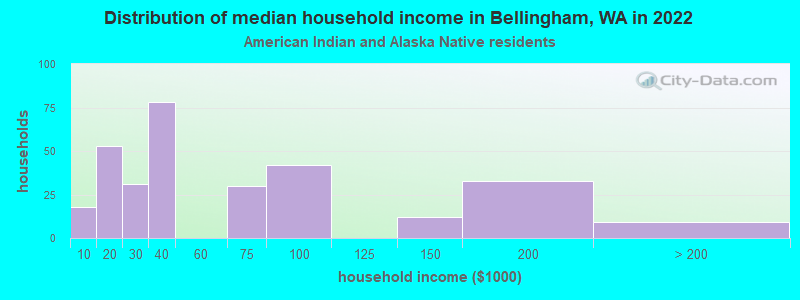
Income statistics for American Indian and Alaska Native residents
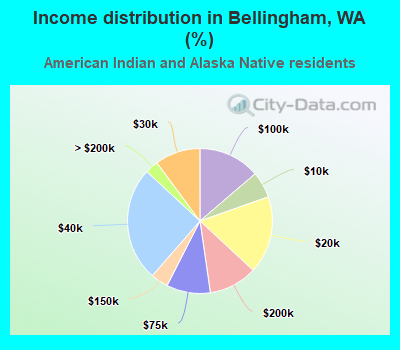
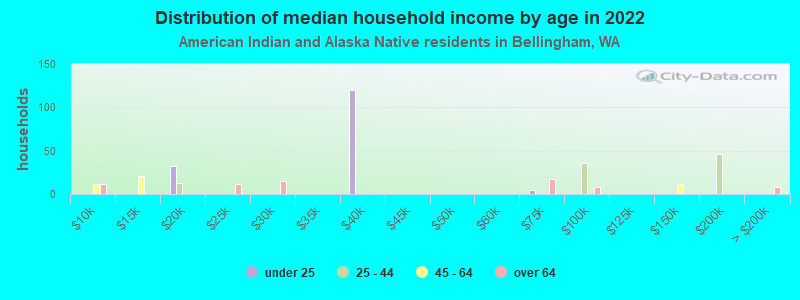
Median household income in Bellingham, WA in 2022:
Bellingham:
$40,579
State:
$71,255
Change in median household income between 2000 and 2022:
Bellingham, Washington:
+94.3%
State:
+118.1%
Number of households with income < $10k:
Bellingham:
5.9% (18)
State:
5.9% (1,768)
Number of households with income $10k - 20k:
Bellingham:
17.3% (53)
State:
8.9% (2,694)
Number of households with income $20k - 30k:
Bellingham:
10.1% (31)
State:
8.0% (2,412)
Number of households with income $30k - 40k:
Bellingham:
25.5% (78)
Washington:
7.7% (2,327)
Number of households with income $40k - 50k:
Bellingham:
0.0% (0)
Washington:
5.8% (1,755)
Number of households with income $50k - 60k:
Bellingham:
0.0% (0)
State:
7.5% (2,259)
Number of households with income $60k - 75k:
Bellingham:
9.8% (30)
State:
8.8% (2,669)
Number of households with income $75k - 100k:
Bellingham:
13.7% (42)
State:
12.8% (3,861)
Number of households with income $100k - 125k:
Bellingham:
0.0% (0)
State:
12.0% (3,618)
Number of households with income $125k - 150k:
Bellingham:
3.9% (12)
State:
8.6% (2,580)
Number of households with income $150k - 200k:
Bellingham:
10.8% (33)
State:
5.9% (1,774)
Number of households with income > $200k:
Bellingham:
2.9% (9)
State:
8.1% (2,447)
Aggregate household income in Bellingham in 2022: $13,778,353
Median per capita income in Bellingham in 2022:
Bellingham:
$23,959
Washington:
$27,053
Change in median per capita income between 2000 and 2022:
Bellingham, Washington:
+101.1%
State:
+98.6%
Income statistics for Multirace residents
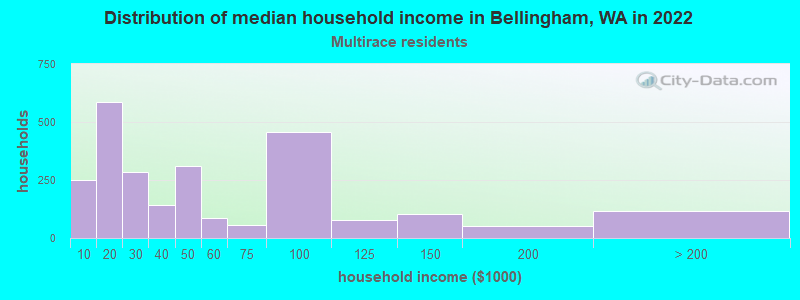
Median household income in Bellingham, WA in 2022:
Bellingham:
$44,846
Washington:
$84,303
Change in median household income between 2000 and 2022:
Bellingham, Washington:
+51.4%
State:
+125.7%
Number of households with income < $10k:
Bellingham:
10.0% (252)
State:
4.3% (12,040)
Number of households with income $10k - 20k:
Bellingham:
23.2% (586)
State:
6.6% (18,437)
Number of households with income $20k - 30k:
Bellingham:
11.3% (284)
State:
5.2% (14,559)
Number of households with income $30k - 40k:
Bellingham:
5.7% (144)
Washington:
6.7% (18,491)
Number of households with income $40k - 50k:
Bellingham:
12.3% (309)
State:
6.3% (17,459)
Number of households with income $50k - 60k:
Bellingham:
3.4% (86)
State:
6.9% (19,086)
Number of households with income $60k - 75k:
Bellingham:
2.2% (55)
Washington:
9.1% (25,310)
Number of households with income $75k - 100k:
Bellingham:
18.1% (457)
State:
13.5% (37,493)
Number of households with income $100k - 125k:
Bellingham:
3.0% (76)
State:
10.7% (29,626)
Number of households with income $125k - 150k:
Bellingham:
4.2% (105)
State:
8.6% (23,899)
Number of households with income $150k - 200k:
Bellingham:
2.0% (51)
Washington:
10.2% (28,214)
Number of households with income > $200k:
Bellingham:
4.6% (116)
State:
11.9% (32,947)
Aggregate household income in Bellingham in 2022: $145,278,700
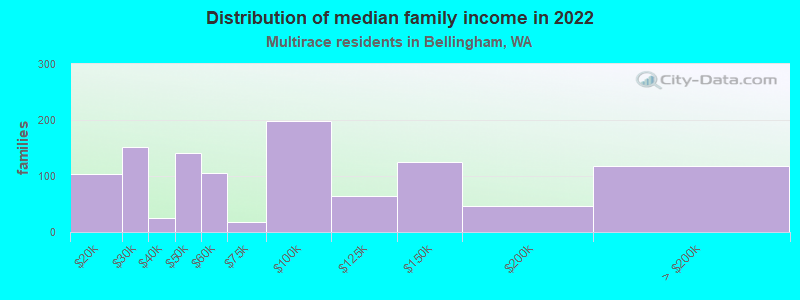
Median family income in Bellingham in 2022:
Bellingham:
$48,887
State:
$95,629
Number of families with income $10k - 20k:
Bellingham:
9.5% (104)
State:
4.3% (7,519)
Number of families with income $20k - 30k:
Bellingham:
13.8% (151)
Washington:
4.4% (7,775)
Number of families with income $30k - 40k:
Bellingham:
2.3% (25)
State:
5.8% (10,186)
Number of families with income $40k - 50k:
Bellingham:
12.8% (141)
State:
5.9% (10,412)
Number of families with income $50k - 60k:
Bellingham:
9.6% (105)
State:
5.6% (9,922)
Number of families with income $60k - 75k:
Bellingham:
1.7% (18)
State:
9.7% (17,113)
Number of families with income $75k - 100k:
Bellingham:
18.0% (198)
State:
13.6% (23,984)
Number of families with income $100k - 125k:
Bellingham:
6.0% (65)
Washington:
10.4% (18,288)
Number of families with income $125k - 150k:
Bellingham:
11.4% (125)
Washington:
10.5% (18,481)
Number of families with income $150k - 200k:
Bellingham:
4.3% (47)
Washington:
11.9% (20,852)
Number of families with income > $200k:
Bellingham:
10.7% (118)
State:
14.4% (25,289)
Median non-family income in Bellingham in 2022:
Bellingham:
$23,081
Washington:
$56,573
Change in median non-family income between 2000 and 2022:
Bellingham, Washington:
+9.6%
State:
+115.0%
Median per capita income in Bellingham in 2022:
Bellingham:
$17,115
State:
$32,496
Change in median per capita income between 2000 and 2022:
Bellingham, Washington:
+57.1%
Washington:
+156.8%
Income statistics for other residents
Median household income in Bellingham, WA in 2022:
Bellingham:
$101,547
State:
$69,545
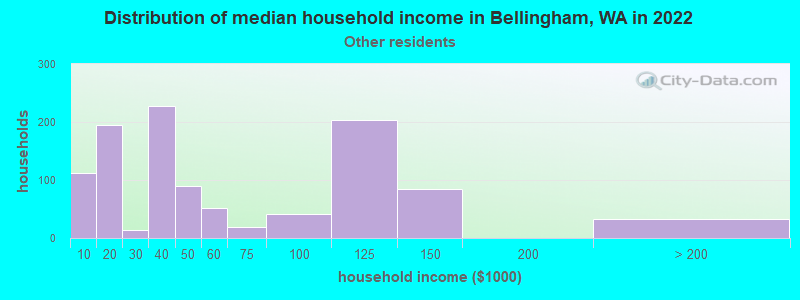
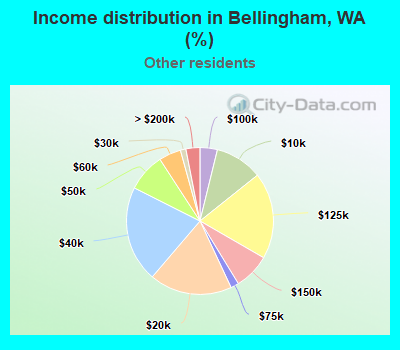
Number of households with income < $10k:
Bellingham:
10.5% (112)
Washington:
5.3% (6,540)
Number of households with income $10k - 20k:
Bellingham:
18.2% (195)
State:
6.0% (7,385)
Number of households with income $20k - 30k:
Bellingham:
1.2% (13)
State:
7.5% (9,289)
Number of households with income $30k - 40k:
Bellingham:
21.2% (227)
State:
8.9% (11,015)
Number of households with income $40k - 50k:
Bellingham:
8.4% (90)
State:
7.6% (9,399)
Number of households with income $50k - 60k:
Bellingham:
4.9% (52)
State:
7.2% (8,867)
Number of households with income $60k - 75k:
Bellingham:
1.8% (19)
State:
10.5% (13,032)
Number of households with income $75k - 100k:
Bellingham:
3.8% (41)
Washington:
14.6% (18,007)
Number of households with income $100k - 125k:
Bellingham:
19.0% (204)
State:
12.2% (15,128)
Number of households with income $125k - 150k:
Bellingham:
7.9% (85)
State:
5.6% (6,950)
Number of households with income $150k - 200k:
Bellingham:
0.0% (0)
State:
7.1% (8,749)
Number of households with income > $200k:
Bellingham:
3.1% (33)
State:
7.5% (9,208)
Aggregate household income in Bellingham in 2022: $110,335,300
Median non-family income in Bellingham in 2022:
Bellingham:
$91,333
State:
$44,777
Median per capita income in Bellingham in 2022:
Bellingham:
$21,164
State:
$27,542
Change in median per capita income between 2000 and 2022:
Bellingham, Washington:
+82.4%
Washington:
+167.8%
Discuss Bellingham, Washington (WA) on our hugely popular Washington forum.