East Jefferson, Texas (TX) income map, earnings map, and wages data
The median household income in East Jefferson, TX in 2022 was $55,583, which was 30.0% less than the median annual income of $72,284 across the entire state of Texas. Compared to the median income of $35,204 in 2000 this represents an increase of 36.7%. The per capita income in 2022 was $28,745, which means an increase of 41.1% compared to 2000 when it was $16,919.
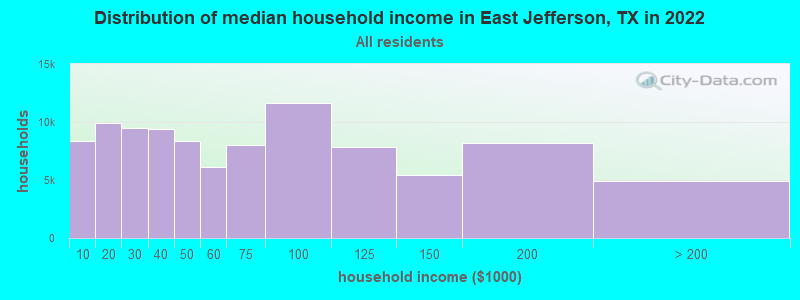
Income statistics for all residents
Median household income in East Jefferson, TX in 2022:| East Jefferson: | $55,583 |
| Texas: | $72,284 |
Change in median household income between 2000 and 2022:| East Jefferson, Texas: | +57.9% |
| Texas: | +81.0% |
Number of households with income < $10k:| East Jefferson: | 8.6% (8,389) |
| State: | 5.5% (611,011) |
Number of households with income $10k - 20k:| East Jefferson: | 10.1% (9,871) |
| State: | 6.7% (743,157) |
Number of households with income $20k - 30k:| East Jefferson: | 9.7% (9,464) |
| State: | 7.2% (803,381) |
Number of households with income $30k - 40k:| East Jefferson: | 9.6% (9,389) |
| Texas: | 7.8% (866,080) |
Number of households with income $40k - 50k:| East Jefferson: | 8.5% (8,319) |
| State: | 7.3% (810,440) |
Number of households with income $50k - 60k:| East Jefferson: | 6.3% (6,146) |
| State: | 7.2% (799,783) |
Number of households with income $60k - 75k:| East Jefferson: | 8.2% (8,043) |
| Texas: | 9.9% (1,095,384) |
Number of households with income $75k - 100k:| East Jefferson: | 11.9% (11,596) |
| Texas: | 12.8% (1,419,057) |
Number of households with income $100k - 125k:| East Jefferson: | 8.0% (7,820) |
| State: | 9.5% (1,054,577) |
Number of households with income $125k - 150k:| East Jefferson: | 5.5% (5,404) |
| Texas: | 6.7% (741,518) |
Number of households with income $150k - 200k:| East Jefferson: | 8.4% (8,211) |
| State: | 8.7% (961,776) |
Number of households with income > $200k:| East Jefferson: | 5.0% (4,899) |
| State: | 10.7% (1,181,544) |
Aggregate household income in East Jefferson in 2022: $6,701,551,977
Median family income in East Jefferson in 2022:| East Jefferson: | $69,199 |
| Texas: | $86,267 |
Median non-family income in East Jefferson in 2022:| East Jefferson: | $30,020 |
| State: | $45,999 |
Change in median non-family income between 2000 and 2022:| East Jefferson, Texas: | +58.7% |
| State: | +79.5% |
Median per capita income in East Jefferson in 2022:| East Jefferson: | $28,745 |
| State: | $38,123 |
Change in median per capita income between 2000 and 2022:| East Jefferson, Texas: | +69.9% |
| Texas: | +94.3% |
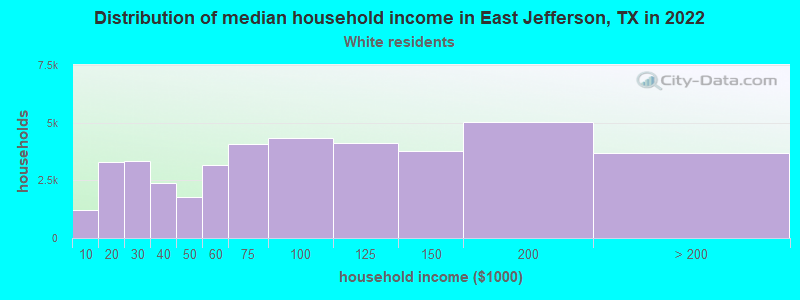
Income statistics for White residents
Median household income in East Jefferson, TX in 2022:| East Jefferson: | $78,366 |
| Texas: | $82,032 |
Change in median household income between 2000 and 2022:| East Jefferson, Texas: | +93.3% |
| Texas: | +91.0% |
Number of households with income < $10k:| East Jefferson: | 3.0% (1,216) |
| Texas: | 4.7% (273,716) |
Number of households with income $10k - 20k:| East Jefferson: | 8.2% (3,303) |
| State: | 5.5% (322,702) |
Number of households with income $20k - 30k:| East Jefferson: | 8.3% (3,336) |
| State: | 6.2% (363,947) |
Number of households with income $30k - 40k:| East Jefferson: | 5.9% (2,368) |
| Texas: | 6.8% (399,275) |
Number of households with income $40k - 50k:| East Jefferson: | 4.4% (1,768) |
| Texas: | 6.5% (383,417) |
Number of households with income $50k - 60k:| East Jefferson: | 7.8% (3,148) |
| State: | 6.6% (388,535) |
Number of households with income $60k - 75k:| East Jefferson: | 10.1% (4,063) |
| State: | 9.7% (566,295) |
Number of households with income $75k - 100k:| East Jefferson: | 10.8% (4,334) |
| State: | 13.0% (760,276) |
Number of households with income $100k - 125k:| East Jefferson: | 10.3% (4,141) |
| State: | 10.2% (597,596) |
Number of households with income $125k - 150k:| East Jefferson: | 9.4% (3,764) |
| State: | 7.4% (436,830) |
Number of households with income $150k - 200k:| East Jefferson: | 12.5% (5,032) |
| Texas: | 9.9% (583,067) |
Number of households with income > $200k:| East Jefferson: | 9.2% (3,705) |
| Texas: | 13.5% (792,647) |
Aggregate household income in East Jefferson in 2022: $2,955,494,146
Median family income in East Jefferson in 2022:| East Jefferson: | $102,624 |
| Texas: | $101,788 |
Number of families with income < $10k:| East Jefferson: | 4.2% (522) |
| State: | 2.8% (108,142) |
Number of families with income $10k - 20k:| East Jefferson: | 4.0% (497) |
| State: | 2.9% (113,421) |
Number of families with income $20k - 30k:| East Jefferson: | 4.7% (589) |
| State: | 4.1% (157,688) |
Number of families with income $30k - 40k:| East Jefferson: | 4.6% (573) |
| State: | 5.2% (198,847) |
Number of families with income $40k - 50k:| East Jefferson: | 6.0% (746) |
| State: | 5.6% (216,490) |
Number of families with income $50k - 60k:| East Jefferson: | 8.2% (1,021) |
| State: | 5.7% (220,689) |
Number of families with income $60k - 75k:| East Jefferson: | 10.2% (1,271) |
| Texas: | 9.0% (346,106) |
Number of families with income $75k - 100k:| East Jefferson: | 12.8% (1,595) |
| State: | 13.7% (527,363) |
Number of families with income $100k - 125k:| East Jefferson: | 11.9% (1,482) |
| Texas: | 11.6% (448,411) |
Number of families with income $125k - 150k:| East Jefferson: | 10.7% (1,337) |
| State: | 9.2% (355,798) |
Number of families with income $150k - 200k:| East Jefferson: | 13.8% (1,719) |
| State: | 12.5% (480,185) |
Number of families with income > $200k:| East Jefferson: | 8.9% (1,111) |
| Texas: | 17.6% (677,490) |
Median non-family income in East Jefferson in 2022:| East Jefferson: | $42,246 |
| Texas: | $50,587 |
Change in median non-family income between 2000 and 2022:| East Jefferson, Texas: | +96.5% |
| State: | +87.7% |
Median per capita income in East Jefferson in 2022:| East Jefferson: | $40,208 |
| State: | $47,740 |
Change in median per capita income between 2000 and 2022:| East Jefferson, Texas: | +100.6% |
| Texas: | +114.3% |
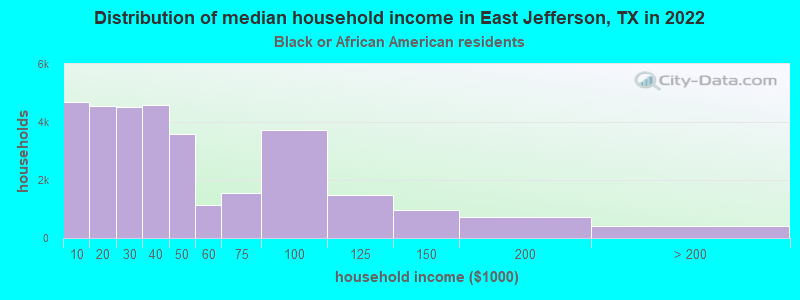
Income statistics for Black or African American residents
Median household income in East Jefferson, TX in 2022:| East Jefferson: | $32,301 |
| State: | $55,759 |
Change in median household income between 2000 and 2022:| East Jefferson, Texas: | +57.2% |
| Texas: | +90.3% |
Number of households with income < $10k:| East Jefferson: | 14.7% (4,702) |
| State: | 8.9% (126,378) |
Number of households with income $10k - 20k:| East Jefferson: | 14.2% (4,541) |
| State: | 9.9% (140,369) |
Number of households with income $20k - 30k:| East Jefferson: | 14.1% (4,511) |
| State: | 8.5% (120,639) |
Number of households with income $30k - 40k:| East Jefferson: | 14.4% (4,594) |
| State: | 9.7% (137,517) |
Number of households with income $40k - 50k:| East Jefferson: | 11.2% (3,570) |
| Texas: | 8.0% (112,973) |
Number of households with income $50k - 60k:| East Jefferson: | 3.6% (1,151) |
| Texas: | 8.3% (117,156) |
Number of households with income $60k - 75k:| East Jefferson: | 4.9% (1,549) |
| State: | 10.4% (147,462) |
Number of households with income $75k - 100k:| East Jefferson: | 11.7% (3,726) |
| Texas: | 11.5% (162,718) |
Number of households with income $100k - 125k:| East Jefferson: | 4.6% (1,484) |
| State: | 8.2% (115,829) |
Number of households with income $125k - 150k:| East Jefferson: | 3.0% (971) |
| State: | 4.9% (69,556) |
Number of households with income $150k - 200k:| East Jefferson: | 2.3% (738) |
| State: | 6.4% (90,701) |
Number of households with income > $200k:| East Jefferson: | 1.2% (397) |
| Texas: | 5.5% (77,988) |
Aggregate household income in East Jefferson in 2022: $536,888,058
Median family income in East Jefferson in 2022:| East Jefferson: | $37,620 |
| State: | $69,134 |
Number of families with income < $10k:| East Jefferson: | 15.0% (1,021) |
| Texas: | 6.8% (55,625) |
Number of families with income $10k - 20k:| East Jefferson: | 10.5% (713) |
| State: | 6.8% (55,300) |
Number of families with income $20k - 30k:| East Jefferson: | 13.6% (924) |
| Texas: | 7.1% (57,877) |
Number of families with income $30k - 40k:| East Jefferson: | 10.9% (742) |
| Texas: | 8.5% (68,776) |
Number of families with income $40k - 50k:| East Jefferson: | 14.6% (995) |
| State: | 7.1% (57,907) |
Number of families with income $50k - 60k:| East Jefferson: | 3.5% (240) |
| State: | 7.3% (59,511) |
Number of families with income $60k - 75k:| East Jefferson: | 4.9% (337) |
| State: | 10.1% (81,994) |
Number of families with income $75k - 100k:| East Jefferson: | 10.1% (687) |
| State: | 12.7% (103,723) |
Number of families with income $100k - 125k:| East Jefferson: | 6.5% (445) |
| State: | 9.4% (76,609) |
Number of families with income $125k - 150k:| East Jefferson: | 4.1% (280) |
| Texas: | 6.8% (55,615) |
Number of families with income $150k - 200k:| East Jefferson: | 5.4% (371) |
| State: | 9.4% (76,146) |
Number of families with income > $200k:| East Jefferson: | 0.9% (62) |
| Texas: | 7.9% (64,439) |
Median non-family income in East Jefferson in 2022:| East Jefferson: | $24,973 |
| Texas: | $40,133 |
Change in median non-family income between 2000 and 2022:| East Jefferson, Texas: | +93.1% |
| State: | +102.2% |
Median per capita income in East Jefferson in 2022:| East Jefferson: | $18,841 |
| State: | $30,490 |
Change in median per capita income between 2000 and 2022:| East Jefferson, Texas: | +62.5% |
| Texas: | +113.9% |
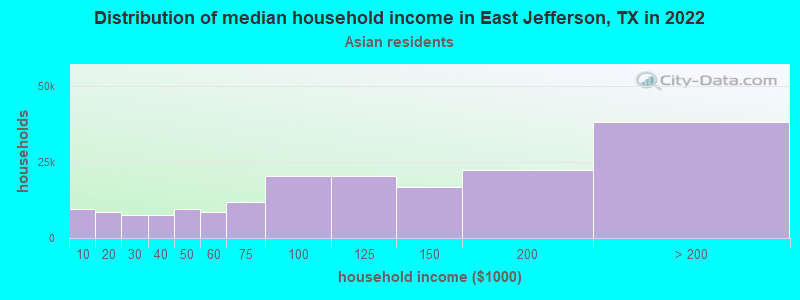
Income statistics for Asian residents
Median household income in East Jefferson, TX in 2022:| East Jefferson: | $68,582 |
| State: | $107,673 |
Change in median household income between 2000 and 2022:| East Jefferson, Texas: | +115.2% |
| Texas: | +115.1% |
Number of households with income < $10k:| East Jefferson: | 5.3% (9,526) |
| State: | 5.2% (29,885) |
Number of households with income $10k - 20k:| East Jefferson: | 4.8% (8,619) |
| Texas: | 4.7% (27,044) |
Number of households with income $20k - 30k:| East Jefferson: | 4.1% (7,428) |
| State: | 4.1% (23,363) |
Number of households with income $30k - 40k:| East Jefferson: | 4.1% (7,426) |
| Texas: | 4.1% (23,309) |
Number of households with income $40k - 50k:| East Jefferson: | 5.2% (9,493) |
| Texas: | 5.2% (29,826) |
Number of households with income $50k - 60k:| East Jefferson: | 4.6% (8,421) |
| State: | 4.7% (26,512) |
Number of households with income $60k - 75k:| East Jefferson: | 6.5% (11,761) |
| State: | 6.5% (36,905) |
Number of households with income $75k - 100k:| East Jefferson: | 11.3% (20,452) |
| State: | 11.3% (64,350) |
Number of households with income $100k - 125k:| East Jefferson: | 11.3% (20,583) |
| State: | 11.4% (64,714) |
Number of households with income $125k - 150k:| East Jefferson: | 9.3% (16,780) |
| Texas: | 9.3% (52,719) |
Number of households with income $150k - 200k:| East Jefferson: | 12.5% (22,587) |
| State: | 12.5% (70,953) |
Number of households with income > $200k:| East Jefferson: | 21.1% (38,281) |
| State: | 21.1% (120,260) |
Aggregate household income in East Jefferson in 2022: $168,143,947
Median family income in East Jefferson in 2022:| East Jefferson: | $72,606 |
| Texas: | $123,328 |
Number of families with income < $10k:| East Jefferson: | 10.5% (211) |
| State: | 3.1% (13,567) |
Number of families with income $10k - 20k:| East Jefferson: | 5.6% (112) |
| Texas: | 3.0% (13,043) |
Number of families with income $20k - 30k:| East Jefferson: | 5.4% (109) |
| Texas: | 3.4% (14,738) |
Number of families with income $30k - 40k:| East Jefferson: | 7.3% (146) |
| State: | 3.4% (15,033) |
Number of families with income $40k - 50k:| East Jefferson: | 7.8% (156) |
| State: | 4.9% (21,622) |
Number of families with income $50k - 60k:| East Jefferson: | 9.1% (182) |
| State: | 4.7% (20,568) |
Number of families with income $60k - 75k:| East Jefferson: | 5.8% (117) |
| State: | 6.1% (26,637) |
Number of families with income $75k - 100k:| East Jefferson: | 7.1% (142) |
| State: | 10.7% (46,626) |
Number of families with income $100k - 125k:| East Jefferson: | 15.3% (307) |
| State: | 11.3% (49,585) |
Number of families with income $125k - 150k:| East Jefferson: | 10.8% (217) |
| State: | 9.8% (43,043) |
Number of families with income $150k - 200k:| East Jefferson: | 7.9% (158) |
| Texas: | 14.7% (64,203) |
Number of families with income > $200k:| East Jefferson: | 7.6% (153) |
| Texas: | 24.8% (108,511) |
Median non-family income in East Jefferson in 2022:| East Jefferson: | $15,876 |
| State: | $64,320 |
Change in median non-family income between 2000 and 2022:| East Jefferson, Texas: | +0.5% |
| State: | +131.1% |
Median per capita income in East Jefferson in 2022:| East Jefferson: | $26,583 |
| State: | $48,626 |
Change in median per capita income between 2000 and 2022:| East Jefferson, Texas: | +139.2% |
| State: | +132.0% |
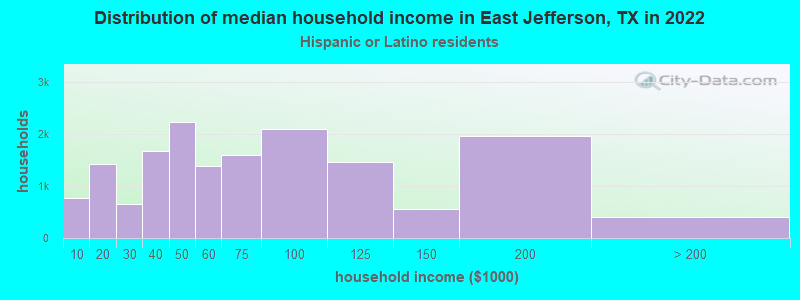
Income statistics for Hispanic or Latino residents
Median household income in East Jefferson, TX in 2022:| East Jefferson: | $60,287 |
| Texas: | $60,504 |
Change in median household income between 2000 and 2022:| East Jefferson, Texas: | +89.7% |
| State: | +102.5% |
Number of households with income < $10k:| East Jefferson: | 4.8% (777) |
| Texas: | 5.8% (213,953) |
Number of households with income $10k - 20k:| East Jefferson: | 8.8% (1,426) |
| Texas: | 8.0% (297,456) |
Number of households with income $20k - 30k:| East Jefferson: | 4.0% (655) |
| State: | 9.2% (340,166) |
Number of households with income $30k - 40k:| East Jefferson: | 10.3% (1,667) |
| Texas: | 9.5% (354,336) |
Number of households with income $40k - 50k:| East Jefferson: | 13.8% (2,232) |
| Texas: | 8.8% (327,013) |
Number of households with income $50k - 60k:| East Jefferson: | 8.5% (1,377) |
| Texas: | 8.3% (308,818) |
Number of households with income $60k - 75k:| East Jefferson: | 9.9% (1,605) |
| State: | 10.9% (405,109) |
Number of households with income $75k - 100k:| East Jefferson: | 12.9% (2,096) |
| State: | 13.8% (511,639) |
Number of households with income $100k - 125k:| East Jefferson: | 9.0% (1,464) |
| State: | 8.6% (319,728) |
Number of households with income $125k - 150k:| East Jefferson: | 3.5% (564) |
| Texas: | 5.7% (210,932) |
Number of households with income $150k - 200k:| East Jefferson: | 12.1% (1,969) |
| State: | 6.4% (236,055) |
Number of households with income > $200k:| East Jefferson: | 2.5% (398) |
| Texas: | 5.1% (189,259) |
Aggregate household income in East Jefferson in 2022: $677,349,533
Median family income in East Jefferson in 2022:| East Jefferson: | $62,213 |
| State: | $65,080 |
Number of families with income < $10k:| East Jefferson: | 5.8% (403) |
| State: | 5.3% (147,493) |
Number of families with income $10k - 20k:| East Jefferson: | 5.7% (397) |
| State: | 6.3% (174,531) |
Number of families with income $20k - 30k:| East Jefferson: | 6.0% (418) |
| State: | 8.6% (238,528) |
Number of families with income $30k - 40k:| East Jefferson: | 9.7% (681) |
| Texas: | 9.1% (251,999) |
Number of families with income $40k - 50k:| East Jefferson: | 16.2% (1,135) |
| State: | 8.6% (240,188) |
Number of families with income $50k - 60k:| East Jefferson: | 9.5% (664) |
| State: | 8.0% (223,566) |
Number of families with income $60k - 75k:| East Jefferson: | 11.4% (802) |
| State: | 10.9% (302,688) |
Number of families with income $75k - 100k:| East Jefferson: | 16.2% (1,133) |
| State: | 14.3% (398,554) |
Number of families with income $100k - 125k:| East Jefferson: | 8.3% (582) |
| State: | 9.5% (264,007) |
Number of families with income $125k - 150k:| East Jefferson: | 1.6% (115) |
| State: | 6.2% (171,274) |
Number of families with income $150k - 200k:| East Jefferson: | 8.2% (577) |
| State: | 7.3% (202,259) |
Number of families with income > $200k:| East Jefferson: | 1.4% (99) |
| Texas: | 5.9% (165,129) |
Median non-family income in East Jefferson in 2022:| East Jefferson: | $28,917 |
| Texas: | $39,934 |
Change in median non-family income between 2000 and 2022:| East Jefferson, Texas: | +83.8% |
| State: | +109.1% |
Median per capita income in East Jefferson in 2022:| East Jefferson: | $20,152 |
| Texas: | $24,862 |
Change in median per capita income between 2000 and 2022:| East Jefferson, Texas: | +87.6% |
| State: | +130.8% |
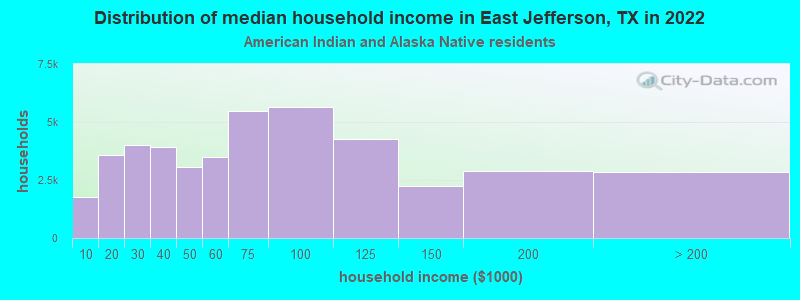
Income statistics for American Indian and Alaska Native residents
Median household income in East Jefferson, TX in 2022:| East Jefferson: | $69,821 |
| State: | $65,765 |
Change in median household income between 2000 and 2022:| East Jefferson, Texas: | +93.7% |
| State: | +88.3% |
Number of households with income < $10k:| East Jefferson: | 4.1% (1,757) |
| State: | 4.1% (3,398) |
Number of households with income $10k - 20k:| East Jefferson: | 8.3% (3,592) |
| State: | 8.3% (6,949) |
Number of households with income $20k - 30k:| East Jefferson: | 9.3% (4,002) |
| State: | 9.3% (7,742) |
Number of households with income $30k - 40k:| East Jefferson: | 9.1% (3,938) |
| State: | 9.1% (7,627) |
Number of households with income $40k - 50k:| East Jefferson: | 7.1% (3,064) |
| Texas: | 7.1% (5,922) |
Number of households with income $50k - 60k:| East Jefferson: | 8.1% (3,496) |
| State: | 8.1% (6,761) |
Number of households with income $60k - 75k:| East Jefferson: | 12.7% (5,470) |
| Texas: | 12.7% (10,588) |
Number of households with income $75k - 100k:| East Jefferson: | 13.0% (5,637) |
| State: | 13.0% (10,903) |
Number of households with income $100k - 125k:| East Jefferson: | 9.9% (4,268) |
| State: | 9.9% (8,256) |
Number of households with income $125k - 150k:| East Jefferson: | 5.2% (2,249) |
| Texas: | 5.2% (4,355) |
Number of households with income $150k - 200k:| East Jefferson: | 6.7% (2,903) |
| State: | 6.7% (5,623) |
Number of households with income > $200k:| East Jefferson: | 6.6% (2,850) |
| Texas: | 6.6% (5,522) |
Aggregate household income in East Jefferson in 2022: $33,042,548
Median family income in East Jefferson in 2022:| East Jefferson: | $86,152 |
| Texas: | $72,369 |
Number of families with income $10k - 20k:| East Jefferson: | 7.2% (21) |
| State: | 8.0% (4,891) |
Number of families with income $20k - 30k:| East Jefferson: | 13.0% (38) |
| State: | 7.3% (4,502) |
Number of families with income $30k - 40k:| East Jefferson: | 8.3% (24) |
| State: | 7.5% (4,592) |
Number of families with income $40k - 50k:| East Jefferson: | 11.7% (34) |
| State: | 7.9% (4,855) |
Number of families with income $50k - 60k:| East Jefferson: | 3.4% (10) |
| Texas: | 7.1% (4,347) |
Number of families with income $60k - 75k:| East Jefferson: | 7.1% (21) |
| Texas: | 12.1% (7,429) |
Number of families with income $75k - 100k:| East Jefferson: | 41.0% (118) |
| State: | 14.4% (8,852) |
Number of families with income $100k - 125k:| East Jefferson: | 8.3% (24) |
| State: | 11.4% (6,997) |
Median per capita income in East Jefferson in 2022:| East Jefferson: | $11,002 |
| State: | $28,166 |
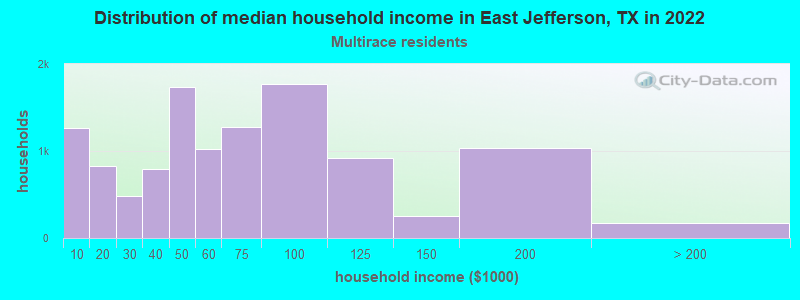
Income statistics for Multirace residents
Median household income in East Jefferson, TX in 2022:| East Jefferson: | $54,617 |
| State: | $62,748 |
Change in median household income between 2000 and 2022:| East Jefferson, Texas: | +121.9% |
| State: | +92.3% |
Number of households with income < $10k:| East Jefferson: | 10.9% (1,259) |
| State: | 5.5% (122,324) |
Number of households with income $10k - 20k:| East Jefferson: | 7.2% (825) |
| State: | 8.2% (182,232) |
Number of households with income $20k - 30k:| East Jefferson: | 4.2% (485) |
| State: | 8.5% (189,456) |
Number of households with income $30k - 40k:| East Jefferson: | 6.9% (798) |
| State: | 8.9% (197,499) |
Number of households with income $40k - 50k:| East Jefferson: | 15.0% (1,736) |
| State: | 8.7% (191,735) |
Number of households with income $50k - 60k:| East Jefferson: | 8.8% (1,020) |
| Texas: | 8.0% (177,535) |
Number of households with income $60k - 75k:| East Jefferson: | 11.1% (1,277) |
| Texas: | 10.5% (232,479) |
Number of households with income $75k - 100k:| East Jefferson: | 15.3% (1,767) |
| Texas: | 13.1% (290,448) |
Number of households with income $100k - 125k:| East Jefferson: | 7.9% (917) |
| State: | 8.6% (191,595) |
Number of households with income $125k - 150k:| East Jefferson: | 2.2% (249) |
| Texas: | 6.0% (133,361) |
Number of households with income $150k - 200k:| East Jefferson: | 8.9% (1,031) |
| State: | 7.2% (159,195) |
Number of households with income > $200k:| East Jefferson: | 1.5% (174) |
| State: | 6.7% (148,064) |
Aggregate household income in East Jefferson in 2022: $426,658,073
Median family income in East Jefferson in 2022:| East Jefferson: | $55,815 |
| State: | $69,780 |
Number of families with income < $10k:| East Jefferson: | 5.0% (190) |
| State: | 4.4% (70,825) |
Number of families with income $10k - 20k:| East Jefferson: | 9.7% (371) |
| Texas: | 5.9% (95,279) |
Number of families with income $20k - 30k:| East Jefferson: | 9.8% (373) |
| State: | 7.8% (126,627) |
Number of families with income $30k - 40k:| East Jefferson: | 6.1% (233) |
| State: | 8.5% (137,626) |
Number of families with income $40k - 50k:| East Jefferson: | 19.4% (741) |
| State: | 8.4% (135,809) |
Number of families with income $50k - 60k:| East Jefferson: | 17.3% (662) |
| State: | 7.9% (127,739) |
Number of families with income $60k - 75k:| East Jefferson: | 3.6% (138) |
| State: | 10.5% (169,549) |
Number of families with income $75k - 100k:| East Jefferson: | 27.7% (1,058) |
| Texas: | 14.0% (226,284) |
Number of families with income > $200k:| East Jefferson: | 1.4% (53) |
| Texas: | 7.9% (127,299) |
Median non-family income in East Jefferson in 2022:| East Jefferson: | $38,415 |
| State: | $40,634 |
Change in median non-family income between 2000 and 2022:| East Jefferson, Texas: | +128.9% |
| Texas: | +77.2% |
Median per capita income in East Jefferson in 2022:| East Jefferson: | $21,731 |
| State: | $26,785 |
Change in median per capita income between 2000 and 2022:| East Jefferson, Texas: | +72.6% |
| State: | +110.9% |
Income statistics for other residents
Number of households with income < $10k:| East Jefferson: | 5.9% (804) |
| Texas: | 5.9% (54,162) |
Number of households with income $10k - 20k:| East Jefferson: | 6.8% (934) |
| State: | 6.8% (62,891) |
Number of households with income $20k - 30k:| East Jefferson: | 10.6% (1,444) |
| State: | 10.6% (97,294) |
Number of households with income $30k - 40k:| East Jefferson: | 10.9% (1,480) |
| State: | 10.8% (99,670) |
Number of households with income $40k - 50k:| East Jefferson: | 9.3% (1,270) |
| State: | 9.3% (85,548) |
Number of households with income $50k - 60k:| East Jefferson: | 9.0% (1,229) |
| State: | 9.0% (82,757) |
Number of households with income $60k - 75k:| East Jefferson: | 10.9% (1,490) |
| State: | 10.9% (100,326) |
Number of households with income $75k - 100k:| East Jefferson: | 14.0% (1,912) |
| State: | 14.0% (128,767) |
Number of households with income $100k - 125k:| East Jefferson: | 8.2% (1,117) |
| State: | 8.2% (75,218) |
Number of households with income $125k - 150k:| East Jefferson: | 4.8% (657) |
| State: | 4.8% (44,223) |
Number of households with income $150k - 200k:| East Jefferson: | 5.6% (763) |
| State: | 5.6% (51,376) |
Number of households with income > $200k:| East Jefferson: | 4.0% (540) |
| State: | 4.0% (36,393) |
Aggregate household income in East Jefferson in 2022: $177,590,875
Median family income in East Jefferson in 2022:| East Jefferson: | $59,175 |
| Texas: | $60,064 |
Number of families with income < $10k:| East Jefferson: | 4.8% (118) |
| State: | 6.8% (47,502) |
Number of families with income $10k - 20k:| East Jefferson: | 4.3% (106) |
| State: | 6.0% (41,763) |
Number of families with income $20k - 30k:| East Jefferson: | 5.2% (128) |
| State: | 9.9% (68,761) |
Number of families with income $30k - 40k:| East Jefferson: | 6.6% (164) |
| State: | 9.7% (67,685) |
Number of families with income $40k - 50k:| East Jefferson: | 7.0% (173) |
| State: | 9.0% (62,441) |
Number of families with income $50k - 60k:| East Jefferson: | 5.2% (128) |
| Texas: | 8.5% (59,321) |
Number of families with income $60k - 75k:| East Jefferson: | 8.8% (219) |
| Texas: | 11.2% (77,588) |
Number of families with income $75k - 100k:| East Jefferson: | 13.8% (341) |
| Texas: | 14.5% (101,032) |
Number of families with income $100k - 125k:| East Jefferson: | 13.8% (342) |
| Texas: | 8.8% (61,439) |
Number of families with income $125k - 150k:| East Jefferson: | 16.6% (410) |
| State: | 5.1% (35,727) |
Number of families with income $150k - 200k:| East Jefferson: | 13.9% (344) |
| Texas: | 5.9% (41,211) |
Median non-family income in East Jefferson in 2022:| East Jefferson: | $60,254 |
| State: | $38,690 |
Change in median non-family income between 2000 and 2022:| East Jefferson, Texas: | +123.9% |
| Texas: | +90.2% |
Median per capita income in East Jefferson in 2022:| East Jefferson: | $16,953 |
| Texas: | $23,899 |
Change in median per capita income between 2000 and 2022:| East Jefferson, Texas: | +59.1% |
| State: | +135.2% |