The median household income in Ellensburg, WA in 2022 was $54,313, which was 68.1% less than the median annual income of $91,306 across the entire state of Washington. Compared to the median income of $20,034 in 2000 this represents an increase of 63.1%. The per capita income in 2022 was $31,775, which means an increase of 57.0% compared to 2000 when it was $13,662.
Whole page based on the data from 2000 / 2022 when the population of Ellensburg, Washington was 15,414 / 19,243
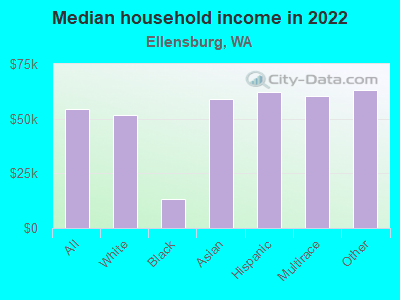
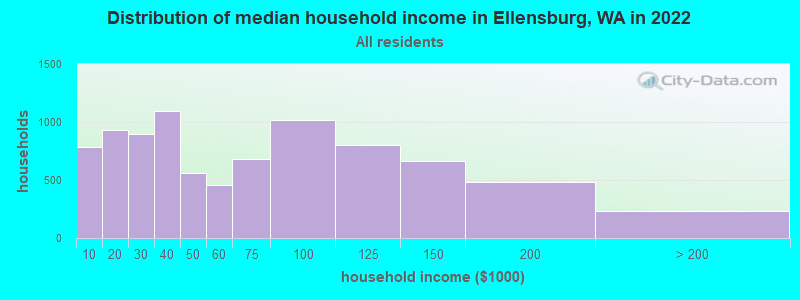
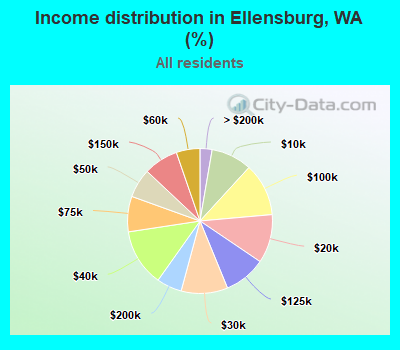
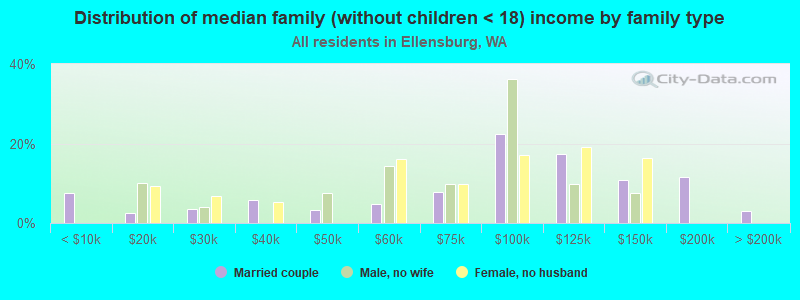
Income statistics for all residents
Median household income in Ellensburg, WA in 2022:
Ellensburg:
$54,314
State:
$91,306
Number of households with income < $10k:
Ellensburg:
9.1% (784)
State:
4.5% (139,331)
Number of households with income $10k - 20k:
Ellensburg:
10.9% (935)
State:
5.0% (154,508)
Number of households with income $20k - 30k:
Ellensburg:
10.4% (893)
State:
5.4% (166,555)
Number of households with income $30k - 40k:
Ellensburg:
12.8% (1,099)
Washington:
5.5% (170,324)
Number of households with income $40k - 50k:
Ellensburg:
6.5% (559)
State:
6.0% (183,941)
Number of households with income $50k - 60k:
Ellensburg:
5.3% (453)
State:
6.1% (187,395)
Number of households with income $60k - 75k:
Ellensburg:
7.9% (680)
State:
8.7% (266,771)
Number of households with income $75k - 100k:
Ellensburg:
11.8% (1,013)
State:
13.1% (404,672)
Number of households with income $100k - 125k:
Ellensburg:
9.3% (804)
State:
11.0% (337,911)
Number of households with income $125k - 150k:
Ellensburg:
7.7% (664)
Washington:
8.0% (244,934)
Number of households with income $150k - 200k:
Ellensburg:
5.6% (484)
Washington:
10.5% (323,812)
Number of households with income > $200k:
Ellensburg:
2.7% (232)
Washington:
16.2% (499,799)
Aggregate household income in Ellensburg in 2022: $618,675,937
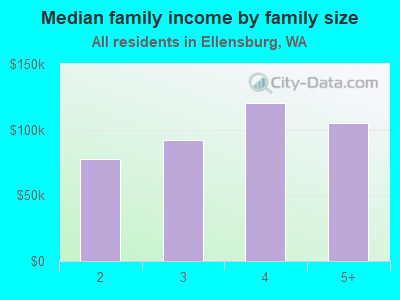
Median family income in Ellensburg in 2022:
Ellensburg:
$91,993
Washington:
$109,192
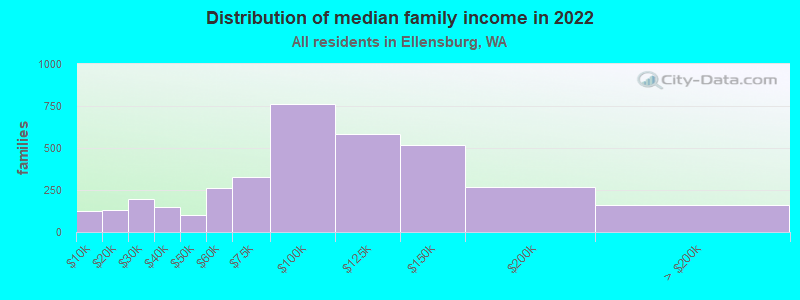
Number of families with income < $10k:
Ellensburg:
3.5% (125)
State:
2.9% (55,953)
Number of families with income $10k - 20k:
Ellensburg:
3.6% (128)
Washington:
2.6% (50,138)
Number of families with income $20k - 30k:
Ellensburg:
5.4% (195)
State:
3.2% (61,974)
Number of families with income $30k - 40k:
Ellensburg:
4.1% (146)
Washington:
4.1% (80,240)
Number of families with income $40k - 50k:
Ellensburg:
2.9% (104)
State:
4.9% (94,310)
Number of families with income $50k - 60k:
Ellensburg:
7.3% (260)
State:
5.3% (101,674)
Number of families with income $60k - 75k:
Ellensburg:
9.2% (329)
Washington:
8.2% (158,348)
Number of families with income $75k - 100k:
Ellensburg:
21.3% (764)
State:
13.8% (267,812)
Number of families with income $100k - 125k:
Ellensburg:
16.3% (582)
State:
12.4% (240,213)
Number of families with income $125k - 150k:
Ellensburg:
14.5% (518)
State:
9.3% (180,011)
Number of families with income $150k - 200k:
Ellensburg:
7.5% (268)
Washington:
13.0% (250,874)
Number of families with income > $200k:
Ellensburg:
4.5% (161)
State:
20.4% (393,898)
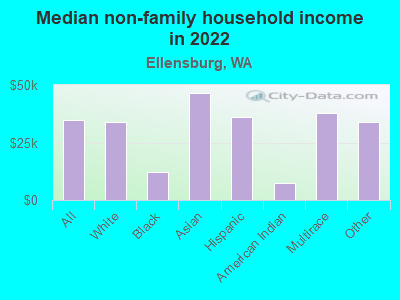
Median non-family income in Ellensburg in 2022:
Ellensburg:
$34,976
State:
$57,299
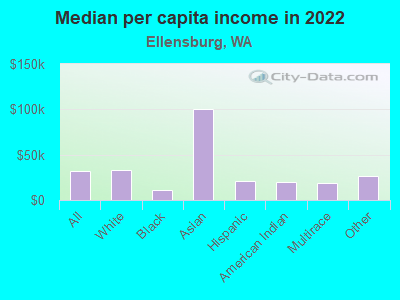
Median per capita income in Ellensburg in 2022:
Ellensburg:
$31,775
State:
$50,764
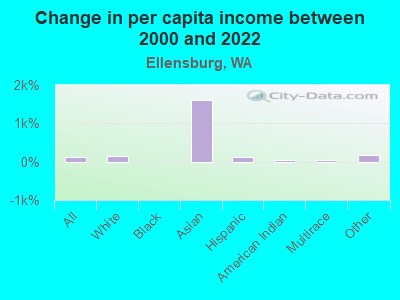
Change in median per capita income between 2000 and 2022:
Ellensburg, Washington:
+132.6%
State:
+121.0%
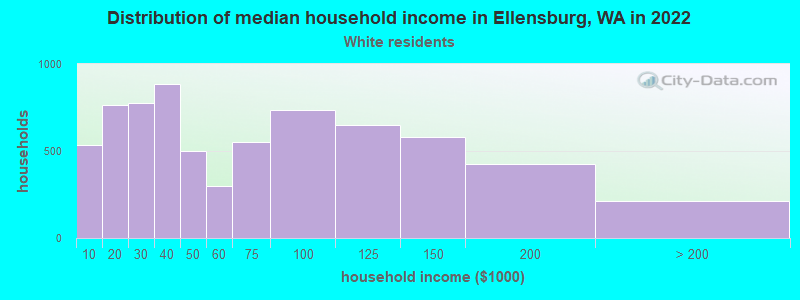
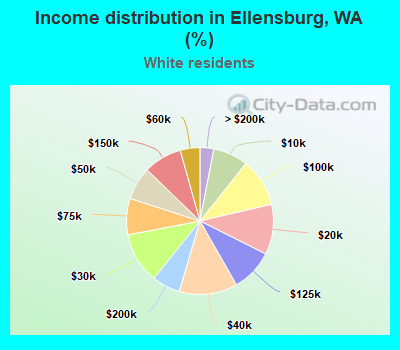
Income statistics for White residents
Median household income in Ellensburg, WA in 2022:
Ellensburg:
$51,869
State:
$91,916
Number of households with income < $10k:
Ellensburg:
7.7% (532)
Washington:
4.3% (95,850)
Number of households with income $10k - 20k:
Ellensburg:
11.0% (762)
Washington:
4.8% (106,421)
Number of households with income $20k - 30k:
Ellensburg:
11.2% (775)
State:
5.5% (122,860)
Number of households with income $30k - 40k:
Ellensburg:
12.8% (885)
State:
5.4% (119,627)
Number of households with income $40k - 50k:
Ellensburg:
7.3% (502)
Washington:
5.9% (132,276)
Number of households with income $50k - 60k:
Ellensburg:
4.3% (299)
Washington:
6.1% (136,212)
Number of households with income $60k - 75k:
Ellensburg:
8.0% (551)
State:
8.8% (196,086)
Number of households with income $75k - 100k:
Ellensburg:
10.6% (734)
State:
13.4% (299,192)
Number of households with income $100k - 125k:
Ellensburg:
9.4% (647)
State:
11.3% (252,209)
Number of households with income $125k - 150k:
Ellensburg:
8.4% (583)
State:
7.9% (175,962)
Number of households with income $150k - 200k:
Ellensburg:
6.2% (428)
Washington:
10.7% (239,156)
Number of households with income > $200k:
Ellensburg:
3.0% (210)
State:
16.1% (359,917)
Aggregate household income in Ellensburg in 2022: $509,581,631
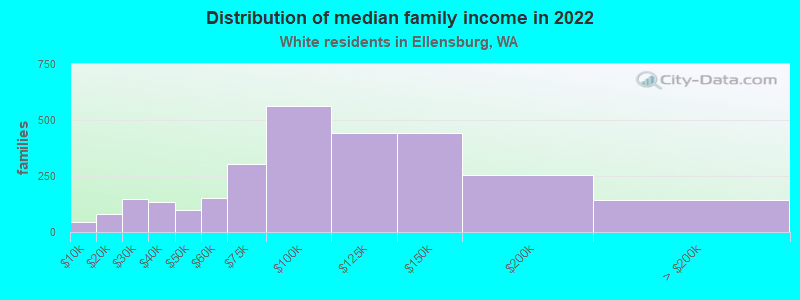
Median family income in Ellensburg in 2022:
Ellensburg:
$92,441
State:
$112,511
Number of families with income < $10k:
Ellensburg:
1.6% (44)
Washington:
2.4% (33,676)
Number of families with income $10k - 20k:
Ellensburg:
2.8% (79)
State:
2.0% (28,228)
Number of families with income $20k - 30k:
Ellensburg:
5.3% (148)
State:
2.9% (39,288)
Number of families with income $30k - 40k:
Ellensburg:
4.7% (132)
Washington:
3.6% (50,190)
Number of families with income $40k - 50k:
Ellensburg:
3.5% (99)
State:
4.6% (63,009)
Number of families with income $50k - 60k:
Ellensburg:
5.5% (153)
State:
5.0% (69,270)
Number of families with income $60k - 75k:
Ellensburg:
10.8% (302)
State:
8.2% (112,369)
Number of families with income $75k - 100k:
Ellensburg:
20.0% (561)
State:
14.1% (194,214)
Number of families with income $100k - 125k:
Ellensburg:
15.8% (444)
State:
13.2% (182,184)
Number of families with income $125k - 150k:
Ellensburg:
15.8% (444)
Washington:
9.5% (130,928)
Number of families with income $150k - 200k:
Ellensburg:
9.1% (256)
State:
13.7% (188,621)
Number of families with income > $200k:
Ellensburg:
5.1% (143)
State:
20.8% (285,982)
Median non-family income in Ellensburg in 2022:
Ellensburg:
$33,797
State:
$56,103
Median per capita income in Ellensburg in 2022:
Ellensburg:
$33,369
State:
$55,212
Change in median per capita income between 2000 and 2022:
Ellensburg, Washington:
+137.9%
Washington:
+123.8%
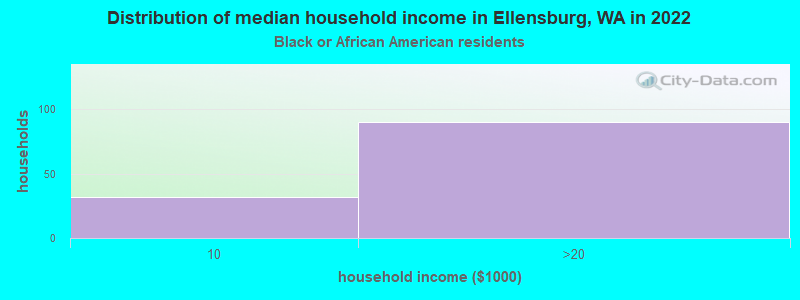
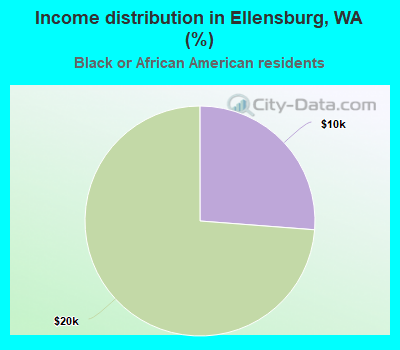
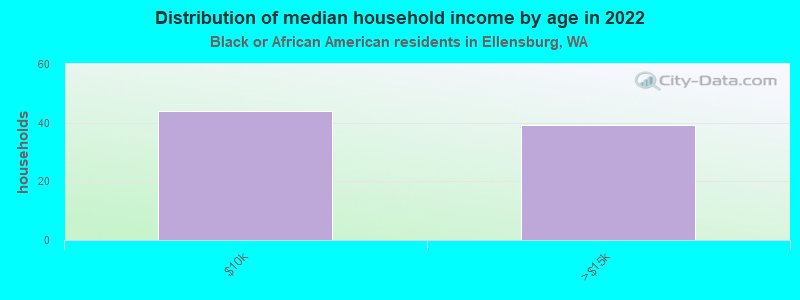
Income statistics for Black or African American residents
Median household income in Ellensburg, WA in 2022:
Ellensburg:
$13,481
State:
$68,202
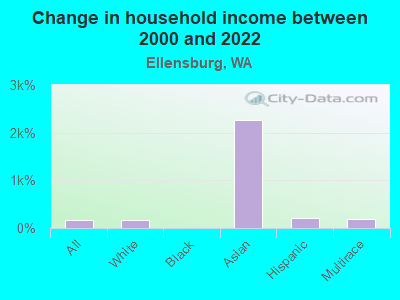
Change in median household income between 2000 and 2022:
Ellensburg, Washington:
+2.7%
State:
+89.9%
Number of households with income < $10k:
Ellensburg:
26.2% (32)
Washington:
7.2% (8,014)
Number of households with income $10k - 20k:
Ellensburg:
73.8% (90)
State:
8.0% (8,904)
Number of households with income $20k - 30k:
Ellensburg:
0.0% (0)
Washington:
7.4% (8,207)
Number of households with income $30k - 40k:
Ellensburg:
0.0% (0)
State:
5.6% (6,220)
Number of households with income $40k - 50k:
Ellensburg:
0.0% (0)
State:
9.5% (10,585)
Number of households with income $50k - 60k:
Ellensburg:
0.0% (0)
Washington:
7.3% (8,078)
Number of households with income $60k - 75k:
Ellensburg:
0.0% (0)
Washington:
8.7% (9,704)
Number of households with income $75k - 100k:
Ellensburg:
0.0% (0)
State:
12.9% (14,315)
Number of households with income $100k - 125k:
Ellensburg:
0.0% (0)
State:
7.7% (8,592)
Number of households with income $125k - 150k:
Ellensburg:
0.0% (0)
State:
8.9% (9,840)
Number of households with income $150k - 200k:
Ellensburg:
0.0% (0)
Washington:
7.6% (8,434)
Number of households with income > $200k:
Ellensburg:
0.0% (0)
State:
9.1% (10,075)
Aggregate household income in Ellensburg in 2022: $1,375,184
Median non-family income in Ellensburg in 2022:
Ellensburg:
$12,337
State:
$49,169
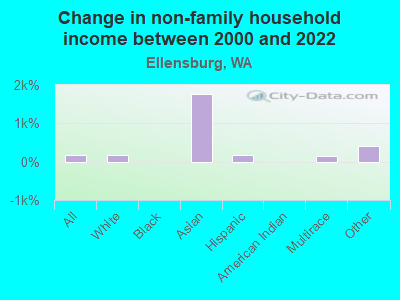
Change in median non-family income between 2000 and 2022:: -1.3%
Ellensburg, Washington:
-1.3%
State:
+87.7%
Median per capita income in Ellensburg in 2022:
Ellensburg:
$11,404
Washington:
$38,209
Change in median per capita income between 2000 and 2022:: -8.5%
Ellensburg, Washington:
-8.5%
State:
+115.3%
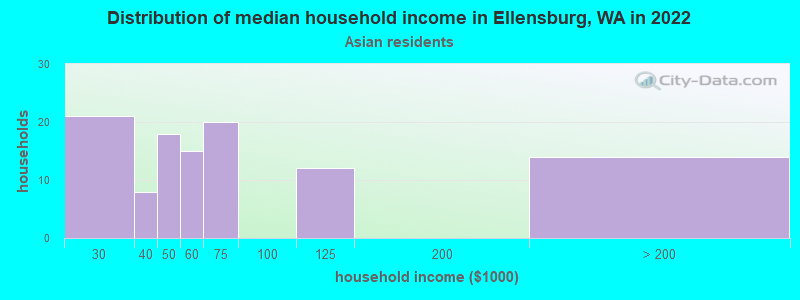
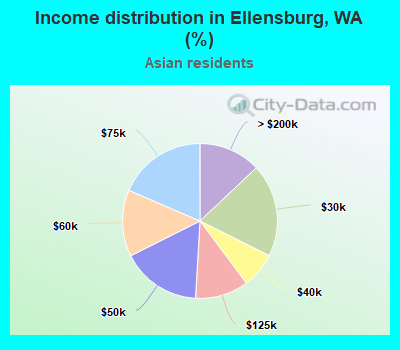
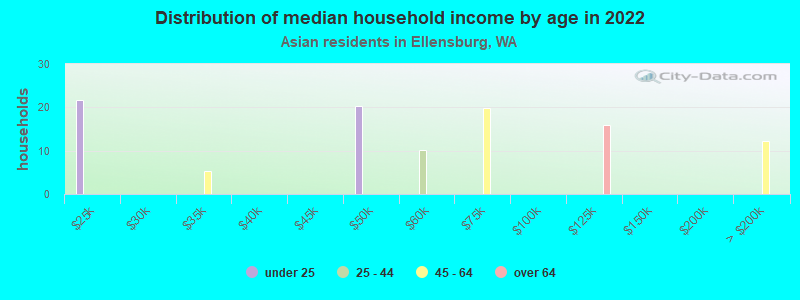
Income statistics for Asian residents
Median household income in Ellensburg, WA in 2022:
Ellensburg:
$58,907
State:
$125,692
Number of households with income < $10k:
Ellensburg:
0.0% (0)
Washington:
4.9% (14,099)
Number of households with income $10k - 20k:
Ellensburg:
0.0% (0)
State:
3.5% (9,873)
Number of households with income $20k - 30k:
Ellensburg:
19.4% (21)
State:
2.9% (8,352)
Number of households with income $30k - 40k:
Ellensburg:
7.4% (8)
State:
4.0% (11,415)
Number of households with income $40k - 50k:
Ellensburg:
16.7% (18)
State:
4.0% (11,421)
Number of households with income $50k - 60k:
Ellensburg:
13.9% (15)
Washington:
4.2% (12,100)
Number of households with income $60k - 75k:
Ellensburg:
18.5% (20)
State:
6.3% (17,903)
Number of households with income $75k - 100k:
Ellensburg:
0.0% (0)
Washington:
10.4% (29,663)
Number of households with income $100k - 125k:
Ellensburg:
11.1% (12)
State:
9.4% (26,839)
Number of households with income $125k - 150k:
Ellensburg:
0.0% (0)
State:
8.5% (24,200)
Number of households with income $150k - 200k:
Ellensburg:
0.0% (0)
Washington:
12.6% (35,976)
Number of households with income > $200k:
Ellensburg:
13.0% (14)
State:
29.2% (83,109)
Aggregate household income in Ellensburg in 2022: $14,391,491
Median non-family income in Ellensburg in 2022:
Ellensburg:
$46,611
Washington:
$84,971
Median per capita income in Ellensburg in 2022:
Ellensburg:
$100,413
State:
$67,666
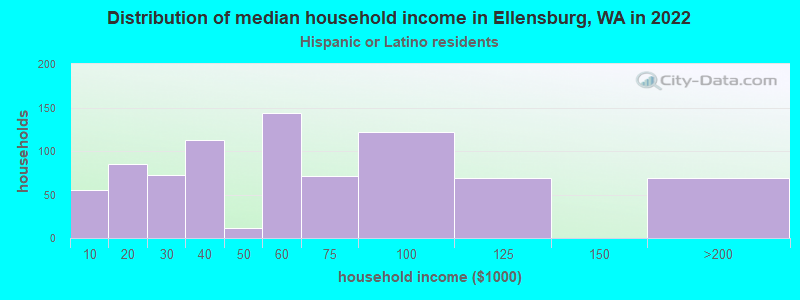
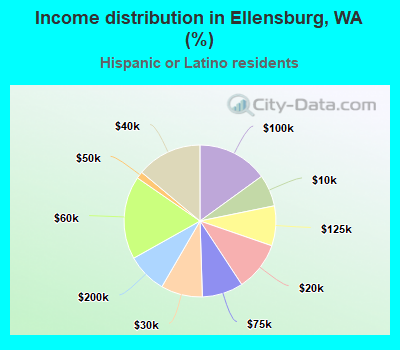
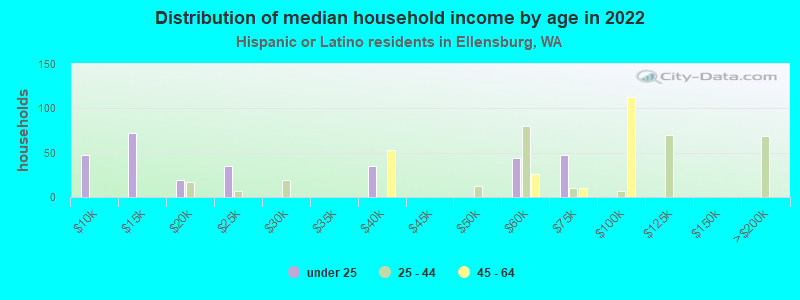
Income statistics for Hispanic or Latino residents
Median household income in Ellensburg, WA in 2022:
Ellensburg:
$62,136
Washington:
$74,770
Number of households with income < $10k:
Ellensburg:
6.8% (55)
State:
4.9% (14,456)
Number of households with income $10k - 20k:
Ellensburg:
10.5% (85)
Washington:
5.3% (15,449)
Number of households with income $20k - 30k:
Ellensburg:
8.9% (72)
State:
6.8% (20,016)
Number of households with income $30k - 40k:
Ellensburg:
13.9% (113)
State:
7.7% (22,548)
Number of households with income $40k - 50k:
Ellensburg:
1.5% (12)
State:
7.3% (21,450)
Number of households with income $50k - 60k:
Ellensburg:
17.7% (144)
State:
7.7% (22,744)
Number of households with income $60k - 75k:
Ellensburg:
8.7% (71)
Washington:
10.5% (30,737)
Number of households with income $75k - 100k:
Ellensburg:
15.0% (122)
State:
14.9% (43,843)
Number of households with income $100k - 125k:
Ellensburg:
8.5% (69)
Washington:
11.1% (32,554)
Number of households with income $125k - 150k:
Ellensburg:
0.0% (0)
State:
7.4% (21,624)
Number of households with income $150k - 200k:
Ellensburg:
8.5% (69)
Washington:
7.3% (21,360)
Number of households with income > $200k:
Ellensburg:
0.0% (0)
State:
9.2% (27,055)
Aggregate household income in Ellensburg in 2022: $55,104,371
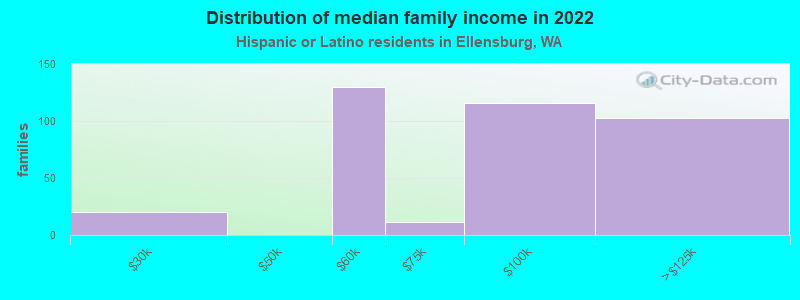
Median family income in Ellensburg in 2022:
Ellensburg:
$82,105
State:
$76,866
Number of families with income $20k - 30k:
Ellensburg:
5.4% (20)
State:
5.6% (12,052)
Number of families with income $50k - 60k:
Ellensburg:
34.3% (130)
State:
7.9% (16,852)
Number of families with income $60k - 75k:
Ellensburg:
2.9% (11)
State:
11.4% (24,342)
Number of families with income $75k - 100k:
Ellensburg:
30.4% (116)
State:
14.4% (30,698)
Number of families with income $100k - 125k:
Ellensburg:
27.0% (103)
State:
11.4% (24,331)
Median non-family income in Ellensburg in 2022:
Ellensburg:
$36,174
Washington:
$54,173
Median per capita income in Ellensburg in 2022:
Ellensburg:
$21,137
State:
$28,252
Change in median per capita income between 2000 and 2022:
Ellensburg, Washington:
+130.6%
State:
+150.2%
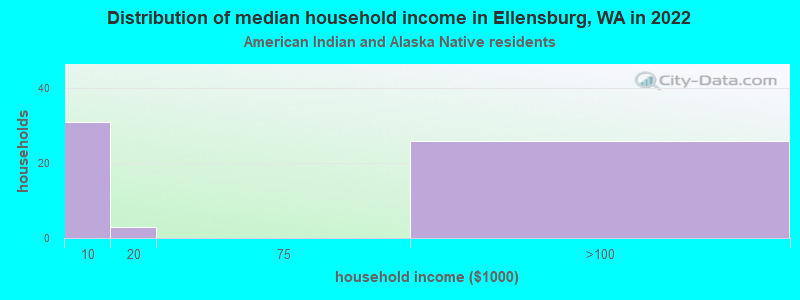
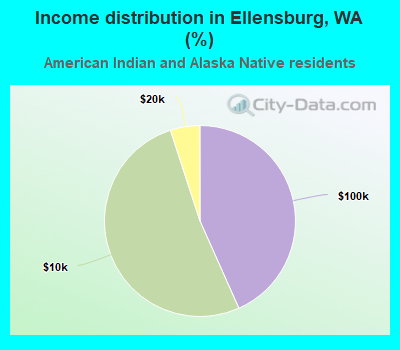
Income statistics for American Indian and Alaska Native residents
Number of households with income < $10k:
Ellensburg:
51.7% (31)
State:
5.9% (1,768)
Number of households with income $10k - 20k:
Ellensburg:
5.0% (3)
State:
8.9% (2,694)
Number of households with income $20k - 30k:
Ellensburg:
0.0% (0)
State:
8.0% (2,412)
Number of households with income $30k - 40k:
Ellensburg:
0.0% (0)
Washington:
7.7% (2,327)
Number of households with income $40k - 50k:
Ellensburg:
0.0% (0)
State:
5.8% (1,755)
Number of households with income $50k - 60k:
Ellensburg:
0.0% (0)
State:
7.5% (2,259)
Number of households with income $60k - 75k:
Ellensburg:
0.0% (0)
State:
8.8% (2,669)
Number of households with income $75k - 100k:
Ellensburg:
43.3% (26)
Washington:
12.8% (3,861)
Number of households with income $100k - 125k:
Ellensburg:
0.0% (0)
Washington:
12.0% (3,618)
Number of households with income $125k - 150k:
Ellensburg:
0.0% (0)
State:
8.6% (2,580)
Number of households with income $150k - 200k:
Ellensburg:
0.0% (0)
State:
5.9% (1,774)
Number of households with income > $200k:
Ellensburg:
0.0% (0)
Washington:
8.1% (2,447)
Aggregate household income in Ellensburg in 2022: $2,690,395
Median non-family income in Ellensburg in 2022:
Ellensburg:
$7,412
Washington:
$35,591
Change in median non-family income between 2000 and 2022:: -15.3%
Ellensburg, Washington:
-15.3%
Washington:
+61.8%
Median per capita income in Ellensburg in 2022:
Ellensburg:
$19,558
State:
$27,053
Change in median per capita income between 2000 and 2022:
Ellensburg, Washington:
+41.9%
Washington:
+98.6%
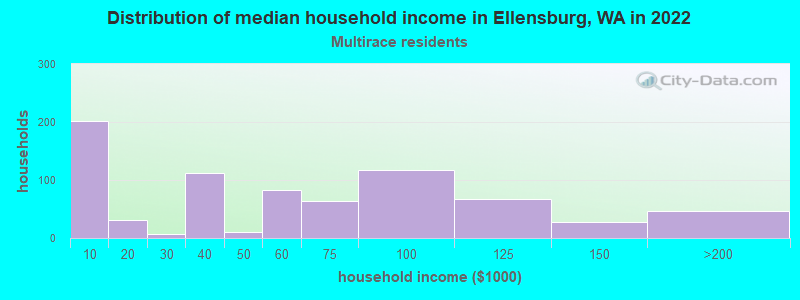
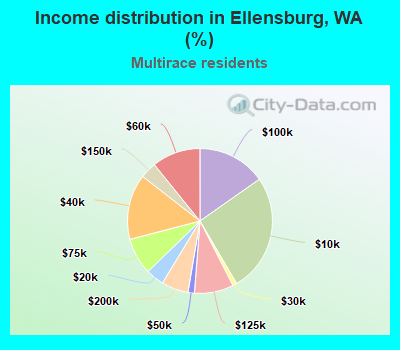
Income statistics for Multirace residents
Median household income in Ellensburg, WA in 2022:
Ellensburg:
$60,555
State:
$84,303
Number of households with income < $10k:
Ellensburg:
26.3% (202)
State:
4.3% (12,040)
Number of households with income $10k - 20k:
Ellensburg:
4.0% (31)
State:
6.6% (18,437)
Number of households with income $20k - 30k:
Ellensburg:
0.9% (7)
State:
5.2% (14,559)
Number of households with income $30k - 40k:
Ellensburg:
14.6% (112)
Washington:
6.7% (18,491)
Number of households with income $40k - 50k:
Ellensburg:
1.4% (11)
State:
6.3% (17,459)
Number of households with income $50k - 60k:
Ellensburg:
10.8% (83)
State:
6.9% (19,086)
Number of households with income $60k - 75k:
Ellensburg:
8.2% (63)
Washington:
9.1% (25,310)
Number of households with income $75k - 100k:
Ellensburg:
15.3% (117)
State:
13.5% (37,493)
Number of households with income $100k - 125k:
Ellensburg:
8.7% (67)
Washington:
10.7% (29,626)
Number of households with income $125k - 150k:
Ellensburg:
3.7% (28)
State:
8.6% (23,899)
Number of households with income $150k - 200k:
Ellensburg:
6.0% (46)
Washington:
10.2% (28,214)
Number of households with income > $200k:
Ellensburg:
0.0% (0)
Washington:
11.9% (32,947)
Aggregate household income in Ellensburg in 2022: $45,267,139
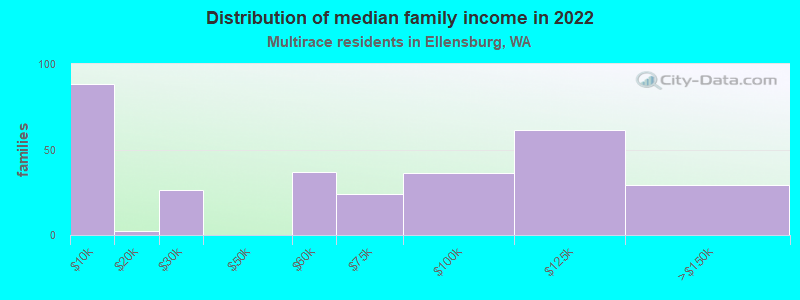
Median family income in Ellensburg in 2022:
Ellensburg:
$61,496
State:
$95,629
Number of families with income < $10k:
Ellensburg:
28.9% (88)
Washington:
3.5% (6,121)
Number of families with income $10k - 20k:
Ellensburg:
0.8% (2)
State:
4.3% (7,519)
Number of families with income $20k - 30k:
Ellensburg:
8.6% (26)
State:
4.4% (7,775)
Number of families with income $50k - 60k:
Ellensburg:
12.0% (37)
State:
5.6% (9,922)
Number of families with income $60k - 75k:
Ellensburg:
7.8% (24)
Washington:
9.7% (17,113)
Number of families with income $75k - 100k:
Ellensburg:
12.0% (37)
State:
13.6% (23,984)
Number of families with income $100k - 125k:
Ellensburg:
20.2% (62)
State:
10.4% (18,288)
Number of families with income $125k - 150k:
Ellensburg:
9.7% (30)
Washington:
10.5% (18,481)
Median non-family income in Ellensburg in 2022:
Ellensburg:
$37,966
State:
$56,573
Median per capita income in Ellensburg in 2022:
Ellensburg:
$18,442
Washington:
$32,496
Change in median per capita income between 2000 and 2022:
Ellensburg, Washington:
+37.0%
State:
+156.8%
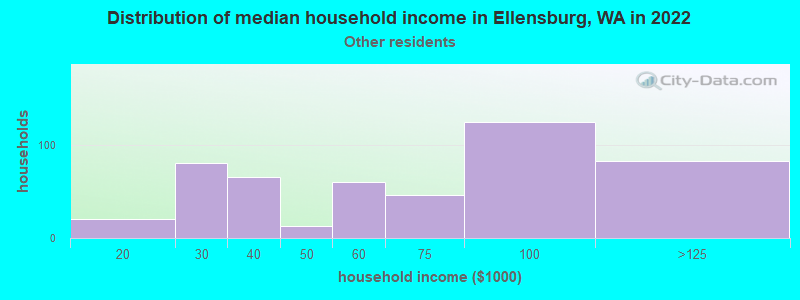
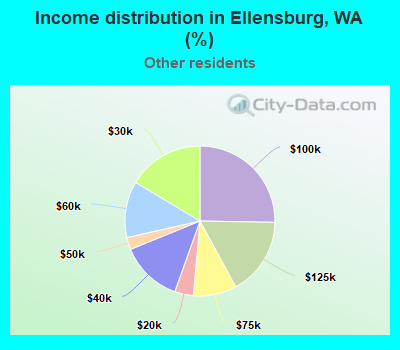
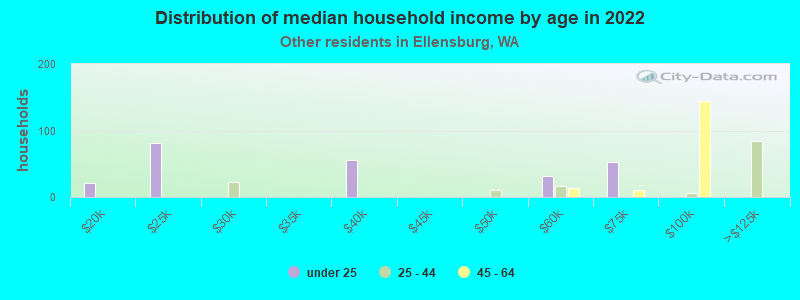
Income statistics for other residents
Median household income in Ellensburg, WA in 2022:
Ellensburg:
$62,909
State:
$69,545
Number of households with income < $10k:
Ellensburg:
0.0% (0)
State:
5.3% (6,540)
Number of households with income $10k - 20k:
Ellensburg:
4.0% (20)
State:
6.0% (7,385)
Number of households with income $20k - 30k:
Ellensburg:
16.4% (81)
State:
7.5% (9,289)
Number of households with income $30k - 40k:
Ellensburg:
13.4% (66)
Washington:
8.9% (11,015)
Number of households with income $40k - 50k:
Ellensburg:
2.6% (13)
Washington:
7.6% (9,399)
Number of households with income $50k - 60k:
Ellensburg:
12.1% (60)
State:
7.2% (8,867)
Number of households with income $60k - 75k:
Ellensburg:
9.3% (46)
Washington:
10.5% (13,032)
Number of households with income $75k - 100k:
Ellensburg:
25.3% (125)
Washington:
14.6% (18,007)
Number of households with income $100k - 125k:
Ellensburg:
16.8% (83)
State:
12.2% (15,128)
Number of households with income $125k - 150k:
Ellensburg:
0.0% (0)
State:
5.6% (6,950)
Number of households with income $150k - 200k:
Ellensburg:
0.0% (0)
State:
7.1% (8,749)
Number of households with income > $200k:
Ellensburg:
0.0% (0)
State:
7.5% (9,208)
Aggregate household income in Ellensburg in 2022: $33,546,346
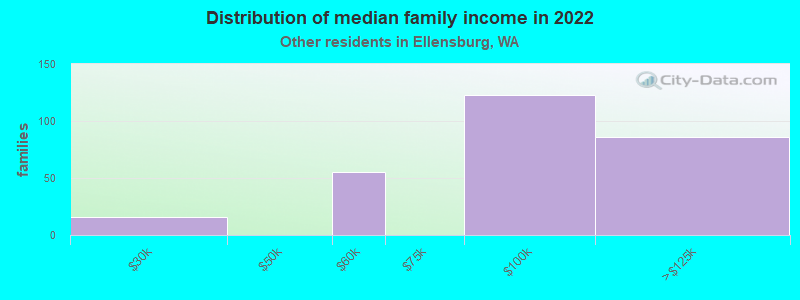
Median family income in Ellensburg in 2022:
Ellensburg:
$101,498
Washington:
$72,588
Number of families with income $20k - 30k:
Ellensburg:
5.6% (16)
Washington:
6.6% (6,293)
Number of families with income $50k - 60k:
Ellensburg:
19.7% (55)
State:
7.7% (7,357)
Number of families with income $75k - 100k:
Ellensburg:
43.9% (123)
State:
14.5% (13,800)
Number of families with income $100k - 125k:
Ellensburg:
30.8% (86)
Washington:
12.9% (12,298)
Median non-family income in Ellensburg in 2022:
Ellensburg:
$33,890
Washington:
$44,777
Median per capita income in Ellensburg in 2022:
Ellensburg:
$26,002
State:
$27,542
Discuss Ellensburg, Washington (WA) on our hugely popular Washington forum.