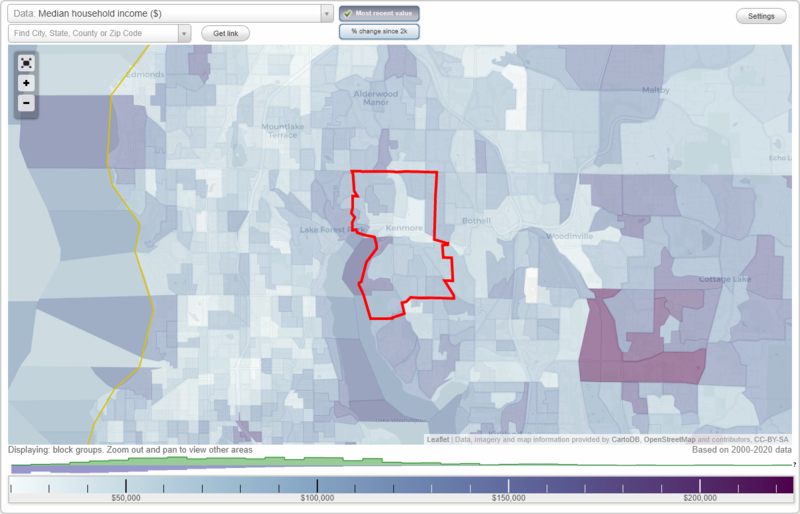
The median household income in Kenmore, WA in 2022 was $132,094, which was 30.9% greater than the median annual income of $91,306 across the entire state of Washington. Compared to the median income of $61,756 in 2000 this represents an increase of 53.2%. The per capita income in 2022 was $70,419, which means an increase of 55.0% compared to 2000 when it was $31,692.
Whole page based on the data from 2000 / 2022 when the population of Kenmore, Washington was 18,678 / 23,741
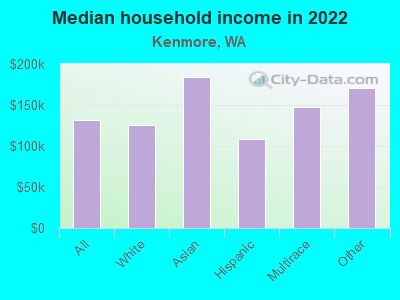
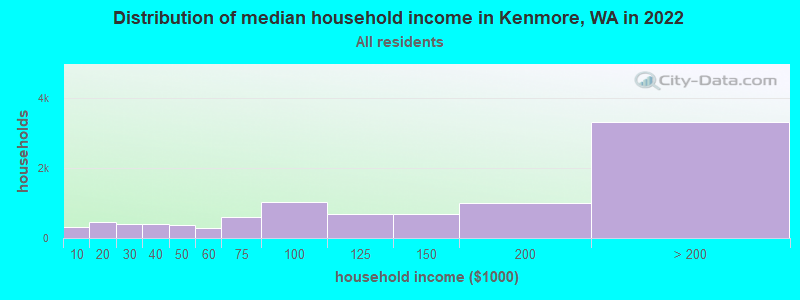
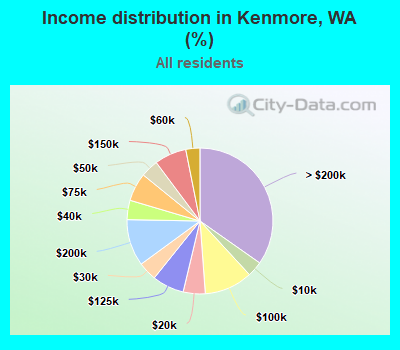
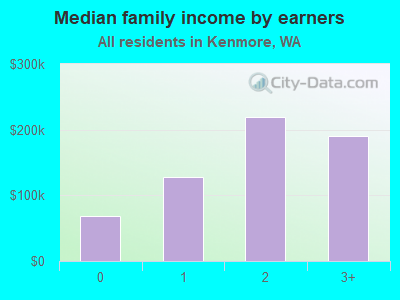
Income statistics for all residents
Median household income in Kenmore, WA in 2022:
Kenmore:
$132,094
Washington:
$91,306
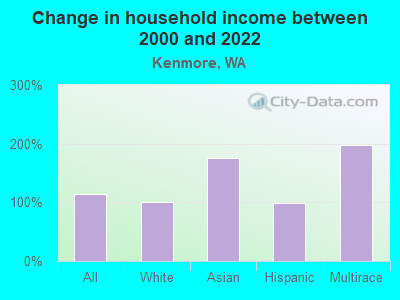
Change in median household income between 2000 and 2022:
Kenmore, Washington:
+113.9%
State:
+99.5%
Number of households with income < $10k:
Kenmore:
3.4% (325)
State:
4.5% (139,331)
Number of households with income $10k - 20k:
Kenmore:
4.9% (466)
State:
5.0% (154,508)
Number of households with income $20k - 30k:
Kenmore:
4.2% (399)
State:
5.4% (166,555)
Number of households with income $30k - 40k:
Kenmore:
4.3% (408)
Washington:
5.5% (170,324)
Number of households with income $40k - 50k:
Kenmore:
3.9% (375)
State:
6.0% (183,941)
Number of households with income $50k - 60k:
Kenmore:
3.1% (298)
Washington:
6.1% (187,395)
Number of households with income $60k - 75k:
Kenmore:
6.3% (599)
State:
8.7% (266,771)
Number of households with income $75k - 100k:
Kenmore:
10.7% (1,020)
Washington:
13.1% (404,672)
Number of households with income $100k - 125k:
Kenmore:
7.0% (673)
Washington:
11.0% (337,911)
Number of households with income $125k - 150k:
Kenmore:
7.1% (677)
Washington:
8.0% (244,934)
Number of households with income $150k - 200k:
Kenmore:
10.4% (989)
State:
10.5% (323,812)
Number of households with income > $200k:
Kenmore:
34.8% (3,318)
State:
16.2% (499,799)
Aggregate household income in Kenmore in 2022: $1,646,264,263
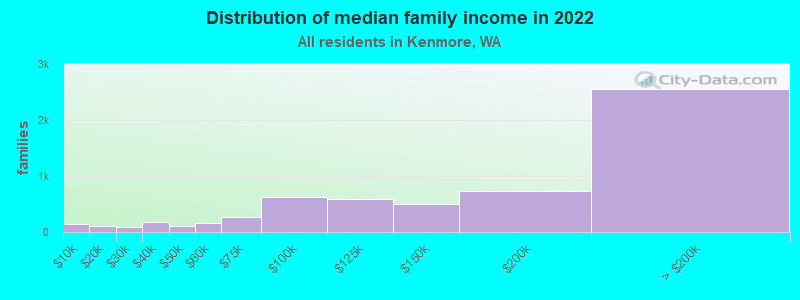
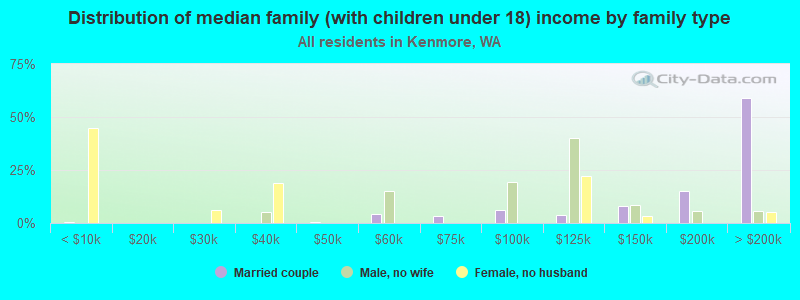
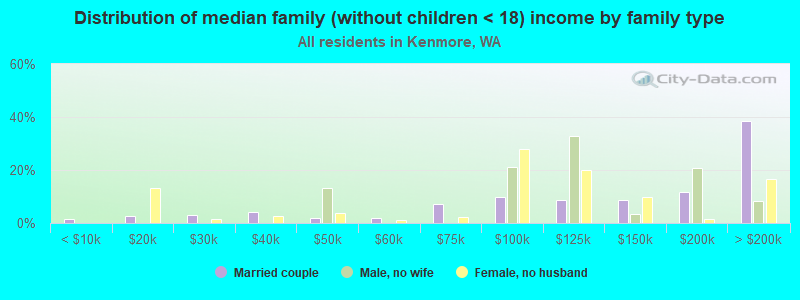
Median family income in Kenmore in 2022:
Kenmore:
$168,507
State:
$109,192
Number of families with income < $10k:
Kenmore:
2.4% (146)
State:
2.9% (55,953)
Number of families with income $10k - 20k:
Kenmore:
1.9% (115)
State:
2.6% (50,138)
Number of families with income $20k - 30k:
Kenmore:
1.4% (88)
State:
3.2% (61,974)
Number of families with income $30k - 40k:
Kenmore:
3.0% (182)
State:
4.1% (80,240)
Number of families with income $40k - 50k:
Kenmore:
1.7% (104)
State:
4.9% (94,310)
Number of families with income $50k - 60k:
Kenmore:
2.7% (162)
State:
5.3% (101,674)
Number of families with income $60k - 75k:
Kenmore:
4.5% (271)
Washington:
8.2% (158,348)
Number of families with income $75k - 100k:
Kenmore:
10.2% (620)
Washington:
13.8% (267,812)
Number of families with income $100k - 125k:
Kenmore:
9.7% (588)
State:
12.4% (240,213)
Number of families with income $125k - 150k:
Kenmore:
8.2% (501)
Washington:
9.3% (180,011)
Number of families with income $150k - 200k:
Kenmore:
12.1% (737)
State:
13.0% (250,874)
Number of families with income > $200k:
Kenmore:
42.1% (2,558)
Washington:
20.4% (393,898)
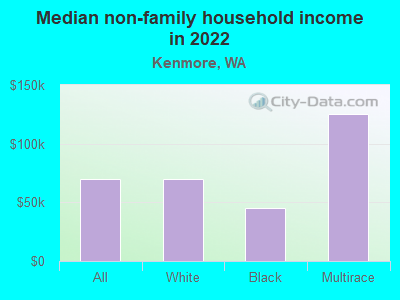
Median non-family income in Kenmore in 2022:
Kenmore:
$70,077
State:
$57,299
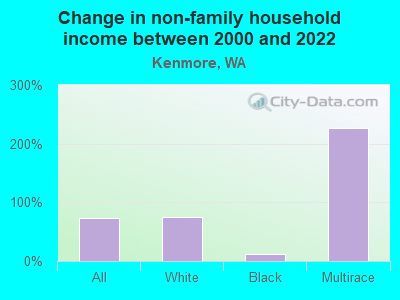
Change in median non-family income between 2000 and 2022:
Kenmore, Washington:
+74.3%
Washington:
+94.9%
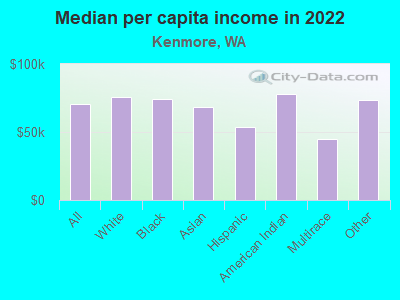
Median per capita income in Kenmore in 2022:
Kenmore:
$70,419
Washington:
$50,764
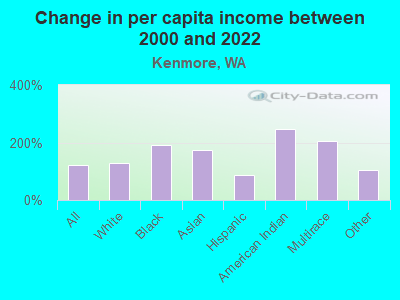
Change in median per capita income between 2000 and 2022:
Kenmore, Washington:
+122.2%
State:
+121.0%
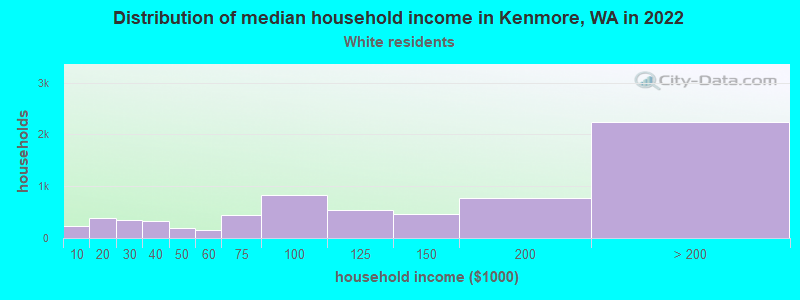
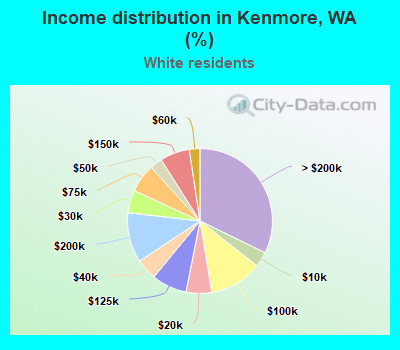
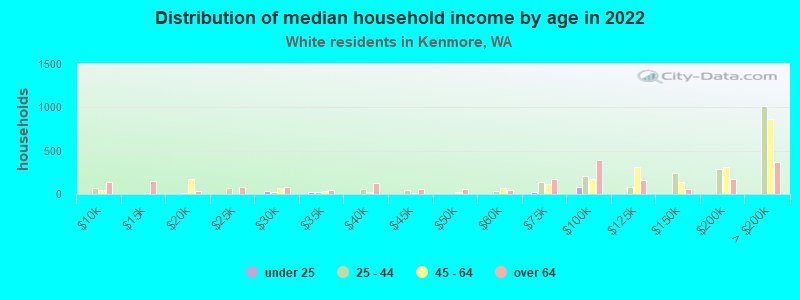
Income statistics for White residents
Median household income in Kenmore, WA in 2022:
Kenmore:
$125,192
State:
$91,916
Change in median household income between 2000 and 2022:
Kenmore, Washington:
+100.3%
State:
+95.4%
Number of households with income < $10k:
Kenmore:
3.4% (233)
State:
4.3% (95,850)
Number of households with income $10k - 20k:
Kenmore:
5.7% (395)
State:
4.8% (106,421)
Number of households with income $20k - 30k:
Kenmore:
5.0% (350)
State:
5.5% (122,860)
Number of households with income $30k - 40k:
Kenmore:
4.7% (327)
State:
5.4% (119,627)
Number of households with income $40k - 50k:
Kenmore:
2.7% (191)
State:
5.9% (132,276)
Number of households with income $50k - 60k:
Kenmore:
2.4% (164)
State:
6.1% (136,212)
Number of households with income $60k - 75k:
Kenmore:
6.4% (443)
Washington:
8.8% (196,086)
Number of households with income $75k - 100k:
Kenmore:
11.8% (821)
Washington:
13.4% (299,192)
Number of households with income $100k - 125k:
Kenmore:
7.9% (547)
State:
11.3% (252,209)
Number of households with income $125k - 150k:
Kenmore:
6.6% (460)
State:
7.9% (175,962)
Number of households with income $150k - 200k:
Kenmore:
11.2% (776)
State:
10.7% (239,156)
Number of households with income > $200k:
Kenmore:
32.2% (2,240)
Washington:
16.1% (359,917)
Aggregate household income in Kenmore in 2022: $1,185,554,650
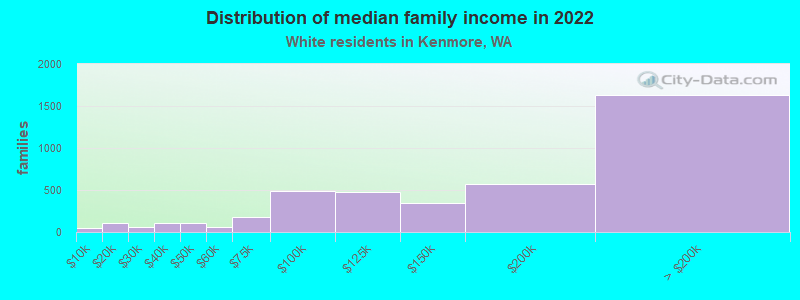
Median family income in Kenmore in 2022:
Kenmore:
$162,459
State:
$112,511
Number of families with income < $10k:
Kenmore:
1.0% (42)
State:
2.4% (33,676)
Number of families with income $10k - 20k:
Kenmore:
2.6% (107)
State:
2.0% (28,228)
Number of families with income $20k - 30k:
Kenmore:
1.4% (57)
State:
2.9% (39,288)
Number of families with income $30k - 40k:
Kenmore:
2.6% (110)
State:
3.6% (50,190)
Number of families with income $40k - 50k:
Kenmore:
2.6% (108)
State:
4.6% (63,009)
Number of families with income $50k - 60k:
Kenmore:
1.5% (64)
State:
5.0% (69,270)
Number of families with income $60k - 75k:
Kenmore:
4.4% (182)
State:
8.2% (112,369)
Number of families with income $75k - 100k:
Kenmore:
11.7% (486)
State:
14.1% (194,214)
Number of families with income $100k - 125k:
Kenmore:
11.5% (479)
State:
13.2% (182,184)
Number of families with income $125k - 150k:
Kenmore:
8.2% (342)
State:
9.5% (130,928)
Number of families with income $150k - 200k:
Kenmore:
13.6% (568)
Washington:
13.7% (188,621)
Number of families with income > $200k:
Kenmore:
39.0% (1,626)
State:
20.8% (285,982)
Median non-family income in Kenmore in 2022:
Kenmore:
$69,886
State:
$56,103
Change in median non-family income between 2000 and 2022:
Kenmore, Washington:
+75.2%
State:
+87.7%
Median per capita income in Kenmore in 2022:
Kenmore:
$75,689
State:
$55,212
Change in median per capita income between 2000 and 2022:
Kenmore, Washington:
+129.3%
Washington:
+123.8%
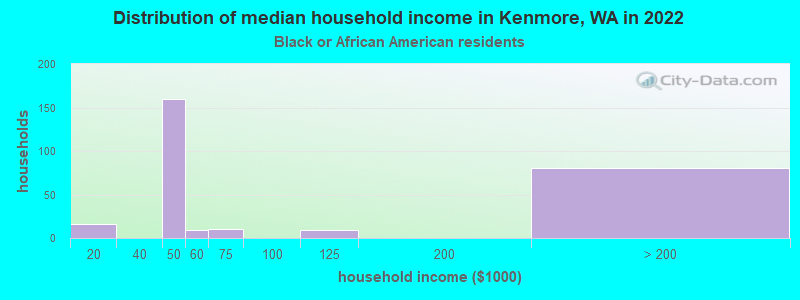
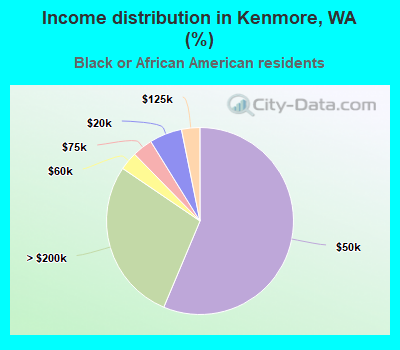
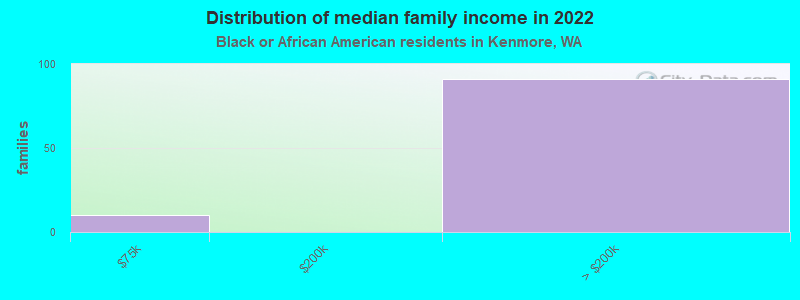
Income statistics for Black or African American residents
Number of households with income < $10k:
Kenmore:
0.0% (0)
State:
7.2% (8,014)
Number of households with income $10k - 20k:
Kenmore:
5.6% (16)
State:
8.0% (8,904)
Number of households with income $20k - 30k:
Kenmore:
0.0% (0)
State:
7.4% (8,207)
Number of households with income $30k - 40k:
Kenmore:
0.0% (0)
State:
5.6% (6,220)
Number of households with income $40k - 50k:
Kenmore:
56.3% (160)
Washington:
9.5% (10,585)
Number of households with income $50k - 60k:
Kenmore:
3.2% (9)
State:
7.3% (8,078)
Number of households with income $60k - 75k:
Kenmore:
3.5% (10)
State:
8.7% (9,704)
Number of households with income $75k - 100k:
Kenmore:
0.0% (0)
State:
12.9% (14,315)
Number of households with income $100k - 125k:
Kenmore:
3.2% (9)
State:
7.7% (8,592)
Number of households with income $125k - 150k:
Kenmore:
0.0% (0)
Washington:
8.9% (9,840)
Number of households with income $150k - 200k:
Kenmore:
0.0% (0)
Washington:
7.6% (8,434)
Number of households with income > $200k:
Kenmore:
28.2% (80)
State:
9.1% (10,075)
Aggregate household income in Kenmore in 2022: $39,354,360
Median family income in Kenmore in 2022:
Kenmore:
$268,313
Washington:
$82,165
Number of families with income $60k - 75k:
Kenmore:
10.2% (10)
Washington:
9.3% (6,231)
Number of families with income > $200k:
Kenmore:
89.8% (91)
State:
12.0% (8,041)
Median non-family income in Kenmore in 2022:
Kenmore:
$45,178
Washington:
$49,169
Change in median non-family income between 2000 and 2022:
Kenmore, Washington:
+11.6%
Washington:
+87.7%
Median per capita income in Kenmore in 2022:
Kenmore:
$74,075
State:
$38,209
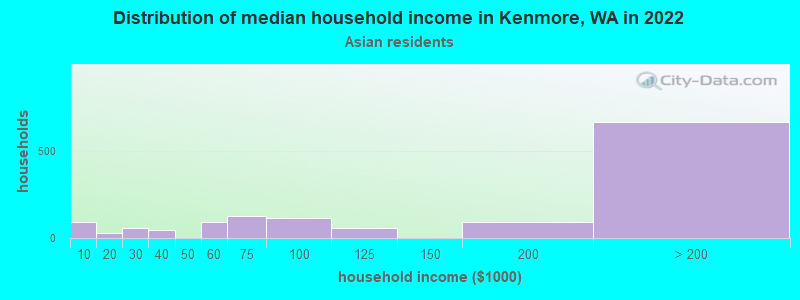
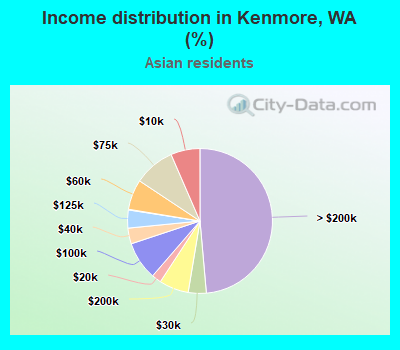
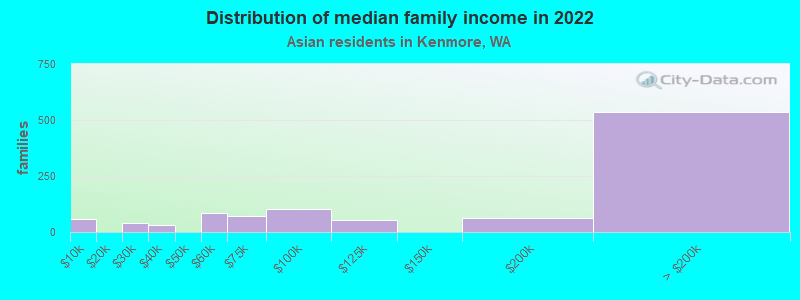
Income statistics for Asian residents
Median household income in Kenmore, WA in 2022:
Kenmore:
$183,822
State:
$125,692
Number of households with income < $10k:
Kenmore:
6.5% (89)
State:
4.9% (14,099)
Number of households with income $10k - 20k:
Kenmore:
2.1% (29)
Washington:
3.5% (9,873)
Number of households with income $20k - 30k:
Kenmore:
4.0% (55)
Washington:
2.9% (8,352)
Number of households with income $30k - 40k:
Kenmore:
3.5% (48)
State:
4.0% (11,415)
Number of households with income $40k - 50k:
Kenmore:
0.0% (0)
State:
4.0% (11,421)
Number of households with income $50k - 60k:
Kenmore:
6.7% (92)
State:
4.2% (12,100)
Number of households with income $60k - 75k:
Kenmore:
9.2% (125)
Washington:
6.3% (17,903)
Number of households with income $75k - 100k:
Kenmore:
8.6% (117)
State:
10.4% (29,663)
Number of households with income $100k - 125k:
Kenmore:
4.0% (55)
Washington:
9.4% (26,839)
Number of households with income $125k - 150k:
Kenmore:
0.1% (2)
State:
8.5% (24,200)
Number of households with income $150k - 200k:
Kenmore:
6.6% (90)
State:
12.6% (35,976)
Number of households with income > $200k:
Kenmore:
48.6% (664)
State:
29.2% (83,109)
Aggregate household income in Kenmore in 2022: $238,239,944
Median family income in Kenmore in 2022:
Kenmore:
$212,328
State:
$143,595
Number of families with income < $10k:
Kenmore:
5.5% (57)
State:
2.9% (5,479)
Number of families with income $20k - 30k:
Kenmore:
3.9% (40)
Washington:
1.9% (3,558)
Number of families with income $30k - 40k:
Kenmore:
3.1% (33)
State:
3.1% (5,734)
Number of families with income $50k - 60k:
Kenmore:
8.2% (86)
State:
4.1% (7,663)
Number of families with income $60k - 75k:
Kenmore:
7.0% (73)
State:
5.1% (9,490)
Number of families with income $75k - 100k:
Kenmore:
9.7% (102)
Washington:
11.7% (21,919)
Number of families with income $100k - 125k:
Kenmore:
5.3% (55)
Washington:
9.3% (17,280)
Number of families with income $125k - 150k:
Kenmore:
0.2% (2)
Washington:
8.4% (15,602)
Number of families with income $150k - 200k:
Kenmore:
6.1% (63)
State:
13.3% (24,789)
Number of families with income > $200k:
Kenmore:
51.1% (535)
Washington:
34.4% (64,250)
Median per capita income in Kenmore in 2022:
Kenmore:
$68,321
State:
$67,666
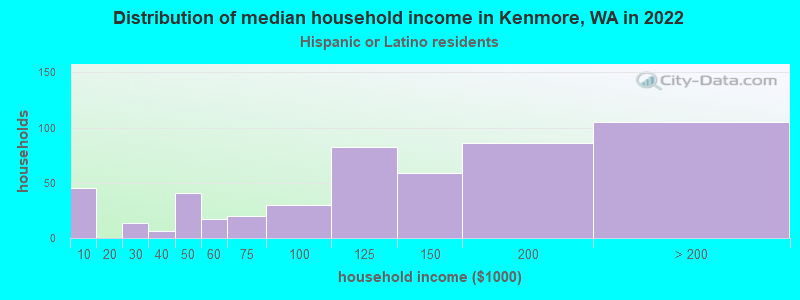
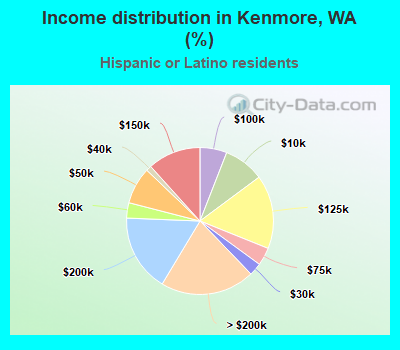
Income statistics for Hispanic or Latino residents
Median household income in Kenmore, WA in 2022:
Kenmore:
$108,311
State:
$74,770
Change in median household income between 2000 and 2022:
Kenmore, Washington:
+98.5%
State:
+128.3%
Number of households with income < $10k:
Kenmore:
8.9% (45)
State:
4.9% (14,456)
Number of households with income $10k - 20k:
Kenmore:
0.0% (0)
Washington:
5.3% (15,449)
Number of households with income $20k - 30k:
Kenmore:
2.8% (14)
Washington:
6.8% (20,016)
Number of households with income $30k - 40k:
Kenmore:
1.2% (6)
State:
7.7% (22,548)
Number of households with income $40k - 50k:
Kenmore:
8.1% (41)
State:
7.3% (21,450)
Number of households with income $50k - 60k:
Kenmore:
3.4% (17)
State:
7.7% (22,744)
Number of households with income $60k - 75k:
Kenmore:
4.0% (20)
Washington:
10.5% (30,737)
Number of households with income $75k - 100k:
Kenmore:
5.9% (30)
State:
14.9% (43,843)
Number of households with income $100k - 125k:
Kenmore:
16.2% (82)
State:
11.1% (32,554)
Number of households with income $125k - 150k:
Kenmore:
11.7% (59)
State:
7.4% (21,624)
Number of households with income $150k - 200k:
Kenmore:
17.0% (86)
Washington:
7.3% (21,360)
Number of households with income > $200k:
Kenmore:
20.8% (105)
Washington:
9.2% (27,055)
Aggregate household income in Kenmore in 2022: $77,766,543
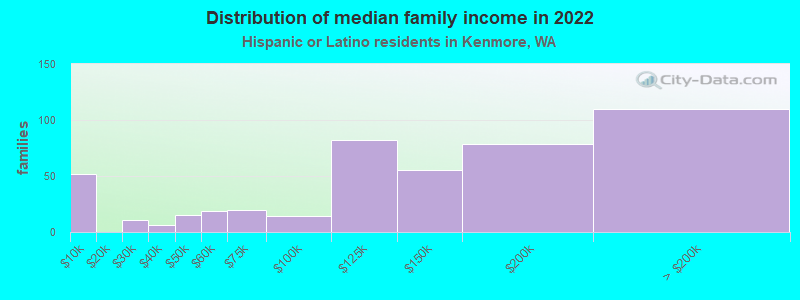
Median family income in Kenmore in 2022:
Kenmore:
$148,694
State:
$76,866
Number of families with income < $10k:
Kenmore:
11.3% (52)
State:
4.4% (9,443)
Number of families with income $20k - 30k:
Kenmore:
2.3% (11)
State:
5.6% (12,052)
Number of families with income $30k - 40k:
Kenmore:
1.3% (6)
State:
8.3% (17,803)
Number of families with income $40k - 50k:
Kenmore:
3.2% (15)
Washington:
7.7% (16,361)
Number of families with income $50k - 60k:
Kenmore:
4.1% (19)
Washington:
7.9% (16,852)
Number of families with income $60k - 75k:
Kenmore:
4.3% (20)
State:
11.4% (24,342)
Number of families with income $75k - 100k:
Kenmore:
3.0% (14)
Washington:
14.4% (30,698)
Number of families with income $100k - 125k:
Kenmore:
17.8% (82)
State:
11.4% (24,331)
Number of families with income $125k - 150k:
Kenmore:
11.8% (55)
Washington:
7.5% (16,099)
Number of families with income $150k - 200k:
Kenmore:
17.1% (79)
State:
8.2% (17,551)
Number of families with income > $200k:
Kenmore:
23.8% (110)
Washington:
9.7% (20,653)
Median per capita income in Kenmore in 2022:
Kenmore:
$53,613
Washington:
$28,252
Change in median per capita income between 2000 and 2022:
Kenmore, Washington:
+88.3%
Washington:
+150.2%
Income statistics for American Indian and Alaska Native residents
Median per capita income in Kenmore in 2022:
Kenmore:
$77,814
State:
$27,053
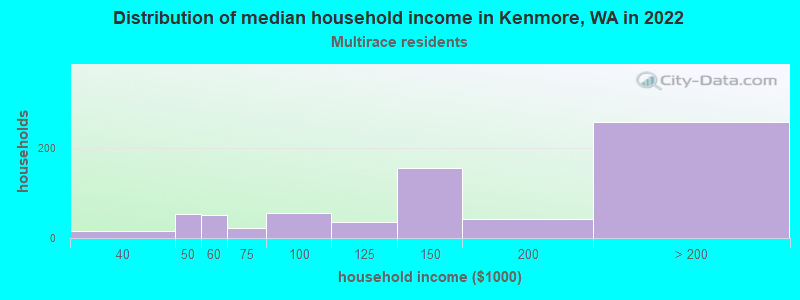
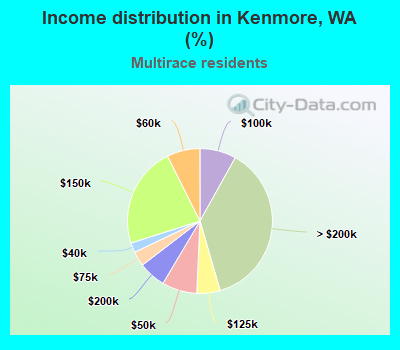
Income statistics for Multirace residents
Median household income in Kenmore, WA in 2022:
Kenmore:
$147,826
State:
$84,303
Number of households with income < $10k:
Kenmore:
0.0% (0)
State:
4.3% (12,040)
Number of households with income $10k - 20k:
Kenmore:
0.0% (0)
Washington:
6.6% (18,437)
Number of households with income $20k - 30k:
Kenmore:
0.0% (0)
State:
5.2% (14,559)
Number of households with income $30k - 40k:
Kenmore:
2.2% (15)
State:
6.7% (18,491)
Number of households with income $40k - 50k:
Kenmore:
7.8% (54)
Washington:
6.3% (17,459)
Number of households with income $50k - 60k:
Kenmore:
7.4% (51)
Washington:
6.9% (19,086)
Number of households with income $60k - 75k:
Kenmore:
3.3% (23)
State:
9.1% (25,310)
Number of households with income $75k - 100k:
Kenmore:
8.1% (56)
Washington:
13.5% (37,493)
Number of households with income $100k - 125k:
Kenmore:
5.2% (36)
State:
10.7% (29,626)
Number of households with income $125k - 150k:
Kenmore:
22.5% (156)
State:
8.6% (23,899)
Number of households with income $150k - 200k:
Kenmore:
6.1% (42)
Washington:
10.2% (28,214)
Number of households with income > $200k:
Kenmore:
37.4% (259)
State:
11.9% (32,947)
Aggregate household income in Kenmore in 2022: $132,481,051
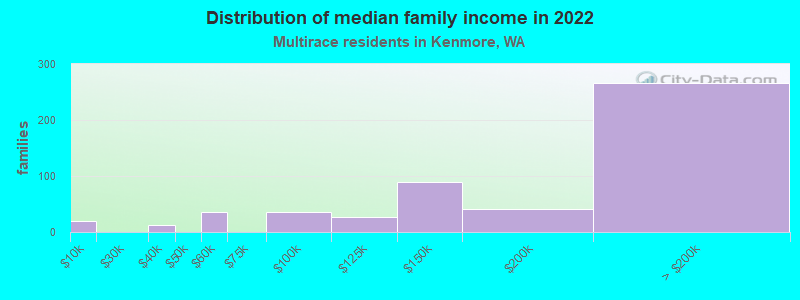
Median family income in Kenmore in 2022:
Kenmore:
$209,134
State:
$95,629
Number of families with income < $10k:
Kenmore:
3.8% (20)
State:
3.5% (6,121)
Number of families with income $30k - 40k:
Kenmore:
2.5% (13)
Washington:
5.8% (10,186)
Number of families with income $50k - 60k:
Kenmore:
6.8% (36)
Washington:
5.6% (9,922)
Number of families with income $75k - 100k:
Kenmore:
6.8% (36)
Washington:
13.6% (23,984)
Number of families with income $100k - 125k:
Kenmore:
4.9% (26)
Washington:
10.4% (18,288)
Number of families with income $125k - 150k:
Kenmore:
17.0% (89)
State:
10.5% (18,481)
Number of families with income $150k - 200k:
Kenmore:
7.7% (41)
State:
11.9% (20,852)
Number of families with income > $200k:
Kenmore:
50.6% (266)
Washington:
14.4% (25,289)
Median non-family income in Kenmore in 2022:
Kenmore:
$125,328
Washington:
$56,573
Median per capita income in Kenmore in 2022:
Kenmore:
$44,879
State:
$32,496
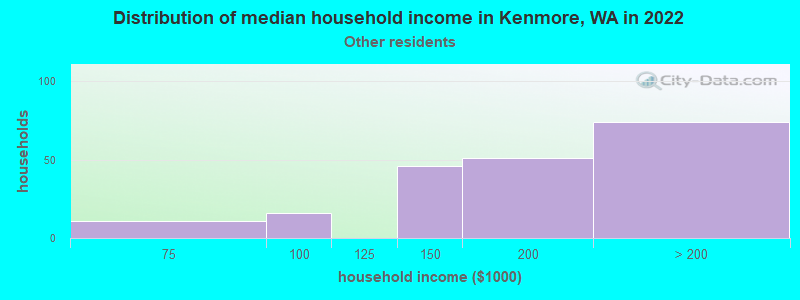
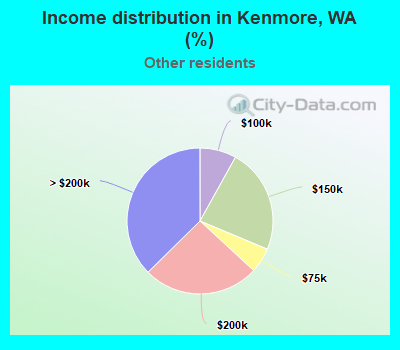
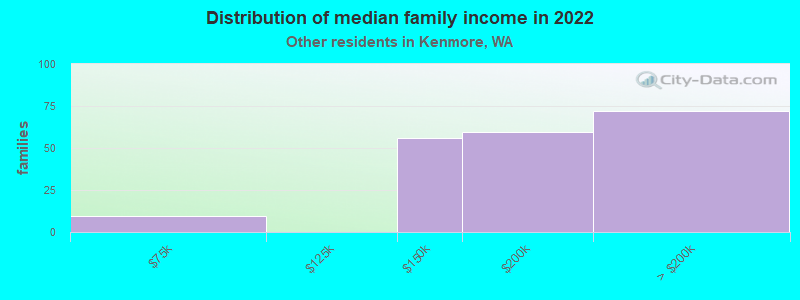
Income statistics for other residents
Median household income in Kenmore, WA in 2022:
Kenmore:
$170,997
State:
$69,545
Number of households with income < $10k:
Kenmore:
0.0% (0)
State:
5.3% (6,540)
Number of households with income $10k - 20k:
Kenmore:
0.0% (0)
State:
6.0% (7,385)
Number of households with income $20k - 30k:
Kenmore:
0.0% (0)
State:
7.5% (9,289)
Number of households with income $30k - 40k:
Kenmore:
0.0% (0)
Washington:
8.9% (11,015)
Number of households with income $40k - 50k:
Kenmore:
0.0% (0)
Washington:
7.6% (9,399)
Number of households with income $50k - 60k:
Kenmore:
0.0% (0)
Washington:
7.2% (8,867)
Number of households with income $60k - 75k:
Kenmore:
5.6% (11)
State:
10.5% (13,032)
Number of households with income $75k - 100k:
Kenmore:
8.1% (16)
State:
14.6% (18,007)
Number of households with income $100k - 125k:
Kenmore:
0.0% (0)
State:
12.2% (15,128)
Number of households with income $125k - 150k:
Kenmore:
23.2% (46)
State:
5.6% (6,950)
Number of households with income $150k - 200k:
Kenmore:
25.8% (51)
State:
7.1% (8,749)
Number of households with income > $200k:
Kenmore:
37.4% (74)
State:
7.5% (9,208)
Aggregate household income in Kenmore in 2022: $37,633,217
Median family income in Kenmore in 2022:
Kenmore:
$169,450
Washington:
$72,588
Number of families with income $60k - 75k:
Kenmore:
4.7% (9)
State:
10.3% (9,864)
Number of families with income $125k - 150k:
Kenmore:
28.4% (56)
Washington:
6.0% (5,679)
Number of families with income $150k - 200k:
Kenmore:
30.2% (59)
State:
8.2% (7,822)
Number of families with income > $200k:
Kenmore:
36.7% (72)
State:
7.1% (6,764)
Median per capita income in Kenmore in 2022:
Kenmore:
$73,527
Washington:
$27,542
Change in median per capita income between 2000 and 2022:
Kenmore, Washington:
+102.7%
Washington:
+167.8%
Discuss Kenmore, Washington (WA) on our hugely popular Washington forum.