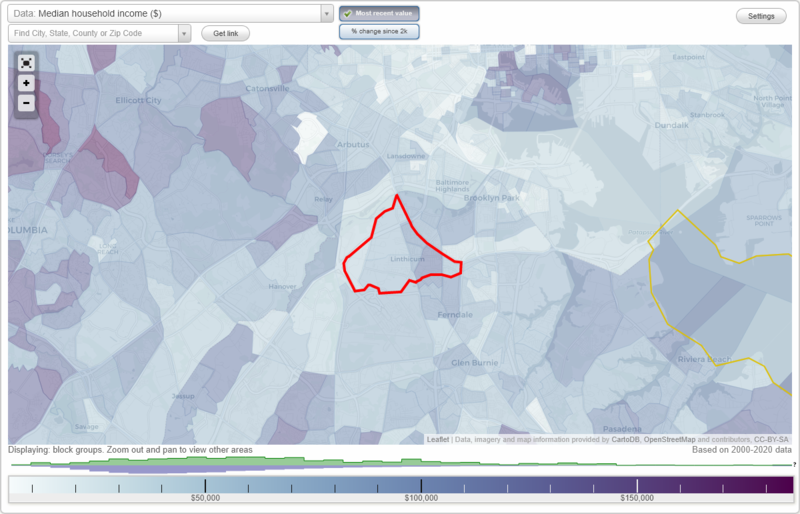
The median household income in Linthicum, MD in 2022 was $113,360, which was 16.2% greater than the median annual income of $94,991 across the entire state of Maryland. Compared to the median income of $61,479 in 2000 this represents an increase of 45.8%. The per capita income in 2022 was $49,519, which means an increase of 44.3% compared to 2000 when it was $27,559.
Whole page based on the data from 2000 / 2022 when the population of Linthicum, Maryland was 7,539 / 10,825
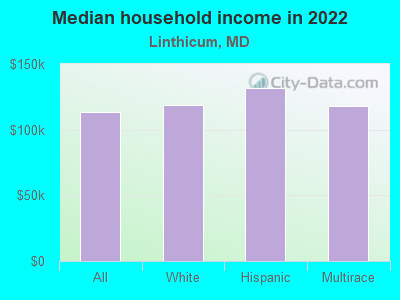
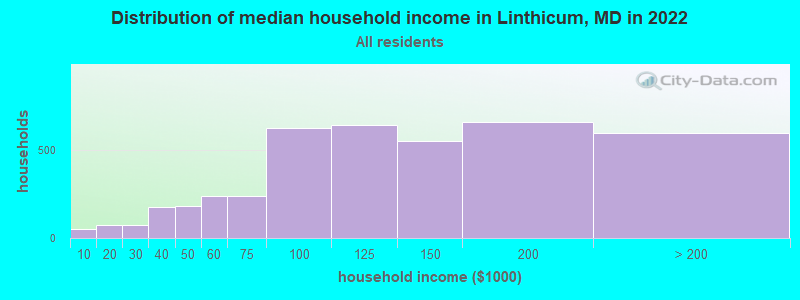
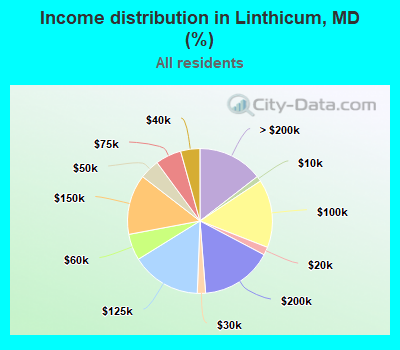
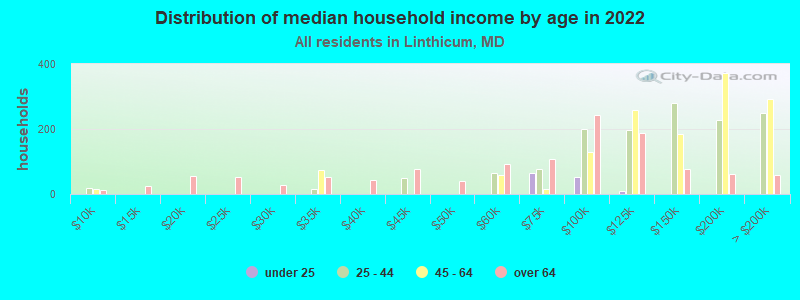
Income statistics for all residents
Median household income in Linthicum, MD in 2022:
Linthicum:
$113,360
Maryland:
$94,991
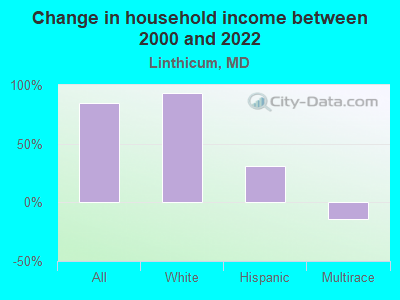
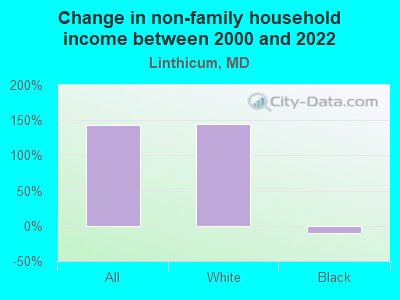
Change in median household income between 2000 and 2022:
Linthicum, Maryland:
+84.4%
State:
+79.7%
Number of households with income < $10k:
Linthicum:
1.2% (49)
State:
4.8% (114,450)
Number of households with income $10k - 20k:
Linthicum:
1.8% (74)
State:
5.0% (117,883)
Number of households with income $20k - 30k:
Linthicum:
1.9% (76)
State:
5.2% (123,350)
Number of households with income $30k - 40k:
Linthicum:
4.3% (177)
Maryland:
5.6% (134,104)
Number of households with income $40k - 50k:
Linthicum:
4.4% (182)
Maryland:
5.6% (132,932)
Number of households with income $50k - 60k:
Linthicum:
5.9% (241)
State:
5.6% (132,707)
Number of households with income $60k - 75k:
Linthicum:
5.8% (237)
Maryland:
7.9% (188,335)
Number of households with income $75k - 100k:
Linthicum:
15.2% (625)
State:
12.5% (297,873)
Number of households with income $100k - 125k:
Linthicum:
15.6% (639)
Maryland:
10.5% (250,497)
Number of households with income $125k - 150k:
Linthicum:
13.4% (552)
State:
8.1% (193,208)
Number of households with income $150k - 200k:
Linthicum:
16.0% (658)
Maryland:
11.6% (274,905)
Number of households with income > $200k:
Linthicum:
14.5% (596)
Maryland:
17.5% (415,740)
Aggregate household income in Linthicum in 2022: $526,510,224
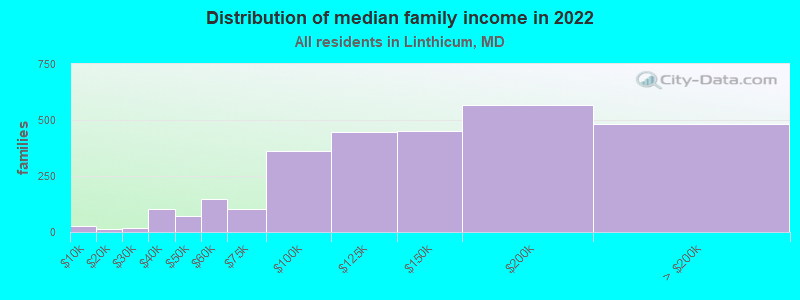
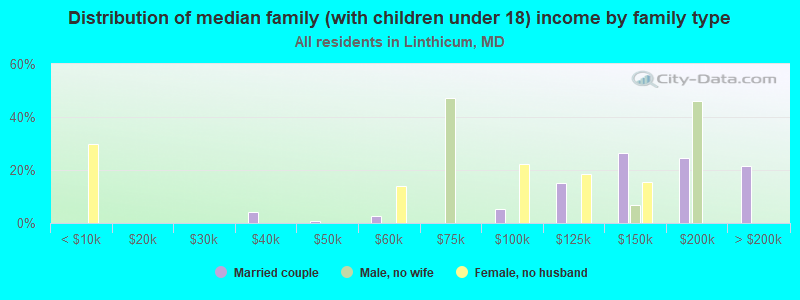
Median family income in Linthicum in 2022:
Linthicum:
$131,213
Maryland:
$117,294
Number of families with income < $10k:
Linthicum:
1.0% (28)
State:
2.7% (41,433)
Number of families with income $10k - 20k:
Linthicum:
0.5% (14)
State:
2.6% (40,126)
Number of families with income $20k - 30k:
Linthicum:
0.6% (17)
State:
3.4% (52,891)
Number of families with income $30k - 40k:
Linthicum:
3.7% (102)
Maryland:
4.5% (70,252)
Number of families with income $40k - 50k:
Linthicum:
2.5% (70)
State:
4.8% (74,112)
Number of families with income $50k - 60k:
Linthicum:
5.3% (146)
State:
5.0% (77,590)
Number of families with income $60k - 75k:
Linthicum:
3.6% (101)
Maryland:
7.1% (109,924)
Number of families with income $75k - 100k:
Linthicum:
13.0% (362)
Maryland:
12.0% (185,255)
Number of families with income $100k - 125k:
Linthicum:
16.1% (448)
State:
11.2% (173,203)
Number of families with income $125k - 150k:
Linthicum:
16.2% (451)
Maryland:
9.3% (143,453)
Number of families with income $150k - 200k:
Linthicum:
20.3% (568)
State:
14.2% (218,861)
Number of families with income > $200k:
Linthicum:
17.2% (481)
State:
23.2% (359,182)
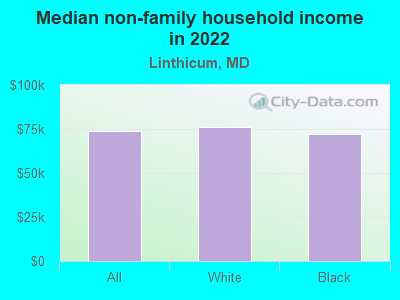
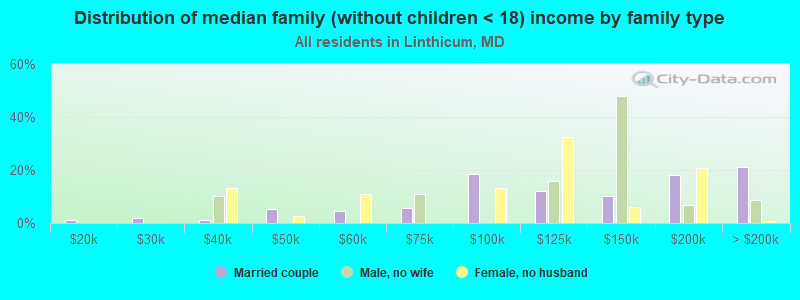
Median non-family income in Linthicum in 2022:
Linthicum:
$73,948
State:
$57,179
Change in median non-family income between 2000 and 2022:
Linthicum, Maryland:
+142.9%
Maryland:
+75.1%
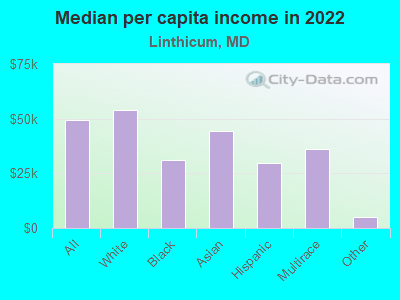
Median per capita income in Linthicum in 2022:
Linthicum:
$49,520
Maryland:
$49,236
Change in median per capita income between 2000 and 2022:
Linthicum, Maryland:
+79.7%
State:
+92.2%
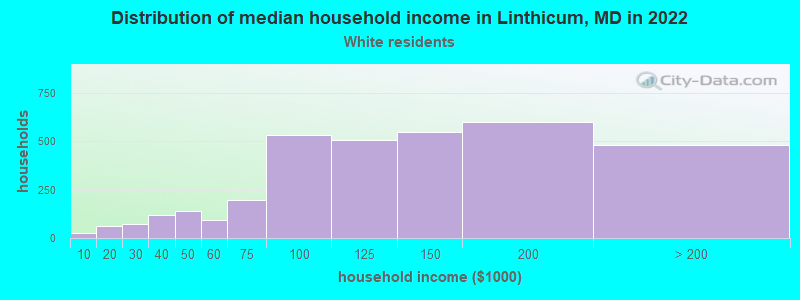
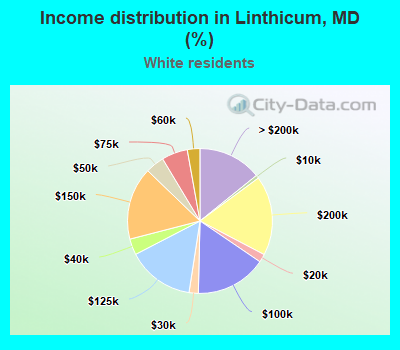
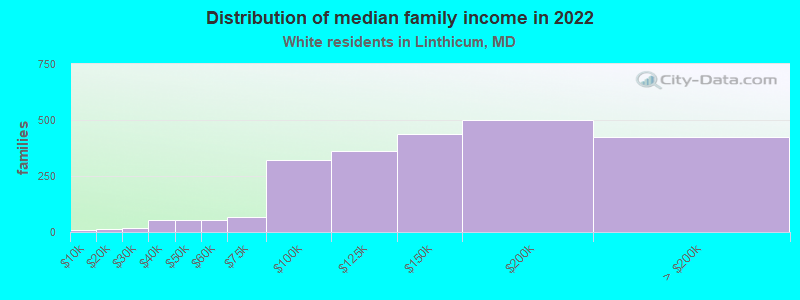
Income statistics for White residents
Median household income in Linthicum, MD in 2022:
Linthicum:
$118,797
State:
$107,160
Change in median household income between 2000 and 2022:
Linthicum, Maryland:
+93.4%
State:
+85.3%
Number of households with income < $10k:
Linthicum:
0.7% (24)
State:
3.7% (47,387)
Number of households with income $10k - 20k:
Linthicum:
1.8% (62)
State:
4.1% (52,102)
Number of households with income $20k - 30k:
Linthicum:
2.1% (70)
Maryland:
4.6% (58,758)
Number of households with income $30k - 40k:
Linthicum:
3.6% (121)
Maryland:
4.7% (59,745)
Number of households with income $40k - 50k:
Linthicum:
4.2% (142)
Maryland:
5.0% (62,576)
Number of households with income $50k - 60k:
Linthicum:
2.8% (95)
State:
5.1% (64,484)
Number of households with income $60k - 75k:
Linthicum:
5.8% (196)
State:
7.7% (97,019)
Number of households with income $75k - 100k:
Linthicum:
15.9% (536)
State:
11.8% (149,205)
Number of households with income $100k - 125k:
Linthicum:
15.0% (506)
State:
10.6% (134,231)
Number of households with income $125k - 150k:
Linthicum:
16.2% (548)
State:
8.8% (111,081)
Number of households with income $150k - 200k:
Linthicum:
17.8% (601)
State:
12.9% (162,966)
Number of households with income > $200k:
Linthicum:
14.2% (480)
Maryland:
20.9% (264,377)
Aggregate household income in Linthicum in 2022: $452,286,801
Median family income in Linthicum in 2022:
Linthicum:
$134,461
State:
$134,708
Number of families with income < $10k:
Linthicum:
0.3% (7)
Maryland:
1.6% (13,064)
Number of families with income $10k - 20k:
Linthicum:
0.6% (13)
State:
2.0% (16,048)
Number of families with income $20k - 30k:
Linthicum:
0.8% (17)
State:
2.2% (18,018)
Number of families with income $30k - 40k:
Linthicum:
2.3% (54)
Maryland:
3.3% (26,886)
Number of families with income $40k - 50k:
Linthicum:
2.3% (53)
Maryland:
3.6% (29,194)
Number of families with income $50k - 60k:
Linthicum:
2.4% (54)
State:
4.1% (33,120)
Number of families with income $60k - 75k:
Linthicum:
2.9% (67)
State:
6.6% (53,501)
Number of families with income $75k - 100k:
Linthicum:
14.0% (323)
Maryland:
11.3% (91,779)
Number of families with income $100k - 125k:
Linthicum:
15.6% (360)
State:
11.3% (91,483)
Number of families with income $125k - 150k:
Linthicum:
18.9% (438)
Maryland:
9.9% (80,832)
Number of families with income $150k - 200k:
Linthicum:
21.7% (502)
State:
16.0% (130,295)
Number of families with income > $200k:
Linthicum:
18.3% (422)
State:
28.1% (228,324)
Median non-family income in Linthicum in 2022:
Linthicum:
$76,089
State:
$61,991
Change in median non-family income between 2000 and 2022:
Linthicum, Maryland:
+145.4%
State:
+76.8%
Median per capita income in Linthicum in 2022:
Linthicum:
$53,766
Maryland:
$59,750
Change in median per capita income between 2000 and 2022:
Linthicum, Maryland:
+91.0%
Maryland:
+104.5%
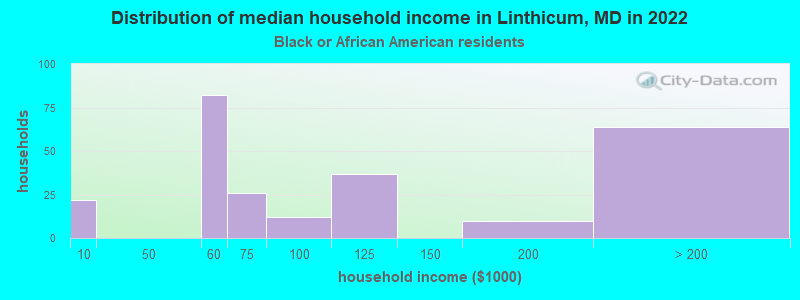
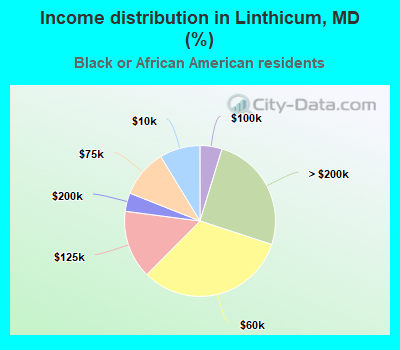
Income statistics for Black or African American residents
Number of households with income < $10k:
Linthicum:
8.7% (22)
State:
7.0% (50,093)
Number of households with income $10k - 20k:
Linthicum:
0.0% (0)
Maryland:
7.2% (51,849)
Number of households with income $20k - 30k:
Linthicum:
0.0% (0)
State:
5.8% (41,510)
Number of households with income $30k - 40k:
Linthicum:
0.0% (0)
State:
6.9% (49,466)
Number of households with income $40k - 50k:
Linthicum:
0.0% (0)
State:
6.6% (47,557)
Number of households with income $50k - 60k:
Linthicum:
32.4% (82)
Maryland:
6.2% (44,818)
Number of households with income $60k - 75k:
Linthicum:
10.3% (26)
State:
8.6% (61,728)
Number of households with income $75k - 100k:
Linthicum:
4.7% (12)
Maryland:
13.2% (95,107)
Number of households with income $100k - 125k:
Linthicum:
14.6% (37)
State:
10.2% (73,579)
Number of households with income $125k - 150k:
Linthicum:
0.0% (0)
Maryland:
7.2% (51,970)
Number of households with income $150k - 200k:
Linthicum:
4.0% (10)
Maryland:
9.4% (67,623)
Number of households with income > $200k:
Linthicum:
25.3% (64)
State:
11.7% (83,862)
Aggregate household income in Linthicum in 2022: $29,193,602
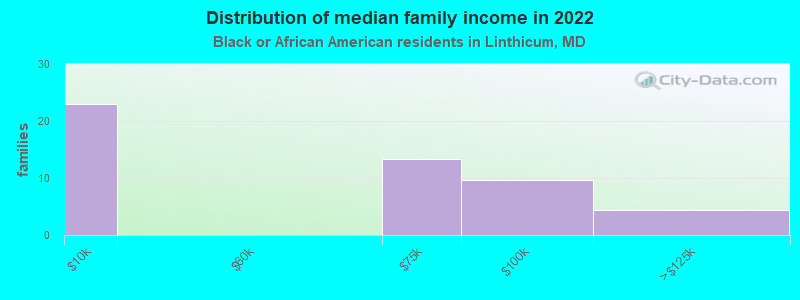
Median family income in Linthicum in 2022:
Linthicum:
$57,204
State:
$96,241
Number of families with income < $10k:
Linthicum:
45.5% (23)
State:
4.5% (19,574)
Number of families with income $60k - 75k:
Linthicum:
26.6% (13)
State:
8.0% (35,163)
Number of families with income $75k - 100k:
Linthicum:
19.1% (10)
State:
12.8% (55,976)
Number of families with income $100k - 125k:
Linthicum:
8.8% (4)
Maryland:
11.4% (49,778)
Median non-family income in Linthicum in 2022:
Linthicum:
$72,142
State:
$49,944
Change in median non-family income between 2000 and 2022:: -10.4%
Linthicum, Maryland:
-10.4%
Maryland:
+71.8%
Median per capita income in Linthicum in 2022:
Linthicum:
$30,920
Maryland:
$40,756
Change in median per capita income between 2000 and 2022:
Linthicum, Maryland:
+30.0%
State:
+113.5%
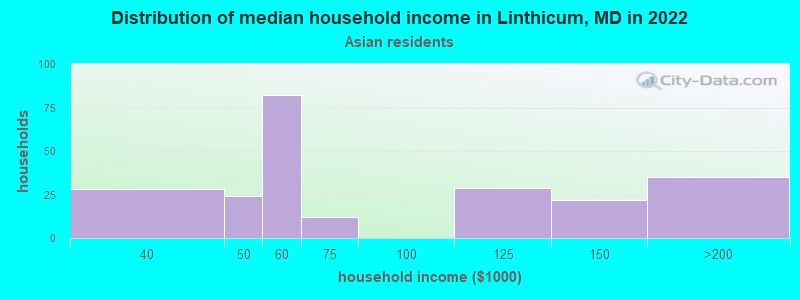
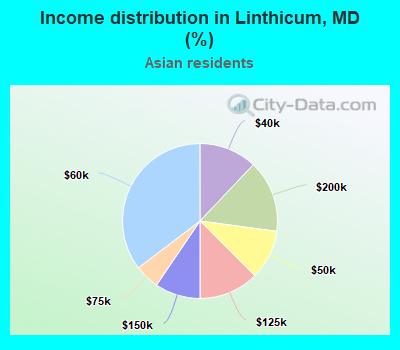
Income statistics for Asian residents
Number of households with income < $10k:
Linthicum:
0.0% (0)
State:
4.6% (6,395)
Number of households with income $10k - 20k:
Linthicum:
0.0% (0)
Maryland:
3.6% (4,994)
Number of households with income $20k - 30k:
Linthicum:
0.0% (0)
State:
4.6% (6,399)
Number of households with income $30k - 40k:
Linthicum:
12.1% (28)
Maryland:
3.4% (4,682)
Number of households with income $40k - 50k:
Linthicum:
10.3% (24)
State:
4.6% (6,382)
Number of households with income $50k - 60k:
Linthicum:
35.3% (82)
Maryland:
4.6% (6,402)
Number of households with income $60k - 75k:
Linthicum:
5.2% (12)
State:
5.4% (7,426)
Number of households with income $75k - 100k:
Linthicum:
0.0% (0)
Maryland:
11.1% (15,313)
Number of households with income $100k - 125k:
Linthicum:
12.5% (29)
Maryland:
10.6% (14,640)
Number of households with income $125k - 150k:
Linthicum:
9.5% (22)
State:
8.3% (11,465)
Number of households with income $150k - 200k:
Linthicum:
15.1% (35)
State:
13.4% (18,490)
Number of households with income > $200k:
Linthicum:
0.0% (0)
State:
25.6% (35,377)
Aggregate household income in Linthicum in 2022: $13,098,873
Median per capita income in Linthicum in 2022:
Linthicum:
$44,430
State:
$53,546
Change in median per capita income between 2000 and 2022:
Linthicum, Maryland:
+133.1%
Maryland:
+122.9%
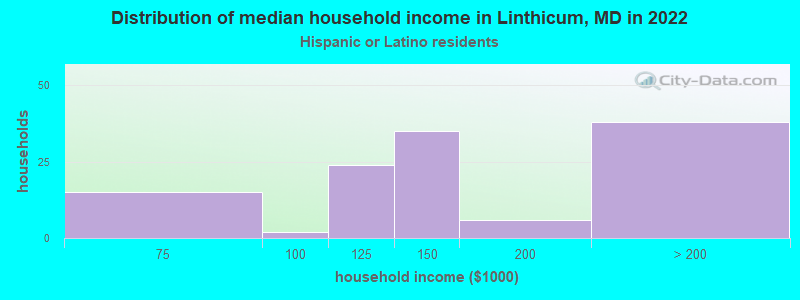
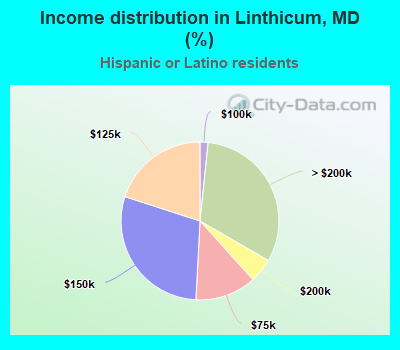
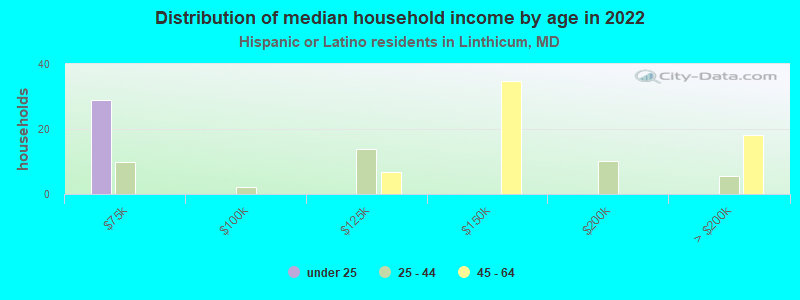
Income statistics for Hispanic or Latino residents
Median household income in Linthicum, MD in 2022:
Linthicum:
$131,644
State:
$82,138
Change in median household income between 2000 and 2022:
Linthicum, Maryland:
+30.6%
State:
+70.2%
Number of households with income < $10k:
Linthicum:
0.0% (0)
Maryland:
3.7% (6,871)
Number of households with income $10k - 20k:
Linthicum:
0.0% (0)
State:
2.9% (5,465)
Number of households with income $20k - 30k:
Linthicum:
0.0% (0)
Maryland:
5.9% (11,012)
Number of households with income $30k - 40k:
Linthicum:
0.0% (0)
Maryland:
7.9% (14,668)
Number of households with income $40k - 50k:
Linthicum:
0.0% (0)
State:
7.6% (14,074)
Number of households with income $50k - 60k:
Linthicum:
0.0% (0)
State:
7.6% (14,166)
Number of households with income $60k - 75k:
Linthicum:
12.5% (15)
State:
9.9% (18,486)
Number of households with income $75k - 100k:
Linthicum:
1.7% (2)
State:
16.1% (30,032)
Number of households with income $100k - 125k:
Linthicum:
20.0% (24)
State:
9.4% (17,432)
Number of households with income $125k - 150k:
Linthicum:
29.2% (35)
State:
7.5% (13,963)
Number of households with income $150k - 200k:
Linthicum:
5.0% (6)
State:
10.1% (18,750)
Number of households with income > $200k:
Linthicum:
31.7% (38)
Maryland:
11.4% (21,133)
Aggregate household income in Linthicum in 2022: $16,130,626
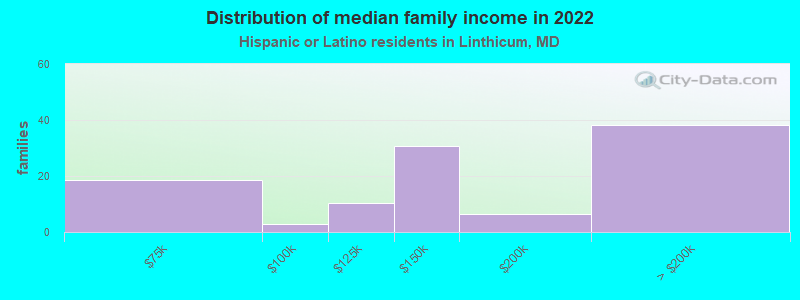
Median family income in Linthicum in 2022:
Linthicum:
$138,165
Maryland:
$80,127
Number of families with income $60k - 75k:
Linthicum:
17.4% (19)
State:
10.2% (15,051)
Number of families with income $75k - 100k:
Linthicum:
2.5% (3)
State:
14.6% (21,440)
Number of families with income $100k - 125k:
Linthicum:
9.8% (10)
State:
9.6% (14,146)
Number of families with income $125k - 150k:
Linthicum:
28.8% (31)
State:
6.9% (10,202)
Number of families with income $150k - 200k:
Linthicum:
5.9% (6)
Maryland:
10.7% (15,752)
Number of families with income > $200k:
Linthicum:
35.6% (38)
State:
11.6% (17,028)
Median per capita income in Linthicum in 2022:
Linthicum:
$29,929
Maryland:
$29,024
Change in median per capita income between 2000 and 2022:
Linthicum, Maryland:
+58.1%
Maryland:
+79.2%
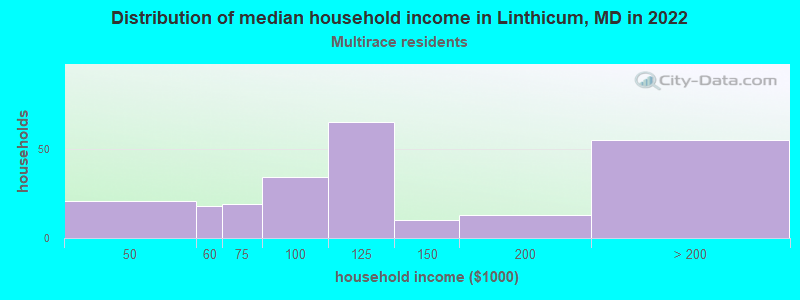
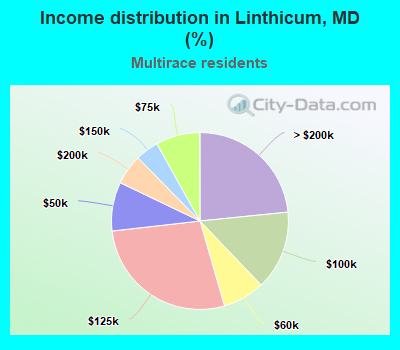
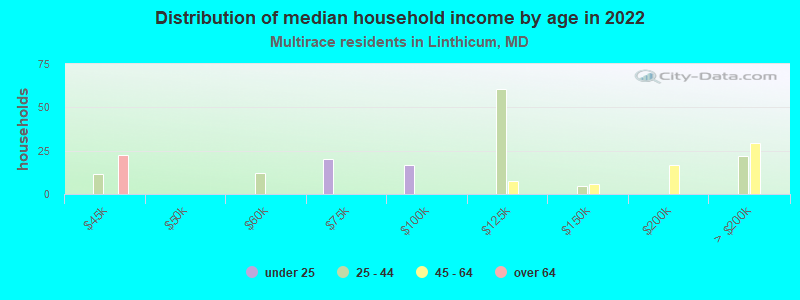
Income statistics for Multirace residents
Median household income in Linthicum, MD in 2022:
Linthicum:
$118,344
State:
$99,027
Change in median household income between 2000 and 2022:: -13.9%
Linthicum, Maryland:
-13.9%
Maryland:
+111.4%
Number of households with income < $10k:
Linthicum:
0.0% (0)
Maryland:
4.8% (6,469)
Number of households with income $10k - 20k:
Linthicum:
0.0% (0)
Maryland:
3.3% (4,464)
Number of households with income $20k - 30k:
Linthicum:
0.0% (0)
State:
5.8% (7,826)
Number of households with income $30k - 40k:
Linthicum:
0.0% (0)
State:
8.1% (11,077)
Number of households with income $40k - 50k:
Linthicum:
8.9% (21)
State:
4.3% (5,895)
Number of households with income $50k - 60k:
Linthicum:
7.7% (18)
Maryland:
3.9% (5,346)
Number of households with income $60k - 75k:
Linthicum:
8.1% (19)
State:
6.7% (9,159)
Number of households with income $75k - 100k:
Linthicum:
14.5% (34)
Maryland:
13.6% (18,420)
Number of households with income $100k - 125k:
Linthicum:
27.7% (65)
State:
12.9% (17,488)
Number of households with income $125k - 150k:
Linthicum:
4.3% (10)
State:
8.1% (11,039)
Number of households with income $150k - 200k:
Linthicum:
5.5% (13)
State:
11.5% (15,675)
Number of households with income > $200k:
Linthicum:
23.4% (55)
State:
17.0% (23,059)
Aggregate household income in Linthicum in 2022: $26,454,868
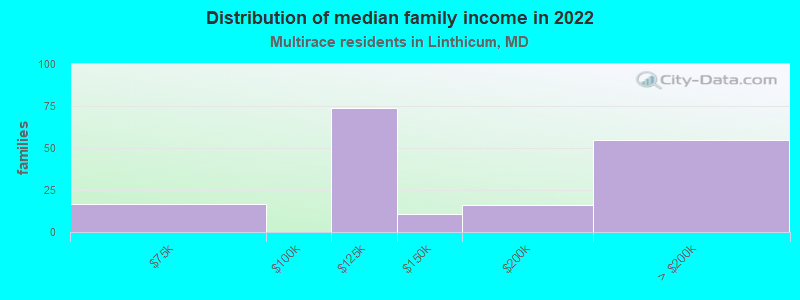
Median family income in Linthicum in 2022:
Linthicum:
$132,260
Maryland:
$110,784
Number of families with income $60k - 75k:
Linthicum:
9.6% (16)
State:
6.5% (6,128)
Number of families with income $100k - 125k:
Linthicum:
43.0% (74)
State:
13.2% (12,548)
Number of families with income $125k - 150k:
Linthicum:
6.2% (11)
State:
9.0% (8,509)
Number of families with income $150k - 200k:
Linthicum:
9.3% (16)
State:
13.6% (12,921)
Number of families with income > $200k:
Linthicum:
31.9% (55)
State:
20.9% (19,875)
Median per capita income in Linthicum in 2022:
Linthicum:
$35,997
State:
$35,630
Income statistics for other residents
Median per capita income in Linthicum in 2022:
Linthicum:
$5,093
State:
$24,415
Discuss Linthicum, Maryland (MD) on our hugely popular Maryland forum.