The median household income in Lynnwood, WA in 2022 was $70,470, which was 29.6% less than the median annual income of $91,306 across the entire state of Washington. Compared to the median income of $42,814 in 2000 this represents an increase of 39.2%. The per capita income in 2022 was $39,386, which means an increase of 49.3% compared to 2000 when it was $19,971.
Whole page based on the data from 2000 / 2022 when the population of Lynnwood, Washington was 33,847 / 40,432
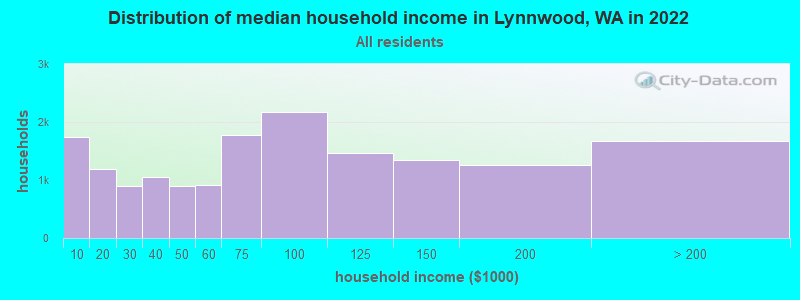
Income statistics for all residents
Median household income in Lynnwood, WA in 2022:
Lynnwood:
$70,470
State:
$91,306
Change in median household income between 2000 and 2022:
Lynnwood, Washington:
+64.6%
State:
+99.5%
Number of households with income < $10k:
Lynnwood:
10.7% (1,747)
State:
4.5% (139,331)
Number of households with income $10k - 20k:
Lynnwood:
7.2% (1,185)
State:
5.0% (154,508)
Number of households with income $20k - 30k:
Lynnwood:
5.5% (896)
State:
5.4% (166,555)
Number of households with income $30k - 40k:
Lynnwood:
6.4% (1,055)
State:
5.5% (170,324)
Number of households with income $40k - 50k:
Lynnwood:
5.5% (905)
State:
6.0% (183,941)
Number of households with income $50k - 60k:
Lynnwood:
5.6% (912)
State:
6.1% (187,395)
Number of households with income $60k - 75k:
Lynnwood:
10.9% (1,783)
State:
8.7% (266,771)
Number of households with income $75k - 100k:
Lynnwood:
13.2% (2,171)
Washington:
13.1% (404,672)
Number of households with income $100k - 125k:
Lynnwood:
9.0% (1,469)
Washington:
11.0% (337,911)
Number of households with income $125k - 150k:
Lynnwood:
8.2% (1,340)
State:
8.0% (244,934)
Number of households with income $150k - 200k:
Lynnwood:
7.6% (1,252)
State:
10.5% (323,812)
Number of households with income > $200k:
Lynnwood:
10.2% (1,676)
State:
16.2% (499,799)
Aggregate household income in Lynnwood in 2022: $1,533,134,928
Median family income in Lynnwood in 2022:
Lynnwood:
$93,842
Washington:
$109,192
Number of families with income < $10k:
Lynnwood:
8.5% (793)
State:
2.9% (55,953)
Number of families with income $10k - 20k:
Lynnwood:
4.1% (388)
State:
2.6% (50,138)
Number of families with income $20k - 30k:
Lynnwood:
2.8% (258)
State:
3.2% (61,974)
Number of families with income $30k - 40k:
Lynnwood:
2.8% (264)
State:
4.1% (80,240)
Number of families with income $40k - 50k:
Lynnwood:
3.8% (360)
State:
4.9% (94,310)
Number of families with income $50k - 60k:
Lynnwood:
6.2% (580)
State:
5.3% (101,674)
Number of families with income $60k - 75k:
Lynnwood:
12.0% (1,127)
State:
8.2% (158,348)
Number of families with income $75k - 100k:
Lynnwood:
15.5% (1,450)
State:
13.8% (267,812)
Number of families with income $100k - 125k:
Lynnwood:
11.1% (1,039)
State:
12.4% (240,213)
Number of families with income $125k - 150k:
Lynnwood:
8.6% (802)
State:
9.3% (180,011)
Number of families with income $150k - 200k:
Lynnwood:
10.0% (938)
State:
13.0% (250,874)
Number of families with income > $200k:
Lynnwood:
14.7% (1,375)
Washington:
20.4% (393,898)
Median non-family income in Lynnwood in 2022:
Lynnwood:
$42,924
State:
$57,299
Change in median non-family income between 2000 and 2022:
Lynnwood, Washington:
+45.2%
State:
+94.9%
Median per capita income in Lynnwood in 2022:
Lynnwood:
$39,386
State:
$50,764
Change in median per capita income between 2000 and 2022:
Lynnwood, Washington:
+97.2%
State:
+121.0%
Income statistics for White residents
Median household income in Lynnwood, WA in 2022:
Lynnwood:
$77,314
Washington:
$91,916
Change in median household income between 2000 and 2022:
Lynnwood, Washington:
+83.4%
Washington:
+95.4%
Number of households with income < $10k:
Lynnwood:
10.2% (1,003)
State:
4.3% (95,850)
Number of households with income $10k - 20k:
Lynnwood:
6.6% (646)
Washington:
4.8% (106,421)
Number of households with income $20k - 30k:
Lynnwood:
5.8% (573)
Washington:
5.5% (122,860)
Number of households with income $30k - 40k:
Lynnwood:
5.6% (550)
State:
5.4% (119,627)
Number of households with income $40k - 50k:
Lynnwood:
5.6% (556)
Washington:
5.9% (132,276)
Number of households with income $50k - 60k:
Lynnwood:
6.2% (615)
Washington:
6.1% (136,212)
Number of households with income $60k - 75k:
Lynnwood:
9.0% (890)
State:
8.8% (196,086)
Number of households with income $75k - 100k:
Lynnwood:
13.2% (1,301)
State:
13.4% (299,192)
Number of households with income $100k - 125k:
Lynnwood:
10.2% (1,002)
State:
11.3% (252,209)
Number of households with income $125k - 150k:
Lynnwood:
7.7% (755)
Washington:
7.9% (175,962)
Number of households with income $150k - 200k:
Lynnwood:
8.6% (843)
Washington:
10.7% (239,156)
Number of households with income > $200k:
Lynnwood:
11.4% (1,124)
State:
16.1% (359,917)
Aggregate household income in Lynnwood in 2022: $959,468,747
Median family income in Lynnwood in 2022:
Lynnwood:
$111,293
State:
$112,511
Number of families with income < $10k:
Lynnwood:
6.4% (320)
State:
2.4% (33,676)
Number of families with income $10k - 20k:
Lynnwood:
3.0% (151)
Washington:
2.0% (28,228)
Number of families with income $20k - 30k:
Lynnwood:
1.4% (72)
State:
2.9% (39,288)
Number of families with income $30k - 40k:
Lynnwood:
1.6% (79)
Washington:
3.6% (50,190)
Number of families with income $40k - 50k:
Lynnwood:
3.2% (159)
State:
4.6% (63,009)
Number of families with income $50k - 60k:
Lynnwood:
5.4% (273)
State:
5.0% (69,270)
Number of families with income $60k - 75k:
Lynnwood:
9.7% (490)
State:
8.2% (112,369)
Number of families with income $75k - 100k:
Lynnwood:
13.1% (657)
State:
14.1% (194,214)
Number of families with income $100k - 125k:
Lynnwood:
15.2% (766)
State:
13.2% (182,184)
Number of families with income $125k - 150k:
Lynnwood:
9.9% (500)
Washington:
9.5% (130,928)
Number of families with income $150k - 200k:
Lynnwood:
12.0% (602)
State:
13.7% (188,621)
Number of families with income > $200k:
Lynnwood:
19.1% (958)
State:
20.8% (285,982)
Median non-family income in Lynnwood in 2022:
Lynnwood:
$44,491
State:
$56,103
Change in median non-family income between 2000 and 2022:
Lynnwood, Washington:
+47.0%
Washington:
+87.7%
Median per capita income in Lynnwood in 2022:
Lynnwood:
$47,350
Washington:
$55,212
Change in median per capita income between 2000 and 2022:
Lynnwood, Washington:
+122.3%
Washington:
+123.8%
Income statistics for Black or African American residents
Median household income in Lynnwood, WA in 2022:
Lynnwood:
$78,875
State:
$68,202
Change in median household income between 2000 and 2022:
Lynnwood, Washington:
+67.9%
Washington:
+89.9%
Number of households with income < $10k:
Lynnwood:
4.8% (73)
State:
7.2% (8,014)
Number of households with income $10k - 20k:
Lynnwood:
8.7% (131)
State:
8.0% (8,904)
Number of households with income $20k - 30k:
Lynnwood:
9.2% (140)
State:
7.4% (8,207)
Number of households with income $30k - 40k:
Lynnwood:
7.3% (110)
State:
5.6% (6,220)
Number of households with income $40k - 50k:
Lynnwood:
7.7% (117)
Washington:
9.5% (10,585)
Number of households with income $50k - 60k:
Lynnwood:
3.7% (56)
Washington:
7.3% (8,078)
Number of households with income $60k - 75k:
Lynnwood:
16.6% (252)
State:
8.7% (9,704)
Number of households with income $75k - 100k:
Lynnwood:
13.9% (210)
State:
12.9% (14,315)
Number of households with income $100k - 125k:
Lynnwood:
3.1% (47)
State:
7.7% (8,592)
Number of households with income $125k - 150k:
Lynnwood:
18.7% (283)
Washington:
8.9% (9,840)
Number of households with income $150k - 200k:
Lynnwood:
4.9% (74)
State:
7.6% (8,434)
Number of households with income > $200k:
Lynnwood:
1.4% (21)
State:
9.1% (10,075)
Aggregate household income in Lynnwood in 2022: $105,753,596
Median family income in Lynnwood in 2022:
Lynnwood:
$57,845
State:
$82,165
Number of families with income < $10k:
Lynnwood:
7.8% (89)
Washington:
5.5% (3,709)
Number of families with income $10k - 20k:
Lynnwood:
5.5% (63)
Washington:
7.4% (4,951)
Number of families with income $20k - 30k:
Lynnwood:
5.9% (68)
State:
4.7% (3,151)
Number of families with income $30k - 40k:
Lynnwood:
9.0% (103)
State:
5.3% (3,525)
Number of families with income $40k - 50k:
Lynnwood:
6.7% (77)
State:
6.8% (4,558)
Number of families with income $50k - 60k:
Lynnwood:
22.0% (251)
State:
7.0% (4,687)
Number of families with income $60k - 75k:
Lynnwood:
4.3% (49)
Washington:
9.3% (6,231)
Number of families with income $75k - 100k:
Lynnwood:
18.9% (215)
Washington:
14.8% (9,876)
Number of families with income $100k - 125k:
Lynnwood:
6.3% (72)
State:
9.0% (6,018)
Number of families with income $125k - 150k:
Lynnwood:
7.9% (90)
Washington:
9.5% (6,348)
Number of families with income $150k - 200k:
Lynnwood:
5.0% (57)
State:
8.6% (5,737)
Number of families with income > $200k:
Lynnwood:
0.6% (7)
Washington:
12.0% (8,041)
Median non-family income in Lynnwood in 2022:
Lynnwood:
$40,306
State:
$49,169
Change in median non-family income between 2000 and 2022:: -31.2%
Lynnwood, Washington:
-31.2%
Washington:
+87.7%
Median per capita income in Lynnwood in 2022:
Lynnwood:
$36,278
Washington:
$38,209
Change in median per capita income between 2000 and 2022:
Lynnwood, Washington:
+100.8%
Washington:
+115.3%
Income statistics for Asian residents
Median household income in Lynnwood, WA in 2022:
Lynnwood:
$70,148
State:
$125,692
Change in median household income between 2000 and 2022:
Lynnwood, Washington:
+29.8%
State:
+164.5%
Number of households with income < $10k:
Lynnwood:
17.5% (482)
State:
4.9% (14,099)
Number of households with income $10k - 20k:
Lynnwood:
4.0% (110)
Washington:
3.5% (9,873)
Number of households with income $20k - 30k:
Lynnwood:
3.6% (98)
State:
2.9% (8,352)
Number of households with income $30k - 40k:
Lynnwood:
5.9% (164)
State:
4.0% (11,415)
Number of households with income $40k - 50k:
Lynnwood:
2.5% (68)
Washington:
4.0% (11,421)
Number of households with income $50k - 60k:
Lynnwood:
4.3% (118)
Washington:
4.2% (12,100)
Number of households with income $60k - 75k:
Lynnwood:
13.6% (375)
State:
6.3% (17,903)
Number of households with income $75k - 100k:
Lynnwood:
16.9% (467)
Washington:
10.4% (29,663)
Number of households with income $100k - 125k:
Lynnwood:
7.3% (200)
State:
9.4% (26,839)
Number of households with income $125k - 150k:
Lynnwood:
5.8% (159)
State:
8.5% (24,200)
Number of households with income $150k - 200k:
Lynnwood:
6.9% (189)
Washington:
12.6% (35,976)
Number of households with income > $200k:
Lynnwood:
11.9% (328)
State:
29.2% (83,109)
Aggregate household income in Lynnwood in 2022: $266,057,811
Median family income in Lynnwood in 2022:
Lynnwood:
$71,217
State:
$143,595
Number of families with income < $10k:
Lynnwood:
7.7% (151)
State:
2.9% (5,479)
Number of families with income $10k - 20k:
Lynnwood:
2.3% (45)
Washington:
2.2% (4,150)
Number of families with income $20k - 30k:
Lynnwood:
4.3% (85)
Washington:
1.9% (3,558)
Number of families with income $30k - 40k:
Lynnwood:
3.3% (65)
Washington:
3.1% (5,734)
Number of families with income $40k - 50k:
Lynnwood:
2.7% (54)
Washington:
3.6% (6,707)
Number of families with income $50k - 60k:
Lynnwood:
1.9% (38)
State:
4.1% (7,663)
Number of families with income $60k - 75k:
Lynnwood:
19.1% (377)
State:
5.1% (9,490)
Number of families with income $75k - 100k:
Lynnwood:
25.4% (500)
Washington:
11.7% (21,919)
Number of families with income $100k - 125k:
Lynnwood:
9.3% (182)
Washington:
9.3% (17,280)
Number of families with income $125k - 150k:
Lynnwood:
4.4% (86)
State:
8.4% (15,602)
Number of families with income $150k - 200k:
Lynnwood:
7.8% (154)
State:
13.3% (24,789)
Number of families with income > $200k:
Lynnwood:
11.8% (233)
State:
34.4% (64,250)
Median non-family income in Lynnwood in 2022:
Lynnwood:
$41,203
State:
$84,971
Change in median non-family income between 2000 and 2022:
Lynnwood, Washington:
+121.4%
State:
+211.1%
Median per capita income in Lynnwood in 2022:
Lynnwood:
$35,263
Washington:
$67,666
Change in median per capita income between 2000 and 2022:
Lynnwood, Washington:
+101.3%
Washington:
+236.0%
Income statistics for Hispanic or Latino residents
Median household income in Lynnwood, WA in 2022:
Lynnwood:
$55,635
Washington:
$74,770
Change in median household income between 2000 and 2022:
Lynnwood, Washington:
+38.4%
State:
+128.3%
Number of households with income < $10k:
Lynnwood:
15.1% (265)
State:
4.9% (14,456)
Number of households with income $10k - 20k:
Lynnwood:
7.7% (135)
State:
5.3% (15,449)
Number of households with income $20k - 30k:
Lynnwood:
8.4% (147)
State:
6.8% (20,016)
Number of households with income $30k - 40k:
Lynnwood:
9.1% (160)
State:
7.7% (22,548)
Number of households with income $40k - 50k:
Lynnwood:
7.6% (134)
State:
7.3% (21,450)
Number of households with income $50k - 60k:
Lynnwood:
2.3% (40)
Washington:
7.7% (22,744)
Number of households with income $60k - 75k:
Lynnwood:
14.1% (247)
State:
10.5% (30,737)
Number of households with income $75k - 100k:
Lynnwood:
11.2% (196)
Washington:
14.9% (43,843)
Number of households with income $100k - 125k:
Lynnwood:
5.2% (91)
State:
11.1% (32,554)
Number of households with income $125k - 150k:
Lynnwood:
8.8% (155)
State:
7.4% (21,624)
Number of households with income $150k - 200k:
Lynnwood:
4.3% (75)
Washington:
7.3% (21,360)
Number of households with income > $200k:
Lynnwood:
6.3% (110)
Washington:
9.2% (27,055)
Aggregate household income in Lynnwood in 2022: $120,563,928
Median family income in Lynnwood in 2022:
Lynnwood:
$57,570
State:
$76,866
Number of families with income < $10k:
Lynnwood:
12.4% (177)
State:
4.4% (9,443)
Number of families with income $10k - 20k:
Lynnwood:
10.9% (157)
Washington:
3.5% (7,524)
Number of families with income $20k - 30k:
Lynnwood:
12.3% (176)
State:
5.6% (12,052)
Number of families with income $30k - 40k:
Lynnwood:
1.9% (27)
Washington:
8.3% (17,803)
Number of families with income $40k - 50k:
Lynnwood:
6.6% (94)
State:
7.7% (16,361)
Number of families with income $50k - 60k:
Lynnwood:
1.1% (16)
State:
7.9% (16,852)
Number of families with income $60k - 75k:
Lynnwood:
22.2% (317)
State:
11.4% (24,342)
Number of families with income $75k - 100k:
Lynnwood:
12.2% (174)
State:
14.4% (30,698)
Number of families with income $100k - 125k:
Lynnwood:
6.1% (88)
Washington:
11.4% (24,331)
Number of families with income $125k - 150k:
Lynnwood:
3.5% (50)
Washington:
7.5% (16,099)
Number of families with income $150k - 200k:
Lynnwood:
4.6% (66)
State:
8.2% (17,551)
Number of families with income > $200k:
Lynnwood:
6.2% (89)
Washington:
9.7% (20,653)
Median non-family income in Lynnwood in 2022:
Lynnwood:
$34,699
State:
$54,173
Change in median non-family income between 2000 and 2022:
Lynnwood, Washington:
+38.8%
State:
+105.8%
Median per capita income in Lynnwood in 2022:
Lynnwood:
$21,321
State:
$28,252
Change in median per capita income between 2000 and 2022:
Lynnwood, Washington:
+62.3%
Washington:
+150.2%
Income statistics for American Indian and Alaska Native residents
Median household income in Lynnwood, WA in 2022:
Lynnwood:
$225,213
State:
$71,255
Number of households with income < $10k:
Lynnwood:
0.0% (0)
Washington:
5.9% (1,768)
Number of households with income $10k - 20k:
Lynnwood:
0.0% (0)
State:
8.9% (2,694)
Number of households with income $20k - 30k:
Lynnwood:
0.0% (0)
Washington:
8.0% (2,412)
Number of households with income $30k - 40k:
Lynnwood:
0.0% (0)
Washington:
7.7% (2,327)
Number of households with income $40k - 50k:
Lynnwood:
0.0% (0)
State:
5.8% (1,755)
Number of households with income $50k - 60k:
Lynnwood:
0.0% (0)
State:
7.5% (2,259)
Number of households with income $60k - 75k:
Lynnwood:
0.0% (0)
State:
8.8% (2,669)
Number of households with income $75k - 100k:
Lynnwood:
10.8% (7)
State:
12.8% (3,861)
Number of households with income $100k - 125k:
Lynnwood:
33.8% (22)
State:
12.0% (3,618)
Number of households with income $125k - 150k:
Lynnwood:
0.0% (0)
Washington:
8.6% (2,580)
Number of households with income $150k - 200k:
Lynnwood:
55.4% (36)
State:
5.9% (1,774)
Number of households with income > $200k:
Lynnwood:
0.0% (0)
Washington:
8.1% (2,447)
Aggregate household income in Lynnwood in 2022: $11,247,942
Median per capita income in Lynnwood in 2022:
Lynnwood:
$27,264
Washington:
$27,053
Change in median per capita income between 2000 and 2022:
Lynnwood, Washington:
+125.9%
State:
+98.6%
Income statistics for Multirace residents
Median household income in Lynnwood, WA in 2022:
Lynnwood:
$64,367
State:
$84,303
Change in median household income between 2000 and 2022:
Lynnwood, Washington:
+100.0%
Washington:
+125.7%
Number of households with income < $10k:
Lynnwood:
2.6% (48)
State:
4.3% (12,040)
Number of households with income $10k - 20k:
Lynnwood:
15.0% (279)
Washington:
6.6% (18,437)
Number of households with income $20k - 30k:
Lynnwood:
5.1% (94)
State:
5.2% (14,559)
Number of households with income $30k - 40k:
Lynnwood:
16.9% (313)
Washington:
6.7% (18,491)
Number of households with income $40k - 50k:
Lynnwood:
4.2% (78)
State:
6.3% (17,459)
Number of households with income $50k - 60k:
Lynnwood:
3.4% (63)
Washington:
6.9% (19,086)
Number of households with income $60k - 75k:
Lynnwood:
7.4% (138)
Washington:
9.1% (25,310)
Number of households with income $75k - 100k:
Lynnwood:
6.3% (117)
State:
13.5% (37,493)
Number of households with income $100k - 125k:
Lynnwood:
13.4% (249)
State:
10.7% (29,626)
Number of households with income $125k - 150k:
Lynnwood:
10.8% (201)
State:
8.6% (23,899)
Number of households with income $150k - 200k:
Lynnwood:
6.6% (123)
State:
10.2% (28,214)
Number of households with income > $200k:
Lynnwood:
8.2% (153)
Washington:
11.9% (32,947)
Aggregate household income in Lynnwood in 2022: $162,573,780
Median family income in Lynnwood in 2022:
Lynnwood:
$78,258
State:
$95,629
Number of families with income < $10k:
Lynnwood:
8.6% (82)
State:
3.5% (6,121)
Number of families with income $10k - 20k:
Lynnwood:
22.2% (212)
Washington:
4.3% (7,519)
Number of families with income $30k - 40k:
Lynnwood:
0.8% (7)
State:
5.8% (10,186)
Number of families with income $40k - 50k:
Lynnwood:
3.0% (28)
Washington:
5.9% (10,412)
Number of families with income $50k - 60k:
Lynnwood:
4.8% (46)
Washington:
5.6% (9,922)
Number of families with income $60k - 75k:
Lynnwood:
19.8% (189)
State:
9.7% (17,113)
Number of families with income $75k - 100k:
Lynnwood:
10.1% (96)
State:
13.6% (23,984)
Number of families with income $100k - 125k:
Lynnwood:
3.2% (30)
State:
10.4% (18,288)
Number of families with income $125k - 150k:
Lynnwood:
4.9% (47)
State:
10.5% (18,481)
Number of families with income $150k - 200k:
Lynnwood:
8.5% (81)
State:
11.9% (20,852)
Number of families with income > $200k:
Lynnwood:
14.2% (136)
State:
14.4% (25,289)
Median non-family income in Lynnwood in 2022:
Lynnwood:
$44,915
State:
$56,573
Change in median non-family income between 2000 and 2022:
Lynnwood, Washington:
+75.9%
Washington:
+115.0%
Median per capita income in Lynnwood in 2022:
Lynnwood:
$25,009
Washington:
$32,496
Change in median per capita income between 2000 and 2022:
Lynnwood, Washington:
+98.3%
State:
+156.8%
Income statistics for other residents
Median household income in Lynnwood, WA in 2022:
Lynnwood:
$58,715
State:
$69,545
Number of households with income < $10k:
Lynnwood:
7.1% (51)
State:
5.3% (6,540)
Number of households with income $10k - 20k:
Lynnwood:
0.0% (0)
State:
6.0% (7,385)
Number of households with income $20k - 30k:
Lynnwood:
20.1% (144)
Washington:
7.5% (9,289)
Number of households with income $30k - 40k:
Lynnwood:
2.2% (16)
State:
8.9% (11,015)
Number of households with income $40k - 50k:
Lynnwood:
5.2% (37)
Washington:
7.6% (9,399)
Number of households with income $50k - 60k:
Lynnwood:
9.1% (65)
Washington:
7.2% (8,867)
Number of households with income $60k - 75k:
Lynnwood:
24.4% (175)
State:
10.5% (13,032)
Number of households with income $75k - 100k:
Lynnwood:
13.5% (97)
Washington:
14.6% (18,007)
Number of households with income $100k - 125k:
Lynnwood:
0.0% (0)
Washington:
12.2% (15,128)
Number of households with income $125k - 150k:
Lynnwood:
12.3% (88)
Washington:
5.6% (6,950)
Number of households with income $150k - 200k:
Lynnwood:
0.0% (0)
State:
7.1% (8,749)
Number of households with income > $200k:
Lynnwood:
6.1% (44)
State:
7.5% (9,208)
Aggregate household income in Lynnwood in 2022: $45,030,987
Median family income in Lynnwood in 2022:
Lynnwood:
$49,515
State:
$72,588
Number of families with income < $10k:
Lynnwood:
4.6% (29)
Washington:
5.5% (5,287)
Number of families with income $10k - 20k:
Lynnwood:
7.3% (46)
State:
4.0% (3,814)
Number of families with income $20k - 30k:
Lynnwood:
17.7% (111)
Washington:
6.6% (6,293)
Number of families with income $30k - 40k:
Lynnwood:
3.9% (24)
State:
9.2% (8,827)
Number of families with income $40k - 50k:
Lynnwood:
15.3% (96)
State:
8.0% (7,634)
Number of families with income $50k - 60k:
Lynnwood:
4.2% (26)
State:
7.7% (7,357)
Number of families with income $60k - 75k:
Lynnwood:
20.2% (126)
State:
10.3% (9,864)
Number of families with income $75k - 100k:
Lynnwood:
14.8% (93)
Washington:
14.5% (13,800)
Number of families with income $125k - 150k:
Lynnwood:
8.7% (55)
State:
6.0% (5,679)
Number of families with income > $200k:
Lynnwood:
3.4% (21)
State:
7.1% (6,764)
Median per capita income in Lynnwood in 2022:
Lynnwood:
$25,586
State:
$27,542
Change in median per capita income between 2000 and 2022:
Lynnwood, Washington:
+103.6%
State:
+167.8%
Discuss Lynnwood, Washington (WA) on our hugely popular Washington forum.