The median household income in Roma, TX in 2022 was $25,371, which was 184.9% less than the median annual income of $72,284 across the entire state of Texas. Compared to the median income of $15,563 in 2000 this represents an increase of 38.7%. The per capita income in 2022 was $13,833, which means an increase of 45.5% compared to 2000 when it was $7,539.
Whole page based on the data from 2000 / 2022 when the population of Roma, Texas was 9,617 / 11,533
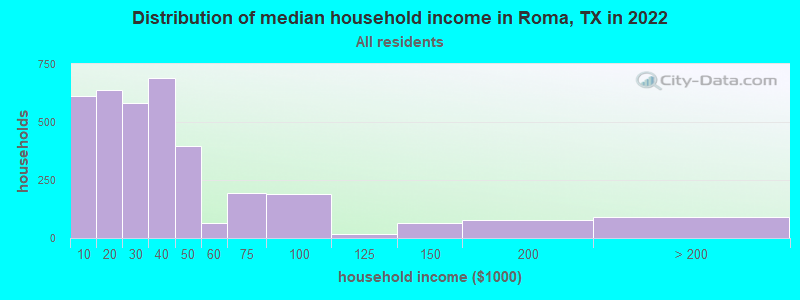
Income statistics for all residents
Median household income in Roma, TX in 2022:
Roma:
$25,372
State:
$72,284
Change in median household income between 2000 and 2022:
Roma, Texas:
+63.0%
State:
+81.0%
Number of households with income < $10k:
Roma:
16.9% (611)
State:
5.5% (611,011)
Number of households with income $10k - 20k:
Roma:
17.7% (639)
Texas:
6.7% (743,157)
Number of households with income $20k - 30k:
Roma:
16.1% (581)
State:
7.2% (803,381)
Number of households with income $30k - 40k:
Roma:
19.1% (690)
State:
7.8% (866,080)
Number of households with income $40k - 50k:
Roma:
11.0% (396)
Texas:
7.3% (810,440)
Number of households with income $50k - 60k:
Roma:
1.8% (65)
State:
7.2% (799,783)
Number of households with income $60k - 75k:
Roma:
5.3% (192)
State:
9.9% (1,095,384)
Number of households with income $75k - 100k:
Roma:
5.2% (188)
State:
12.8% (1,419,057)
Number of households with income $100k - 125k:
Roma:
0.5% (18)
State:
9.5% (1,054,577)
Number of households with income $125k - 150k:
Roma:
1.7% (63)
State:
6.7% (741,518)
Number of households with income $150k - 200k:
Roma:
2.1% (77)
State:
8.7% (961,776)
Number of households with income > $200k:
Roma:
2.5% (90)
State:
10.7% (1,181,544)
Aggregate household income in Roma in 2022: $137,716,247
Median family income in Roma in 2022:
Roma:
$34,418
Texas:
$86,267
Number of families with income < $10k:
Roma:
16.5% (424)
State:
4.0% (297,884)
Number of families with income $10k - 20k:
Roma:
7.4% (191)
State:
4.3% (324,514)
Number of families with income $20k - 30k:
Roma:
11.0% (283)
State:
5.8% (430,949)
Number of families with income $30k - 40k:
Roma:
24.1% (618)
Texas:
6.6% (493,535)
Number of families with income $40k - 50k:
Roma:
14.6% (373)
State:
6.7% (499,663)
Number of families with income $50k - 60k:
Roma:
3.2% (83)
Texas:
6.6% (492,203)
Number of families with income $60k - 75k:
Roma:
7.3% (188)
State:
9.5% (710,229)
Number of families with income $75k - 100k:
Roma:
6.3% (163)
State:
13.6% (1,015,480)
Number of families with income $100k - 125k:
Roma:
0.8% (20)
State:
10.7% (797,961)
Number of families with income $125k - 150k:
Roma:
2.6% (66)
State:
8.1% (602,985)
Number of families with income $150k - 200k:
Roma:
3.0% (76)
State:
10.7% (804,459)
Number of families with income > $200k:
Roma:
3.1% (81)
Texas:
13.5% (1,013,514)
Median non-family income in Roma in 2022:
Roma:
$12,907
State:
$45,999
Change in median non-family income between 2000 and 2022:
Roma, Texas:
+96.9%
Texas:
+79.5%
Median per capita income in Roma in 2022:
Roma:
$13,833
State:
$38,123
Change in median per capita income between 2000 and 2022:
Roma, Texas:
+83.5%
State:
+94.3%
Income statistics for White residents
Median household income in Roma, TX in 2022:
Roma:
$32,575
State:
$82,032
Change in median household income between 2000 and 2022:
Roma, Texas:
+115.3%
State:
+91.0%
Number of households with income < $10k:
Roma:
7.9% (113)
Texas:
4.7% (273,716)
Number of households with income $10k - 20k:
Roma:
15.4% (221)
State:
5.5% (322,702)
Number of households with income $20k - 30k:
Roma:
17.6% (253)
Texas:
6.2% (363,947)
Number of households with income $30k - 40k:
Roma:
21.0% (302)
State:
6.8% (399,275)
Number of households with income $40k - 50k:
Roma:
10.9% (157)
State:
6.5% (383,417)
Number of households with income $50k - 60k:
Roma:
5.2% (74)
State:
6.6% (388,535)
Number of households with income $60k - 75k:
Roma:
4.9% (70)
State:
9.7% (566,295)
Number of households with income $75k - 100k:
Roma:
8.9% (128)
Texas:
13.0% (760,276)
Number of households with income $100k - 125k:
Roma:
1.3% (18)
State:
10.2% (597,596)
Number of households with income $125k - 150k:
Roma:
2.5% (36)
State:
7.4% (436,830)
Number of households with income $150k - 200k:
Roma:
2.6% (37)
Texas:
9.9% (583,067)
Number of households with income > $200k:
Roma:
1.9% (27)
State:
13.5% (792,647)
Aggregate household income in Roma in 2022: $68,897,751
Median family income in Roma in 2022:
Roma:
$34,887
State:
$101,788
Number of families with income < $10k:
Roma:
2.9% (31)
State:
2.8% (108,142)
Number of families with income $10k - 20k:
Roma:
14.4% (154)
Texas:
2.9% (113,421)
Number of families with income $20k - 30k:
Roma:
15.6% (167)
State:
4.1% (157,688)
Number of families with income $30k - 40k:
Roma:
23.9% (254)
Texas:
5.2% (198,847)
Number of families with income $40k - 50k:
Roma:
10.7% (114)
State:
5.6% (216,490)
Number of families with income $50k - 60k:
Roma:
8.9% (95)
State:
5.7% (220,689)
Number of families with income $60k - 75k:
Roma:
6.2% (66)
State:
9.0% (346,106)
Number of families with income $75k - 100k:
Roma:
7.2% (77)
State:
13.7% (527,363)
Number of families with income $100k - 125k:
Roma:
1.6% (17)
State:
11.6% (448,411)
Number of families with income $125k - 150k:
Roma:
3.4% (36)
State:
9.2% (355,798)
Number of families with income $150k - 200k:
Roma:
3.4% (36)
State:
12.5% (480,185)
Number of families with income > $200k:
Roma:
1.8% (19)
Texas:
17.6% (677,490)
Median non-family income in Roma in 2022:
Roma:
$24,074
State:
$50,587
Median per capita income in Roma in 2022:
Roma:
$16,895
State:
$47,740
Change in median per capita income between 2000 and 2022:
Roma, Texas:
+137.0%
State:
+114.3%
Income statistics for Hispanic or Latino residents
Median household income in Roma, TX in 2022:
Roma:
$25,701
State:
$60,504
Change in median household income between 2000 and 2022:
Roma, Texas:
+66.2%
State:
+102.5%
Number of households with income < $10k:
Roma:
16.7% (611)
State:
5.8% (213,953)
Number of households with income $10k - 20k:
Roma:
18.1% (661)
Texas:
8.0% (297,456)
Number of households with income $20k - 30k:
Roma:
15.9% (581)
State:
9.2% (340,166)
Number of households with income $30k - 40k:
Roma:
18.9% (690)
Texas:
9.5% (354,336)
Number of households with income $40k - 50k:
Roma:
10.8% (395)
Texas:
8.8% (327,013)
Number of households with income $50k - 60k:
Roma:
1.8% (65)
Texas:
8.3% (308,818)
Number of households with income $60k - 75k:
Roma:
5.3% (192)
Texas:
10.9% (405,109)
Number of households with income $75k - 100k:
Roma:
5.3% (195)
State:
13.8% (511,639)
Number of households with income $100k - 125k:
Roma:
0.5% (20)
State:
8.6% (319,728)
Number of households with income $125k - 150k:
Roma:
2.0% (72)
State:
5.7% (210,932)
Number of households with income $150k - 200k:
Roma:
2.1% (77)
State:
6.4% (236,055)
Number of households with income > $200k:
Roma:
2.5% (90)
State:
5.1% (189,259)
Aggregate household income in Roma in 2022: $142,271,507
Median family income in Roma in 2022:
Roma:
$34,752
State:
$65,080
Number of families with income < $10k:
Roma:
16.3% (424)
State:
5.3% (147,493)
Number of families with income $10k - 20k:
Roma:
7.7% (200)
Texas:
6.3% (174,531)
Number of families with income $20k - 30k:
Roma:
10.9% (283)
Texas:
8.6% (238,528)
Number of families with income $30k - 40k:
Roma:
23.8% (618)
Texas:
9.1% (251,999)
Number of families with income $40k - 50k:
Roma:
14.5% (377)
Texas:
8.6% (240,188)
Number of families with income $50k - 60k:
Roma:
3.2% (83)
State:
8.0% (223,566)
Number of families with income $60k - 75k:
Roma:
7.3% (190)
State:
10.9% (302,688)
Number of families with income $75k - 100k:
Roma:
6.5% (170)
State:
14.3% (398,554)
Number of families with income $100k - 125k:
Roma:
0.9% (22)
State:
9.5% (264,007)
Number of families with income $125k - 150k:
Roma:
2.9% (76)
State:
6.2% (171,274)
Number of families with income $150k - 200k:
Roma:
2.9% (76)
Texas:
7.3% (202,259)
Number of families with income > $200k:
Roma:
3.1% (81)
State:
5.9% (165,129)
Median non-family income in Roma in 2022:
Roma:
$12,970
State:
$39,934
Change in median non-family income between 2000 and 2022:
Roma, Texas:
+97.9%
Texas:
+109.1%
Median per capita income in Roma in 2022:
Roma:
$14,634
Texas:
$24,862
Change in median per capita income between 2000 and 2022:
Roma, Texas:
+95.2%
State:
+130.8%
Income statistics for Multirace residents
Median household income in Roma, TX in 2022:
Roma:
$16,591
Texas:
$62,748
Change in median household income between 2000 and 2022:: -38.9%
Roma, Texas:
-38.9%
State:
+92.3%
Number of households with income < $10k:
Roma:
23.2% (553)
Texas:
5.5% (122,324)
Number of households with income $10k - 20k:
Roma:
28.3% (674)
Texas:
8.2% (182,232)
Number of households with income $20k - 30k:
Roma:
14.3% (341)
Texas:
8.5% (189,456)
Number of households with income $30k - 40k:
Roma:
10.0% (239)
State:
8.9% (197,499)
Number of households with income $40k - 50k:
Roma:
9.6% (229)
State:
8.7% (191,735)
Number of households with income $50k - 60k:
Roma:
2.3% (54)
Texas:
8.0% (177,535)
Number of households with income $60k - 75k:
Roma:
3.2% (75)
State:
10.5% (232,479)
Number of households with income $75k - 100k:
Roma:
4.5% (107)
State:
13.1% (290,448)
Number of households with income $100k - 125k:
Roma:
0.0% (0)
State:
8.6% (191,595)
Number of households with income $125k - 150k:
Roma:
1.1% (25)
State:
6.0% (133,361)
Number of households with income $150k - 200k:
Roma:
0.8% (19)
Texas:
7.2% (159,195)
Number of households with income > $200k:
Roma:
2.7% (64)
State:
6.7% (148,064)
Aggregate household income in Roma in 2022: $110,634,711
Median family income in Roma in 2022:
Roma:
$30,786
State:
$69,780
Number of families with income < $10k:
Roma:
31.9% (448)
Texas:
4.4% (70,825)
Number of families with income $10k - 20k:
Roma:
5.0% (70)
State:
5.9% (95,279)
Number of families with income $20k - 30k:
Roma:
9.3% (130)
State:
7.8% (126,627)
Number of families with income $30k - 40k:
Roma:
13.9% (195)
Texas:
8.5% (137,626)
Number of families with income $40k - 50k:
Roma:
16.2% (228)
State:
8.4% (135,809)
Number of families with income $50k - 60k:
Roma:
3.3% (47)
State:
7.9% (127,739)
Number of families with income $60k - 75k:
Roma:
5.4% (76)
Texas:
10.5% (169,549)
Number of families with income $75k - 100k:
Roma:
7.2% (101)
State:
14.0% (226,284)
Number of families with income $125k - 150k:
Roma:
1.9% (26)
State:
6.7% (107,900)
Number of families with income $150k - 200k:
Roma:
1.3% (19)
State:
8.5% (137,607)
Number of families with income > $200k:
Roma:
4.6% (65)
Texas:
7.9% (127,299)
Median non-family income in Roma in 2022:
Roma:
$13,608
State:
$40,634
Change in median non-family income between 2000 and 2022:: -59.7%
Roma, Texas:
-59.7%
State:
+77.2%
Median per capita income in Roma in 2022:
Roma:
$13,633
Texas:
$26,785
Change in median per capita income between 2000 and 2022:: -18.8%
Roma, Texas:
-18.8%
Texas:
+110.9%
Income statistics for other residents
Median household income in Roma, TX in 2022:
Roma:
$71,994
State:
$57,114
Number of households with income < $10k:
Roma:
0.0% (0)
State:
5.9% (54,162)
Number of households with income $10k - 20k:
Roma:
19.7% (25)
State:
6.8% (62,891)
Number of households with income $20k - 30k:
Roma:
0.0% (0)
Texas:
10.6% (97,294)
Number of households with income $30k - 40k:
Roma:
11.0% (14)
State:
10.8% (99,670)
Number of households with income $40k - 50k:
Roma:
0.0% (0)
State:
9.3% (85,548)
Number of households with income $50k - 60k:
Roma:
0.0% (0)
State:
9.0% (82,757)
Number of households with income $60k - 75k:
Roma:
59.8% (76)
State:
10.9% (100,326)
Number of households with income $75k - 100k:
Roma:
9.4% (12)
State:
14.0% (128,767)
Number of households with income $100k - 125k:
Roma:
0.0% (0)
State:
8.2% (75,218)
Number of households with income $125k - 150k:
Roma:
0.0% (0)
State:
4.8% (44,223)
Number of households with income $150k - 200k:
Roma:
0.0% (0)
Texas:
5.6% (51,376)
Number of households with income > $200k:
Roma:
0.0% (0)
State:
4.0% (36,393)
Aggregate household income in Roma in 2022: $9,904,679
Median family income in Roma in 2022:
Roma:
$71,498
State:
$60,064
Number of families with income $10k - 20k:
Roma:
9.5% (11)
State:
6.0% (41,763)
Number of families with income $20k - 30k:
Roma:
11.9% (13)
State:
9.9% (68,761)
Number of families with income $60k - 75k:
Roma:
67.4% (75)
State:
11.2% (77,588)
Number of families with income $75k - 100k:
Roma:
11.2% (12)
State:
14.5% (101,032)
Median per capita income in Roma in 2022:
Roma:
$9,320
State:
$23,899
Change in median per capita income between 2000 and 2022:: -14.0%
Roma, Texas:
-14.0%
Texas:
+135.2%
Discuss Roma, Texas (TX) on our hugely popular Texas forum.