South Bell, Texas (TX) income map, earnings map, and wages data
The median household income in South Bell, TX in 2022 was $86,951, which was 16.9% greater than the median annual income of $72,284 across the entire state of Texas. Compared to the median income of $51,597 in 2000 this represents an increase of 40.7%. The per capita income in 2022 was $47,381, which means an increase of 47.5% compared to 2000 when it was $24,889.
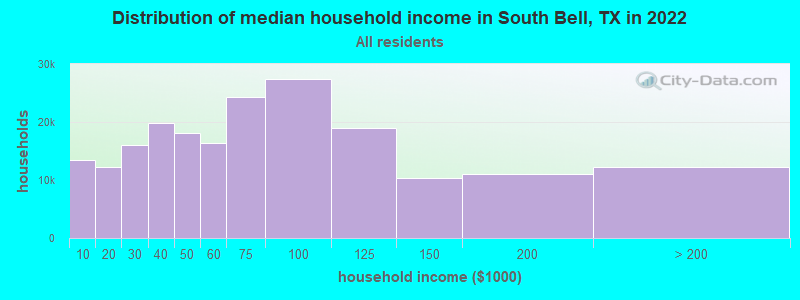
Income statistics for all residents
Median household income in South Bell, TX in 2022:| South Bell: | $86,952 |
| State: | $72,284 |
Change in median household income between 2000 and 2022:| South Bell, Texas: | +68.5% |
| State: | +81.0% |
Number of households with income < $10k:| South Bell: | 6.7% (13,367) |
| Texas: | 5.5% (611,011) |
Number of households with income $10k - 20k:| South Bell: | 6.1% (12,320) |
| State: | 6.7% (743,157) |
Number of households with income $20k - 30k:| South Bell: | 8.0% (16,084) |
| State: | 7.2% (803,381) |
Number of households with income $30k - 40k:| South Bell: | 9.9% (19,855) |
| State: | 7.8% (866,080) |
Number of households with income $40k - 50k:| South Bell: | 9.1% (18,163) |
| Texas: | 7.3% (810,440) |
Number of households with income $50k - 60k:| South Bell: | 8.1% (16,305) |
| Texas: | 7.2% (799,783) |
Number of households with income $60k - 75k:| South Bell: | 12.1% (24,276) |
| State: | 9.9% (1,095,384) |
Number of households with income $75k - 100k:| South Bell: | 13.7% (27,437) |
| Texas: | 12.8% (1,419,057) |
Number of households with income $100k - 125k:| South Bell: | 9.5% (19,048) |
| Texas: | 9.5% (1,054,577) |
Number of households with income $125k - 150k:| South Bell: | 5.2% (10,413) |
| State: | 6.7% (741,518) |
Number of households with income $150k - 200k:| South Bell: | 5.5% (11,058) |
| State: | 8.7% (961,776) |
Number of households with income > $200k:| South Bell: | 6.1% (12,286) |
| State: | 10.7% (1,181,544) |
Aggregate household income in South Bell in 2022: $1,028,290,668
Median family income in South Bell in 2022:| South Bell: | $103,264 |
| State: | $86,267 |
Median non-family income in South Bell in 2022:| South Bell: | $43,428 |
| Texas: | $45,999 |
Change in median non-family income between 2000 and 2022:| South Bell, Texas: | +84.0% |
| Texas: | +79.5% |
Median per capita income in South Bell in 2022:| South Bell: | $47,381 |
| State: | $38,123 |
Change in median per capita income between 2000 and 2022:| South Bell, Texas: | +90.4% |
| State: | +94.3% |
Income statistics for White residents
Median household income in South Bell, TX in 2022:| South Bell: | $91,732 |
| State: | $82,032 |
Change in median household income between 2000 and 2022:| South Bell, Texas: | +72.4% |
| State: | +91.0% |
Number of households with income < $10k:| South Bell: | 4.6% (4,483) |
| State: | 4.7% (273,716) |
Number of households with income $10k - 20k:| South Bell: | 7.1% (6,857) |
| State: | 5.5% (322,702) |
Number of households with income $20k - 30k:| South Bell: | 7.0% (6,771) |
| State: | 6.2% (363,947) |
Number of households with income $30k - 40k:| South Bell: | 7.8% (7,545) |
| State: | 6.8% (399,275) |
Number of households with income $40k - 50k:| South Bell: | 8.0% (7,757) |
| State: | 6.5% (383,417) |
Number of households with income $50k - 60k:| South Bell: | 8.3% (8,051) |
| State: | 6.6% (388,535) |
Number of households with income $60k - 75k:| South Bell: | 11.2% (10,899) |
| State: | 9.7% (566,295) |
Number of households with income $75k - 100k:| South Bell: | 15.1% (14,677) |
| Texas: | 13.0% (760,276) |
Number of households with income $100k - 125k:| South Bell: | 10.6% (10,285) |
| State: | 10.2% (597,596) |
Number of households with income $125k - 150k:| South Bell: | 6.2% (6,016) |
| Texas: | 7.4% (436,830) |
Number of households with income $150k - 200k:| South Bell: | 6.9% (6,741) |
| State: | 9.9% (583,067) |
Number of households with income > $200k:| South Bell: | 7.2% (6,991) |
| Texas: | 13.5% (792,647) |
Aggregate household income in South Bell in 2022: $550,286,097
Median family income in South Bell in 2022:| South Bell: | $111,105 |
| Texas: | $101,788 |
Number of families with income < $10k:| South Bell: | 1.2% (40) |
| State: | 2.8% (108,142) |
Number of families with income $10k - 20k:| South Bell: | 1.6% (54) |
| State: | 2.9% (113,421) |
Number of families with income $20k - 30k:| South Bell: | 2.4% (78) |
| State: | 4.1% (157,688) |
Number of families with income $30k - 40k:| South Bell: | 2.9% (97) |
| State: | 5.2% (198,847) |
Number of families with income $40k - 50k:| South Bell: | 6.2% (205) |
| State: | 5.6% (216,490) |
Number of families with income $50k - 60k:| South Bell: | 4.9% (162) |
| State: | 5.7% (220,689) |
Number of families with income $60k - 75k:| South Bell: | 8.7% (290) |
| Texas: | 9.0% (346,106) |
Number of families with income $75k - 100k:| South Bell: | 17.6% (584) |
| Texas: | 13.7% (527,363) |
Number of families with income $100k - 125k:| South Bell: | 17.4% (576) |
| State: | 11.6% (448,411) |
Number of families with income $125k - 150k:| South Bell: | 12.4% (411) |
| Texas: | 9.2% (355,798) |
Number of families with income $150k - 200k:| South Bell: | 8.0% (267) |
| Texas: | 12.5% (480,185) |
Number of families with income > $200k:| South Bell: | 16.7% (555) |
| State: | 17.6% (677,490) |
Median non-family income in South Bell in 2022:| South Bell: | $42,143 |
| State: | $50,587 |
Change in median non-family income between 2000 and 2022:| South Bell, Texas: | +75.6% |
| Texas: | +87.7% |
Median per capita income in South Bell in 2022:| South Bell: | $51,971 |
| Texas: | $47,740 |
Change in median per capita income between 2000 and 2022:| South Bell, Texas: | +95.5% |
| State: | +114.3% |
Income statistics for Black or African American residents
Median household income in South Bell, TX in 2022:| South Bell: | $18,506 |
| State: | $55,759 |
Change in median household income between 2000 and 2022:| South Bell, Texas: | +64.5% |
| State: | +90.3% |
Number of households with income < $10k:| South Bell: | 9.6% (1,190) |
| State: | 8.9% (126,378) |
Number of households with income $10k - 20k:| South Bell: | 6.0% (751) |
| State: | 9.9% (140,369) |
Number of households with income $20k - 30k:| South Bell: | 7.6% (941) |
| State: | 8.5% (120,639) |
Number of households with income $30k - 40k:| South Bell: | 12.7% (1,578) |
| State: | 9.7% (137,517) |
Number of households with income $40k - 50k:| South Bell: | 11.6% (1,447) |
| State: | 8.0% (112,973) |
Number of households with income $50k - 60k:| South Bell: | 9.0% (1,118) |
| State: | 8.3% (117,156) |
Number of households with income $60k - 75k:| South Bell: | 14.0% (1,739) |
| Texas: | 10.4% (147,462) |
Number of households with income $75k - 100k:| South Bell: | 9.6% (1,190) |
| State: | 11.5% (162,718) |
Number of households with income $100k - 125k:| South Bell: | 7.7% (956) |
| Texas: | 8.2% (115,829) |
Number of households with income $125k - 150k:| South Bell: | 4.1% (512) |
| State: | 4.9% (69,556) |
Number of households with income $150k - 200k:| South Bell: | 3.7% (462) |
| Texas: | 6.4% (90,701) |
Number of households with income > $200k:| South Bell: | 4.4% (541) |
| State: | 5.5% (77,988) |
Aggregate household income in South Bell in 2022: $6,700,606
Median family income in South Bell in 2022:| South Bell: | $22,202 |
| State: | $69,134 |
Number of families with income < $10k:| South Bell: | 38.5% (39) |
| State: | 6.8% (55,625) |
Number of families with income $10k - 20k:| South Bell: | 11.9% (12) |
| Texas: | 6.8% (55,300) |
Number of families with income $20k - 30k:| South Bell: | 2.0% (2) |
| State: | 7.1% (57,877) |
Number of families with income $30k - 40k:| South Bell: | 7.2% (7) |
| Texas: | 8.5% (68,776) |
Number of families with income $40k - 50k:| South Bell: | 6.2% (6) |
| State: | 7.1% (57,907) |
Number of families with income $100k - 125k:| South Bell: | 34.2% (35) |
| State: | 9.4% (76,609) |
Median non-family income in South Bell in 2022:| South Bell: | $14,278 |
| State: | $40,133 |
Change in median non-family income between 2000 and 2022:| South Bell, Texas: | +95.8% |
| State: | +102.2% |
Median per capita income in South Bell in 2022:| South Bell: | $15,420 |
| State: | $30,490 |
Change in median per capita income between 2000 and 2022:| South Bell, Texas: | +99.2% |
| State: | +113.9% |
Income statistics for Asian residents
Median household income in South Bell, TX in 2022:| South Bell: | $113,822 |
| State: | $107,673 |
Change in median household income between 2000 and 2022:| South Bell, Texas: | +102.3% |
| Texas: | +115.1% |
Number of households with income < $10k:| South Bell: | 5.3% (16,816) |
| Texas: | 5.2% (29,885) |
Number of households with income $10k - 20k:| South Bell: | 4.8% (15,216) |
| State: | 4.7% (27,044) |
Number of households with income $20k - 30k:| South Bell: | 4.1% (13,113) |
| Texas: | 4.1% (23,363) |
Number of households with income $30k - 40k:| South Bell: | 4.1% (13,110) |
| State: | 4.1% (23,309) |
Number of households with income $40k - 50k:| South Bell: | 5.2% (16,759) |
| State: | 5.2% (29,826) |
Number of households with income $50k - 60k:| South Bell: | 4.6% (14,866) |
| Texas: | 4.7% (26,512) |
Number of households with income $60k - 75k:| South Bell: | 6.5% (20,763) |
| State: | 6.5% (36,905) |
Number of households with income $75k - 100k:| South Bell: | 11.3% (36,104) |
| Texas: | 11.3% (64,350) |
Number of households with income $100k - 125k:| South Bell: | 11.3% (36,335) |
| Texas: | 11.4% (64,714) |
Number of households with income $125k - 150k:| South Bell: | 9.3% (29,622) |
| Texas: | 9.3% (52,719) |
Number of households with income $150k - 200k:| South Bell: | 12.5% (39,874) |
| State: | 12.5% (70,953) |
Number of households with income > $200k:| South Bell: | 21.1% (67,578) |
| Texas: | 21.1% (120,260) |
Aggregate household income in South Bell in 2022: $1,397,386
Median family income in South Bell in 2022:| South Bell: | $103,336 |
| State: | $123,328 |
Number of families with income $50k - 60k:| South Bell: | 100.0% (16) |
| State: | 4.7% (20,568) |
Median per capita income in South Bell in 2022:| South Bell: | $21,204 |
| Texas: | $48,626 |
Change in median per capita income between 2000 and 2022:| South Bell, Texas: | +76.1% |
| Texas: | +132.0% |
Income statistics for Hispanic or Latino residents
Median household income in South Bell, TX in 2022:| South Bell: | $77,579 |
| State: | $60,504 |
Change in median household income between 2000 and 2022:| South Bell, Texas: | +85.6% |
| State: | +102.5% |
Number of households with income < $10k:| South Bell: | 7.1% (3,116) |
| Texas: | 5.8% (213,953) |
Number of households with income $10k - 20k:| South Bell: | 4.3% (1,895) |
| State: | 8.0% (297,456) |
Number of households with income $20k - 30k:| South Bell: | 11.0% (4,829) |
| State: | 9.2% (340,166) |
Number of households with income $30k - 40k:| South Bell: | 10.3% (4,495) |
| State: | 9.5% (354,336) |
Number of households with income $40k - 50k:| South Bell: | 10.2% (4,454) |
| State: | 8.8% (327,013) |
Number of households with income $50k - 60k:| South Bell: | 8.2% (3,588) |
| State: | 8.3% (308,818) |
Number of households with income $60k - 75k:| South Bell: | 9.6% (4,200) |
| Texas: | 10.9% (405,109) |
Number of households with income $75k - 100k:| South Bell: | 14.0% (6,146) |
| Texas: | 13.8% (511,639) |
Number of households with income $100k - 125k:| South Bell: | 11.8% (5,183) |
| Texas: | 8.6% (319,728) |
Number of households with income $125k - 150k:| South Bell: | 5.8% (2,550) |
| State: | 5.7% (210,932) |
Number of households with income $150k - 200k:| South Bell: | 4.3% (1,883) |
| Texas: | 6.4% (236,055) |
Number of households with income > $200k:| South Bell: | 3.3% (1,461) |
| State: | 5.1% (189,259) |
Aggregate household income in South Bell in 2022: $52,383,884
Median family income in South Bell in 2022:| South Bell: | $80,486 |
| State: | $65,080 |
Number of families with income < $10k:| South Bell: | 3.0% (47) |
| Texas: | 5.3% (147,493) |
Number of families with income $10k - 20k:| South Bell: | 1.7% (26) |
| State: | 6.3% (174,531) |
Number of families with income $20k - 30k:| South Bell: | 5.8% (91) |
| State: | 8.6% (238,528) |
Number of families with income $30k - 40k:| South Bell: | 6.3% (99) |
| Texas: | 9.1% (251,999) |
Number of families with income $40k - 50k:| South Bell: | 7.8% (122) |
| Texas: | 8.6% (240,188) |
Number of families with income $50k - 60k:| South Bell: | 5.1% (79) |
| State: | 8.0% (223,566) |
Number of families with income $60k - 75k:| South Bell: | 8.6% (134) |
| Texas: | 10.9% (302,688) |
Number of families with income $75k - 100k:| South Bell: | 15.8% (246) |
| Texas: | 14.3% (398,554) |
Number of families with income $100k - 125k:| South Bell: | 20.6% (322) |
| State: | 9.5% (264,007) |
Number of families with income $125k - 150k:| South Bell: | 9.7% (152) |
| State: | 6.2% (171,274) |
Number of families with income $150k - 200k:| South Bell: | 7.5% (118) |
| State: | 7.3% (202,259) |
Number of families with income > $200k:| South Bell: | 8.0% (124) |
| State: | 5.9% (165,129) |
Median non-family income in South Bell in 2022:| South Bell: | $75,205 |
| Texas: | $39,934 |
Change in median non-family income between 2000 and 2022:| South Bell, Texas: | +107.5% |
| Texas: | +109.1% |
Median per capita income in South Bell in 2022:| South Bell: | $27,607 |
| State: | $24,862 |
Change in median per capita income between 2000 and 2022:| South Bell, Texas: | +128.6% |
| State: | +130.8% |
Income statistics for American Indian and Alaska Native residents
Median household income in South Bell, TX in 2022:| South Bell: | $94,088 |
| Texas: | $65,765 |
Change in median household income between 2000 and 2022:| South Bell, Texas: | +47.1% |
| State: | +88.3% |
Number of households with income < $10k:| South Bell: | 4.1% (3,117) |
| State: | 4.1% (3,398) |
Number of households with income $10k - 20k:| South Bell: | 8.3% (6,373) |
| State: | 8.3% (6,949) |
Number of households with income $20k - 30k:| South Bell: | 9.3% (7,101) |
| Texas: | 9.3% (7,742) |
Number of households with income $30k - 40k:| South Bell: | 9.1% (6,987) |
| Texas: | 9.1% (7,627) |
Number of households with income $40k - 50k:| South Bell: | 7.1% (5,437) |
| Texas: | 7.1% (5,922) |
Number of households with income $50k - 60k:| South Bell: | 8.1% (6,203) |
| Texas: | 8.1% (6,761) |
Number of households with income $60k - 75k:| South Bell: | 12.7% (9,708) |
| State: | 12.7% (10,588) |
Number of households with income $75k - 100k:| South Bell: | 13.0% (10,003) |
| Texas: | 13.0% (10,903) |
Number of households with income $100k - 125k:| South Bell: | 9.9% (7,573) |
| State: | 9.9% (8,256) |
Number of households with income $125k - 150k:| South Bell: | 5.2% (3,992) |
| Texas: | 5.2% (4,355) |
Number of households with income $150k - 200k:| South Bell: | 6.7% (5,152) |
| Texas: | 6.7% (5,623) |
Number of households with income > $200k:| South Bell: | 6.6% (5,058) |
| Texas: | 6.6% (5,522) |
Aggregate household income in South Bell in 2022: $5,009,199
Median family income in South Bell in 2022:| South Bell: | $73,366 |
| State: | $72,369 |
Number of families with income $30k - 40k:| South Bell: | 7.9% (4) |
| Texas: | 7.5% (4,592) |
Number of families with income $40k - 50k:| South Bell: | 8.7% (5) |
| State: | 7.9% (4,855) |
Number of families with income $60k - 75k:| South Bell: | 27.6% (15) |
| State: | 12.1% (7,429) |
Number of families with income $75k - 100k:| South Bell: | 30.2% (17) |
| State: | 14.4% (8,852) |
Number of families with income $100k - 125k:| South Bell: | 25.6% (14) |
| State: | 11.4% (6,997) |
Median per capita income in South Bell in 2022:| South Bell: | $31,729 |
| State: | $28,166 |
Change in median per capita income between 2000 and 2022:| South Bell, Texas: | +64.4% |
| State: | +77.2% |
Income statistics for Multirace residents
Median household income in South Bell, TX in 2022:| South Bell: | $301,263 |
| Texas: | $62,748 |
Change in median household income between 2000 and 2022:| South Bell, Texas: | +139.8% |
| State: | +92.3% |
Number of households with income < $10k:| South Bell: | 5.0% (3,302) |
| Texas: | 5.5% (122,324) |
Number of households with income $10k - 20k:| South Bell: | 4.9% (3,272) |
| Texas: | 8.2% (182,232) |
Number of households with income $20k - 30k:| South Bell: | 5.8% (3,896) |
| Texas: | 8.5% (189,456) |
Number of households with income $30k - 40k:| South Bell: | 14.7% (9,771) |
| Texas: | 8.9% (197,499) |
Number of households with income $40k - 50k:| South Bell: | 7.8% (5,178) |
| Texas: | 8.7% (191,735) |
Number of households with income $50k - 60k:| South Bell: | 7.9% (5,247) |
| Texas: | 8.0% (177,535) |
Number of households with income $60k - 75k:| South Bell: | 12.1% (8,051) |
| State: | 10.5% (232,479) |
Number of households with income $75k - 100k:| South Bell: | 16.0% (10,664) |
| Texas: | 13.1% (290,448) |
Number of households with income $100k - 125k:| South Bell: | 11.1% (7,379) |
| State: | 8.6% (191,595) |
Number of households with income $125k - 150k:| South Bell: | 3.9% (2,565) |
| State: | 6.0% (133,361) |
Number of households with income $150k - 200k:| South Bell: | 3.6% (2,431) |
| Texas: | 7.2% (159,195) |
Number of households with income > $200k:| South Bell: | 7.3% (4,862) |
| Texas: | 6.7% (148,064) |
Aggregate household income in South Bell in 2022: $35,010,080
Median family income in South Bell in 2022:| South Bell: | $193,280 |
| State: | $69,780 |
Number of families with income $40k - 50k:| South Bell: | 14.5% (10) |
| Texas: | 8.4% (135,809) |
Number of families with income $75k - 100k:| South Bell: | 85.5% (59) |
| Texas: | 14.0% (226,284) |
Median non-family income in South Bell in 2022:| South Bell: | $272,654 |
| State: | $40,634 |
Change in median non-family income between 2000 and 2022:| South Bell, Texas: | +114.2% |
| State: | +77.2% |
Median per capita income in South Bell in 2022:| South Bell: | $93,235 |
| State: | $26,785 |
Income statistics for other residents
Number of households with income < $10k:| South Bell: | 12.5% (41) |
| State: | 5.9% (54,162) |
Number of households with income $10k - 20k:| South Bell: | 1.8% (6) |
| State: | 6.8% (62,891) |
Number of households with income $20k - 30k:| South Bell: | 14.3% (47) |
| State: | 10.6% (97,294) |
Number of households with income $30k - 40k:| South Bell: | 12.8% (42) |
| State: | 10.8% (99,670) |
Number of households with income $40k - 50k:| South Bell: | 9.5% (31) |
| State: | 9.3% (85,548) |
Number of households with income $50k - 60k:| South Bell: | 8.5% (28) |
| Texas: | 9.0% (82,757) |
Number of households with income $60k - 75k:| South Bell: | 8.8% (29) |
| State: | 10.9% (100,326) |
Number of households with income $75k - 100k:| South Bell: | 12.2% (40) |
| State: | 14.0% (128,767) |
Number of households with income $100k - 125k:| South Bell: | 7.9% (26) |
| Texas: | 8.2% (75,218) |
Number of households with income $125k - 150k:| South Bell: | 3.4% (11) |
| State: | 4.8% (44,223) |
Number of households with income $150k - 200k:| South Bell: | 4.9% (16) |
| State: | 5.6% (51,376) |
Number of households with income > $200k:| South Bell: | 3.4% (11) |
| State: | 4.0% (36,393) |
Aggregate household income in South Bell in 2022: $22,230,027
Median family income in South Bell in 2022:| South Bell: | $71,499 |
| Texas: | $60,064 |
Number of families with income $10k - 20k:| South Bell: | 0.8% (3) |
| State: | 6.0% (41,763) |
Number of families with income $20k - 30k:| South Bell: | 5.1% (21) |
| State: | 9.9% (68,761) |
Number of families with income $30k - 40k:| South Bell: | 3.1% (13) |
| State: | 9.7% (67,685) |
Number of families with income $40k - 50k:| South Bell: | 4.3% (18) |
| State: | 9.0% (62,441) |
Number of families with income $50k - 60k:| South Bell: | 9.2% (38) |
| Texas: | 8.5% (59,321) |
Number of families with income $60k - 75k:| South Bell: | 3.6% (15) |
| State: | 11.2% (77,588) |
Number of families with income $75k - 100k:| South Bell: | 23.9% (99) |
| State: | 14.5% (101,032) |
Number of families with income $100k - 125k:| South Bell: | 23.0% (95) |
| State: | 8.8% (61,439) |
Number of families with income $150k - 200k:| South Bell: | 27.0% (111) |
| State: | 5.9% (41,211) |
Median non-family income in South Bell in 2022:| South Bell: | $15,656 |
| Texas: | $38,690 |
Change in median non-family income between 2000 and 2022:| South Bell, Texas: | +78.9% |
| Texas: | +90.2% |
Median per capita income in South Bell in 2022:| South Bell: | $26,420 |
| State: | $23,899 |
Change in median per capita income between 2000 and 2022:| South Bell, Texas: | +134.3% |
| State: | +135.2% |