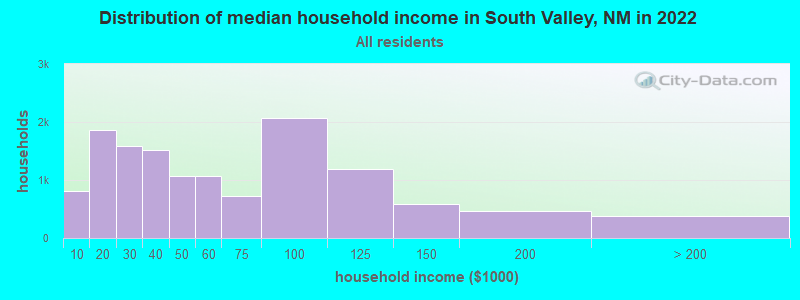
The median household income in South Valley, NM in 2022 was $46,719, which was 27.8% less than the median annual income of $59,726 across the entire state of New Mexico. Compared to the median income of $30,879 in 2000 this represents an increase of 33.9%. The per capita income in 2022 was $24,882, which means an increase of 46.9% compared to 2000 when it was $13,217.
Whole page based on the data from 2000 / 2022 when the population of South Valley, New Mexico was 39,060 / 37,479
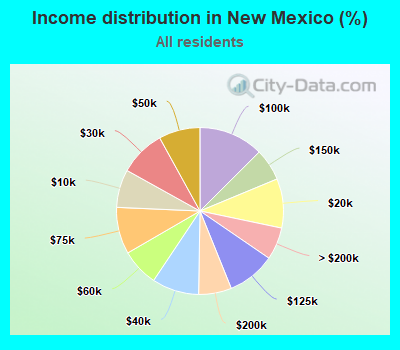
Income statistics for all residents
Median household income in South Valley, NM in 2022:
South Valley:
$46,720
State:
$59,726
Change in median household income between 2000 and 2022:
South Valley, New Mexico:
+51.3%
New Mexico:
+75.0%
Number of households with income < $10k:
South Valley:
6.1% (812)
New Mexico:
7.4% (62,451)
Number of households with income $10k - 20k:
South Valley:
14.0% (1,870)
State:
9.5% (80,886)
Number of households with income $20k - 30k:
South Valley:
11.9% (1,582)
State:
8.9% (75,578)
Number of households with income $30k - 40k:
South Valley:
11.4% (1,521)
State:
9.1% (77,319)
Number of households with income $40k - 50k:
South Valley:
8.0% (1,064)
New Mexico:
8.0% (67,979)
Number of households with income $50k - 60k:
South Valley:
8.0% (1,064)
State:
7.2% (61,477)
Number of households with income $60k - 75k:
South Valley:
5.4% (723)
New Mexico:
9.1% (77,047)
Number of households with income $75k - 100k:
South Valley:
15.5% (2,072)
State:
12.5% (106,292)
Number of households with income $100k - 125k:
South Valley:
8.9% (1,188)
State:
9.3% (79,200)
Number of households with income $125k - 150k:
South Valley:
4.4% (591)
State:
6.2% (52,769)
Number of households with income $150k - 200k:
South Valley:
3.5% (467)
State:
6.4% (54,020)
Number of households with income > $200k:
South Valley:
2.8% (373)
State:
6.3% (53,200)
Aggregate household income in South Valley in 2022: $854,206,555
Median family income in South Valley in 2022:
South Valley:
$60,135
State:
$74,341
Number of families with income < $10k:
South Valley:
4.5% (392)
New Mexico:
4.5% (23,191)
Number of families with income $10k - 20k:
South Valley:
8.3% (712)
State:
5.6% (28,861)
Number of families with income $20k - 30k:
South Valley:
9.0% (773)
State:
6.8% (35,308)
Number of families with income $30k - 40k:
South Valley:
11.3% (975)
State:
8.4% (43,204)
Number of families with income $40k - 50k:
South Valley:
7.3% (627)
State:
8.2% (42,398)
Number of families with income $50k - 60k:
South Valley:
9.0% (775)
New Mexico:
7.2% (37,358)
Number of families with income $60k - 75k:
South Valley:
6.5% (559)
State:
9.7% (50,331)
Number of families with income $75k - 100k:
South Valley:
19.4% (1,676)
State:
14.1% (72,803)
Number of families with income $100k - 125k:
South Valley:
10.1% (868)
New Mexico:
10.7% (55,058)
Number of families with income $125k - 150k:
South Valley:
6.3% (544)
State:
7.9% (40,847)
Number of families with income $150k - 200k:
South Valley:
4.4% (383)
State:
8.5% (44,144)
Number of families with income > $200k:
South Valley:
4.0% (343)
New Mexico:
8.3% (42,961)
Median non-family income in South Valley in 2022:
South Valley:
$25,179
State:
$36,532
Change in median non-family income between 2000 and 2022:
South Valley, New Mexico:
+34.7%
New Mexico:
+67.6%
Median per capita income in South Valley in 2022:
South Valley:
$24,883
New Mexico:
$33,916
Change in median per capita income between 2000 and 2022:
South Valley, New Mexico:
+88.3%
State:
+96.5%
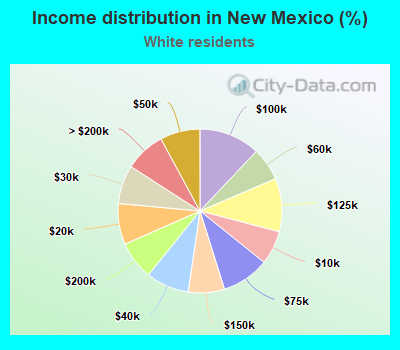
Income statistics for White residents
Median household income in South Valley, NM in 2022:
South Valley:
$55,165
State:
$66,903
Change in median household income between 2000 and 2022:
South Valley, New Mexico:
+74.7%
New Mexico:
+80.9%
Number of households with income < $10k:
South Valley:
5.7% (319)
New Mexico:
6.7% (30,275)
Number of households with income $10k - 20k:
South Valley:
12.4% (700)
State:
8.1% (36,636)
Number of households with income $20k - 30k:
South Valley:
11.5% (647)
State:
7.6% (34,662)
Number of households with income $30k - 40k:
South Valley:
11.4% (641)
State:
8.5% (38,487)
Number of households with income $40k - 50k:
South Valley:
6.3% (357)
New Mexico:
7.9% (35,775)
Number of households with income $50k - 60k:
South Valley:
9.7% (547)
State:
6.5% (29,590)
Number of households with income $60k - 75k:
South Valley:
5.7% (324)
State:
9.4% (42,749)
Number of households with income $75k - 100k:
South Valley:
14.7% (828)
New Mexico:
12.1% (54,752)
Number of households with income $100k - 125k:
South Valley:
10.6% (600)
State:
10.5% (47,619)
Number of households with income $125k - 150k:
South Valley:
3.6% (201)
State:
7.1% (32,441)
Number of households with income $150k - 200k:
South Valley:
5.1% (290)
State:
7.6% (34,408)
Number of households with income > $200k:
South Valley:
3.4% (190)
State:
8.0% (36,335)
Aggregate household income in South Valley in 2022: $387,259,568
Median family income in South Valley in 2022:
South Valley:
$65,839
New Mexico:
$86,441
Number of families with income < $10k:
South Valley:
5.0% (168)
New Mexico:
3.2% (8,287)
Number of families with income $10k - 20k:
South Valley:
6.9% (232)
State:
3.8% (9,892)
Number of families with income $20k - 30k:
South Valley:
8.4% (283)
State:
4.9% (12,813)
Number of families with income $30k - 40k:
South Valley:
12.9% (436)
State:
7.9% (20,670)
Number of families with income $40k - 50k:
South Valley:
4.7% (158)
State:
7.4% (19,396)
Number of families with income $50k - 60k:
South Valley:
8.8% (299)
New Mexico:
6.0% (15,747)
Number of families with income $60k - 75k:
South Valley:
4.9% (166)
New Mexico:
10.0% (26,136)
Number of families with income $75k - 100k:
South Valley:
20.4% (690)
State:
13.6% (35,677)
Number of families with income $100k - 125k:
South Valley:
11.0% (372)
New Mexico:
11.9% (31,166)
Number of families with income $125k - 150k:
South Valley:
5.5% (187)
State:
9.4% (24,562)
Number of families with income $150k - 200k:
South Valley:
6.7% (226)
New Mexico:
10.8% (28,256)
Number of families with income > $200k:
South Valley:
5.1% (172)
New Mexico:
11.1% (29,014)
Median non-family income in South Valley in 2022:
South Valley:
$30,389
State:
$41,946
Change in median non-family income between 2000 and 2022:
South Valley, New Mexico:
+46.4%
New Mexico:
+80.4%
Median per capita income in South Valley in 2022:
South Valley:
$28,101
New Mexico:
$42,438
Change in median per capita income between 2000 and 2022:
South Valley, New Mexico:
+84.8%
New Mexico:
+109.0%
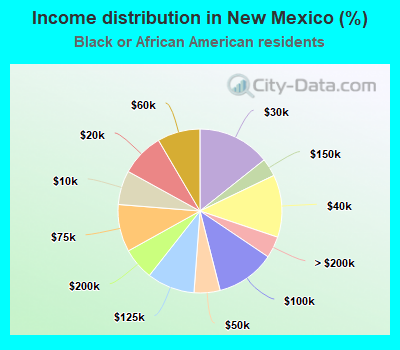
Income statistics for Black or African American residents
Number of households with income < $10k:
South Valley:
29.2% (7)
New Mexico:
6.7% (1,186)
Number of households with income $10k - 20k:
South Valley:
16.7% (4)
New Mexico:
8.5% (1,505)
Number of households with income $20k - 30k:
South Valley:
0.0% (0)
New Mexico:
14.3% (2,518)
Number of households with income $30k - 40k:
South Valley:
54.2% (13)
State:
12.3% (2,169)
Number of households with income $40k - 50k:
South Valley:
0.0% (0)
State:
5.1% (901)
Number of households with income $50k - 60k:
South Valley:
0.0% (0)
State:
8.4% (1,487)
Number of households with income $60k - 75k:
South Valley:
0.0% (0)
State:
9.4% (1,648)
Number of households with income $75k - 100k:
South Valley:
0.0% (0)
State:
11.6% (2,046)
Number of households with income $100k - 125k:
South Valley:
0.0% (0)
State:
9.4% (1,660)
Number of households with income $125k - 150k:
South Valley:
0.0% (0)
State:
3.6% (630)
Number of households with income $150k - 200k:
South Valley:
0.0% (0)
New Mexico:
6.3% (1,113)
Number of households with income > $200k:
South Valley:
0.0% (0)
State:
4.3% (749)
Aggregate household income in South Valley in 2022: $451,898
Median per capita income in South Valley in 2022:
South Valley:
$16,085
State:
$32,123
Change in median per capita income between 2000 and 2022:
South Valley, New Mexico:
+19.3%
State:
+116.3%
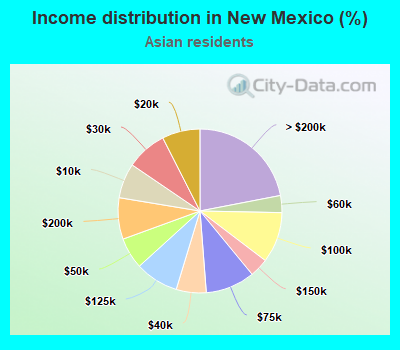
Income statistics for Asian residents
Number of households with income < $10k:
South Valley:
0.0% (0)
State:
6.9% (867)
Number of households with income $10k - 20k:
South Valley:
0.0% (0)
State:
7.5% (942)
Number of households with income $20k - 30k:
South Valley:
0.0% (0)
State:
8.0% (1,007)
Number of households with income $30k - 40k:
South Valley:
0.0% (0)
State:
5.9% (746)
Number of households with income $40k - 50k:
South Valley:
33.3% (5)
State:
6.2% (777)
Number of households with income $50k - 60k:
South Valley:
0.0% (0)
New Mexico:
3.4% (422)
Number of households with income $60k - 75k:
South Valley:
0.0% (0)
State:
9.7% (1,224)
Number of households with income $75k - 100k:
South Valley:
66.7% (10)
State:
10.0% (1,259)
Number of households with income $100k - 125k:
South Valley:
0.0% (0)
New Mexico:
8.6% (1,076)
Number of households with income $125k - 150k:
South Valley:
0.0% (0)
State:
3.7% (466)
Number of households with income $150k - 200k:
South Valley:
0.0% (0)
New Mexico:
8.2% (1,030)
Number of households with income > $200k:
South Valley:
0.0% (0)
State:
22.0% (2,766)
Aggregate household income in South Valley in 2022: $4,818,038
Median per capita income in South Valley in 2022:
South Valley:
$25,486
New Mexico:
$50,238
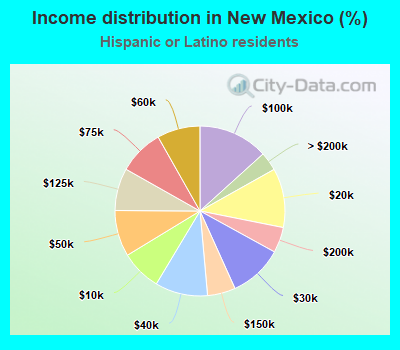
Income statistics for Hispanic or Latino residents
Median household income in South Valley, NM in 2022:
South Valley:
$45,822
State:
$52,568
Change in median household income between 2000 and 2022:
South Valley, New Mexico:
+55.0%
State:
+84.9%
Number of households with income < $10k:
South Valley:
5.3% (538)
State:
7.7% (28,825)
Number of households with income $10k - 20k:
South Valley:
17.6% (1,805)
New Mexico:
11.3% (42,162)
Number of households with income $20k - 30k:
South Valley:
10.6% (1,085)
State:
10.3% (38,397)
Number of households with income $30k - 40k:
South Valley:
11.6% (1,184)
State:
10.0% (37,425)
Number of households with income $40k - 50k:
South Valley:
8.0% (821)
State:
8.8% (32,925)
Number of households with income $50k - 60k:
South Valley:
7.0% (714)
New Mexico:
8.2% (30,606)
Number of households with income $60k - 75k:
South Valley:
5.3% (544)
State:
8.6% (32,270)
Number of households with income $75k - 100k:
South Valley:
17.6% (1,804)
State:
13.3% (49,793)
Number of households with income $100k - 125k:
South Valley:
7.5% (766)
State:
8.1% (30,306)
Number of households with income $125k - 150k:
South Valley:
4.6% (473)
New Mexico:
5.3% (19,926)
Number of households with income $150k - 200k:
South Valley:
3.2% (326)
State:
4.9% (18,186)
Number of households with income > $200k:
South Valley:
1.7% (178)
State:
3.6% (13,321)
Aggregate household income in South Valley in 2022: $607,571,296
Median family income in South Valley in 2022:
South Valley:
$57,423
State:
$61,248
Number of families with income < $10k:
South Valley:
4.4% (319)
New Mexico:
5.3% (12,979)
Number of families with income $10k - 20k:
South Valley:
10.6% (762)
State:
7.5% (18,298)
Number of families with income $20k - 30k:
South Valley:
9.9% (714)
State:
8.9% (21,661)
Number of families with income $30k - 40k:
South Valley:
10.2% (734)
State:
9.3% (22,776)
Number of families with income $40k - 50k:
South Valley:
7.8% (562)
State:
10.0% (24,418)
Number of families with income $50k - 60k:
South Valley:
9.2% (660)
New Mexico:
8.1% (19,722)
Number of families with income $60k - 75k:
South Valley:
7.0% (506)
New Mexico:
9.5% (23,251)
Number of families with income $75k - 100k:
South Valley:
19.1% (1,377)
New Mexico:
14.4% (35,090)
Number of families with income $100k - 125k:
South Valley:
9.9% (715)
State:
9.8% (23,976)
Number of families with income $125k - 150k:
South Valley:
6.1% (443)
New Mexico:
6.8% (16,727)
Number of families with income $150k - 200k:
South Valley:
3.4% (247)
State:
5.8% (14,187)
Number of families with income > $200k:
South Valley:
2.4% (174)
New Mexico:
4.7% (11,406)
Median non-family income in South Valley in 2022:
South Valley:
$22,542
New Mexico:
$31,429
Change in median non-family income between 2000 and 2022:
South Valley, New Mexico:
+51.2%
New Mexico:
+86.7%
Median per capita income in South Valley in 2022:
South Valley:
$21,956
State:
$25,400
Change in median per capita income between 2000 and 2022:
South Valley, New Mexico:
+91.3%
New Mexico:
+110.9%
Income statistics for American Indian and Alaska Native residents
Median household income in South Valley, NM in 2022:
South Valley:
$43,117
State:
$43,317
Change in median household income between 2000 and 2022:
South Valley, New Mexico:
+32.7%
New Mexico:
+84.8%
Number of households with income < $10k:
South Valley:
3.8% (12)
State:
12.8% (7,750)
Number of households with income $10k - 20k:
South Valley:
18.0% (57)
New Mexico:
14.0% (8,481)
Number of households with income $20k - 30k:
South Valley:
11.4% (36)
New Mexico:
9.4% (5,714)
Number of households with income $30k - 40k:
South Valley:
9.8% (31)
State:
10.2% (6,190)
Number of households with income $40k - 50k:
South Valley:
11.0% (35)
New Mexico:
7.8% (4,765)
Number of households with income $50k - 60k:
South Valley:
12.6% (40)
State:
8.6% (5,205)
Number of households with income $60k - 75k:
South Valley:
13.9% (44)
State:
8.3% (5,073)
Number of households with income $75k - 100k:
South Valley:
18.0% (57)
New Mexico:
11.3% (6,847)
Number of households with income $100k - 125k:
South Valley:
1.6% (5)
State:
7.4% (4,504)
Number of households with income $125k - 150k:
South Valley:
0.0% (0)
State:
4.3% (2,588)
Number of households with income $150k - 200k:
South Valley:
0.0% (0)
State:
3.5% (2,146)
Number of households with income > $200k:
South Valley:
0.0% (0)
New Mexico:
2.5% (1,505)
Aggregate household income in South Valley in 2022: $16,386,524
Median family income in South Valley in 2022:
South Valley:
$47,689
State:
$49,129
Number of families with income $10k - 20k:
South Valley:
24.5% (65)
New Mexico:
11.6% (4,691)
Number of families with income $30k - 40k:
South Valley:
11.7% (31)
State:
10.8% (4,383)
Number of families with income $40k - 50k:
South Valley:
14.1% (37)
State:
8.3% (3,364)
Number of families with income $50k - 60k:
South Valley:
13.0% (34)
New Mexico:
10.8% (4,377)
Number of families with income $60k - 75k:
South Valley:
18.3% (48)
State:
9.4% (3,798)
Number of families with income $75k - 100k:
South Valley:
17.0% (45)
State:
9.0% (3,641)
Number of families with income $100k - 125k:
South Valley:
1.5% (4)
New Mexico:
7.4% (3,012)
Median non-family income in South Valley in 2022:
South Valley:
$22,916
State:
$27,367
Change in median non-family income between 2000 and 2022:: -0.9%
South Valley, New Mexico:
-0.9%
New Mexico:
+143.4%
Median per capita income in South Valley in 2022:
South Valley:
$14,442
State:
$20,119
Change in median per capita income between 2000 and 2022:
South Valley, New Mexico:
+17.6%
State:
+131.8%
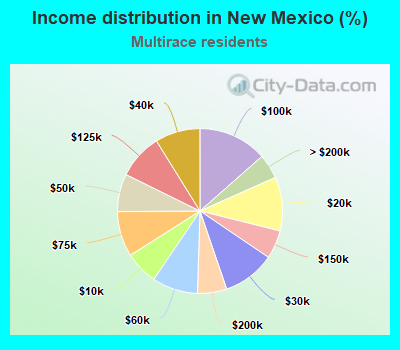
Income statistics for Multirace residents
Median household income in South Valley, NM in 2022:
South Valley:
$45,010
New Mexico:
$56,942
Change in median household income between 2000 and 2022:
South Valley, New Mexico:
+63.0%
New Mexico:
+94.8%
Number of households with income < $10k:
South Valley:
6.9% (326)
State:
6.5% (12,332)
Number of households with income $10k - 20k:
South Valley:
20.8% (975)
New Mexico:
10.6% (19,977)
Number of households with income $20k - 30k:
South Valley:
9.0% (424)
State:
10.3% (19,459)
Number of households with income $30k - 40k:
South Valley:
10.5% (493)
State:
8.8% (16,721)
Number of households with income $40k - 50k:
South Valley:
6.9% (323)
State:
7.4% (14,003)
Number of households with income $50k - 60k:
South Valley:
5.5% (258)
New Mexico:
9.0% (16,994)
Number of households with income $60k - 75k:
South Valley:
2.7% (127)
State:
8.9% (16,866)
Number of households with income $75k - 100k:
South Valley:
16.0% (750)
State:
13.5% (25,577)
Number of households with income $100k - 125k:
South Valley:
8.6% (406)
State:
8.9% (16,792)
Number of households with income $125k - 150k:
South Valley:
6.5% (303)
New Mexico:
5.6% (10,584)
Number of households with income $150k - 200k:
South Valley:
3.4% (159)
State:
5.7% (10,849)
Number of households with income > $200k:
South Valley:
3.2% (152)
State:
4.8% (9,158)
Aggregate household income in South Valley in 2022: $324,655,912
Median family income in South Valley in 2022:
South Valley:
$80,785
New Mexico:
$69,202
Number of families with income < $10k:
South Valley:
2.9% (87)
State:
4.1% (4,982)
Number of families with income $10k - 20k:
South Valley:
9.1% (277)
State:
6.3% (7,632)
Number of families with income $20k - 30k:
South Valley:
8.9% (271)
State:
8.5% (10,234)
Number of families with income $30k - 40k:
South Valley:
9.8% (299)
State:
6.8% (8,199)
Number of families with income $40k - 50k:
South Valley:
5.0% (151)
State:
8.3% (10,022)
Number of families with income $50k - 60k:
South Valley:
7.4% (224)
State:
9.1% (10,898)
Number of families with income $60k - 75k:
South Valley:
3.3% (99)
State:
9.8% (11,800)
Number of families with income $75k - 100k:
South Valley:
20.2% (613)
State:
16.2% (19,484)
Number of families with income $100k - 125k:
South Valley:
15.9% (485)
New Mexico:
10.5% (12,660)
Number of families with income $125k - 150k:
South Valley:
8.5% (259)
State:
6.9% (8,295)
Number of families with income $150k - 200k:
South Valley:
4.1% (124)
State:
7.0% (8,391)
Number of families with income > $200k:
South Valley:
5.0% (153)
New Mexico:
6.4% (7,749)
Median non-family income in South Valley in 2022:
South Valley:
$18,563
State:
$31,862
Change in median non-family income between 2000 and 2022:
South Valley, New Mexico:
+4.8%
State:
+72.1%
Median per capita income in South Valley in 2022:
South Valley:
$28,480
State:
$28,327
Income statistics for other residents
Median household income in South Valley, NM in 2022:
South Valley:
$52,464
State:
$46,171
Number of households with income < $10k:
South Valley:
4.9% (194)
State:
8.9% (10,041)
Number of households with income $10k - 20k:
South Valley:
10.3% (407)
State:
11.6% (13,195)
Number of households with income $20k - 30k:
South Valley:
13.0% (512)
New Mexico:
10.7% (12,163)
Number of households with income $30k - 40k:
South Valley:
9.3% (368)
New Mexico:
11.4% (12,903)
Number of households with income $40k - 50k:
South Valley:
13.9% (548)
State:
10.3% (11,698)
Number of households with income $50k - 60k:
South Valley:
4.3% (168)
State:
6.8% (7,753)
Number of households with income $60k - 75k:
South Valley:
7.4% (293)
New Mexico:
8.4% (9,473)
Number of households with income $75k - 100k:
South Valley:
21.0% (829)
New Mexico:
13.7% (15,509)
Number of households with income $100k - 125k:
South Valley:
7.9% (314)
State:
6.6% (7,461)
Number of households with income $125k - 150k:
South Valley:
5.4% (214)
State:
5.3% (6,039)
Number of households with income $150k - 200k:
South Valley:
1.1% (42)
State:
3.9% (4,404)
Number of households with income > $200k:
South Valley:
1.6% (63)
State:
2.4% (2,687)
Aggregate household income in South Valley in 2022: $226,573,882
Median family income in South Valley in 2022:
South Valley:
$55,263
State:
$56,709
Number of families with income < $10k:
South Valley:
3.8% (111)
State:
5.8% (4,399)
Number of families with income $10k - 20k:
South Valley:
8.3% (246)
State:
8.1% (6,127)
Number of families with income $20k - 30k:
South Valley:
8.4% (248)
State:
9.6% (7,269)
Number of families with income $30k - 40k:
South Valley:
6.7% (197)
New Mexico:
10.8% (8,195)
Number of families with income $40k - 50k:
South Valley:
14.7% (433)
State:
11.6% (8,800)
Number of families with income $50k - 60k:
South Valley:
7.1% (211)
State:
7.1% (5,371)
Number of families with income $60k - 75k:
South Valley:
14.1% (415)
State:
9.4% (7,169)
Number of families with income $75k - 100k:
South Valley:
20.8% (612)
New Mexico:
14.7% (11,181)
Number of families with income $100k - 125k:
South Valley:
6.2% (182)
State:
8.8% (6,703)
Number of families with income $125k - 150k:
South Valley:
6.9% (203)
State:
6.6% (5,011)
Number of families with income $150k - 200k:
South Valley:
1.4% (41)
New Mexico:
4.4% (3,356)
Number of families with income > $200k:
South Valley:
1.7% (50)
New Mexico:
3.1% (2,336)
Median non-family income in South Valley in 2022:
South Valley:
$26,181
State:
$30,209
Change in median non-family income between 2000 and 2022:
South Valley, New Mexico:
+88.2%
New Mexico:
+84.1%
Median per capita income in South Valley in 2022:
South Valley:
$19,867
State:
$23,871
Change in median per capita income between 2000 and 2022:
South Valley, New Mexico:
+89.6%
New Mexico:
+110.4%
Discuss South Valley, New Mexico (NM) on our hugely popular New Mexico forum.