Southwest Grayson, Texas (TX) income map, earnings map, and wages data
The median household income in Southwest Grayson, TX in 2022 was $83,670, which was 13.6% greater than the median annual income of $72,284 across the entire state of Texas. Compared to the median income of $47,056 in 2000 this represents an increase of 43.8%. The per capita income in 2022 was $37,774, which means an increase of 48.9% compared to 2000 when it was $19,301.
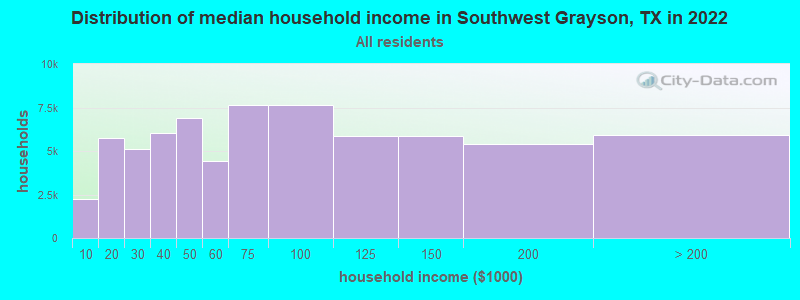
Income statistics for all residents
Median household income in Southwest Grayson, TX in 2022:| Southwest Grayson: | $83,670 |
| Texas: | $72,284 |
Change in median household income between 2000 and 2022:| Southwest Grayson, Texas: | +77.8% |
| Texas: | +81.0% |
Number of households with income < $10k:| Southwest Grayson: | 3.2% (2,219) |
| Texas: | 5.5% (611,011) |
Number of households with income $10k - 20k:| Southwest Grayson: | 8.3% (5,738) |
| State: | 6.7% (743,157) |
Number of households with income $20k - 30k:| Southwest Grayson: | 7.4% (5,106) |
| State: | 7.2% (803,381) |
Number of households with income $30k - 40k:| Southwest Grayson: | 8.8% (6,055) |
| Texas: | 7.8% (866,080) |
Number of households with income $40k - 50k:| Southwest Grayson: | 10.0% (6,884) |
| Texas: | 7.3% (810,440) |
Number of households with income $50k - 60k:| Southwest Grayson: | 6.4% (4,429) |
| Texas: | 7.2% (799,783) |
Number of households with income $60k - 75k:| Southwest Grayson: | 11.1% (7,645) |
| State: | 9.9% (1,095,384) |
Number of households with income $75k - 100k:| Southwest Grayson: | 11.1% (7,630) |
| State: | 12.8% (1,419,057) |
Number of households with income $100k - 125k:| Southwest Grayson: | 8.5% (5,839) |
| Texas: | 9.5% (1,054,577) |
Number of households with income $125k - 150k:| Southwest Grayson: | 8.6% (5,879) |
| Texas: | 6.7% (741,518) |
Number of households with income $150k - 200k:| Southwest Grayson: | 7.8% (5,383) |
| State: | 8.7% (961,776) |
Number of households with income > $200k:| Southwest Grayson: | 8.6% (5,932) |
| State: | 10.7% (1,181,544) |
Aggregate household income in Southwest Grayson in 2022: $359,421,720
Median family income in Southwest Grayson in 2022:| Southwest Grayson: | $103,073 |
| State: | $86,267 |
Median non-family income in Southwest Grayson in 2022:| Southwest Grayson: | $43,317 |
| State: | $45,999 |
Change in median non-family income between 2000 and 2022:| Southwest Grayson, Texas: | +93.8% |
| State: | +79.5% |
Median per capita income in Southwest Grayson in 2022:| Southwest Grayson: | $37,774 |
| Texas: | $38,123 |
Change in median per capita income between 2000 and 2022:| Southwest Grayson, Texas: | +95.7% |
| State: | +94.3% |
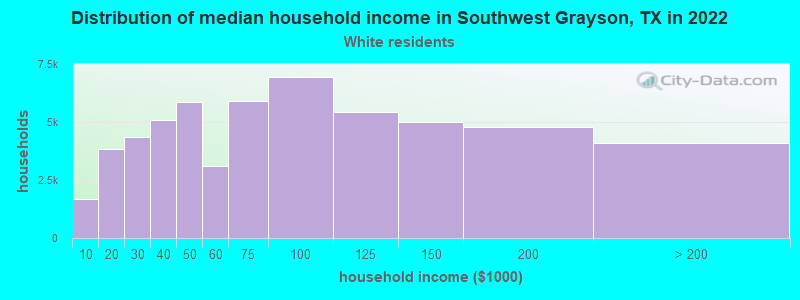
Income statistics for White residents
Median household income in Southwest Grayson, TX in 2022:| Southwest Grayson: | $85,832 |
| Texas: | $82,032 |
Change in median household income between 2000 and 2022:| Southwest Grayson, Texas: | +79.8% |
| State: | +91.0% |
Number of households with income < $10k:| Southwest Grayson: | 3.0% (1,670) |
| State: | 4.7% (273,716) |
Number of households with income $10k - 20k:| Southwest Grayson: | 6.8% (3,819) |
| Texas: | 5.5% (322,702) |
Number of households with income $20k - 30k:| Southwest Grayson: | 7.8% (4,368) |
| State: | 6.2% (363,947) |
Number of households with income $30k - 40k:| Southwest Grayson: | 9.0% (5,068) |
| State: | 6.8% (399,275) |
Number of households with income $40k - 50k:| Southwest Grayson: | 10.5% (5,878) |
| State: | 6.5% (383,417) |
Number of households with income $50k - 60k:| Southwest Grayson: | 5.6% (3,124) |
| State: | 6.6% (388,535) |
Number of households with income $60k - 75k:| Southwest Grayson: | 10.5% (5,906) |
| State: | 9.7% (566,295) |
Number of households with income $75k - 100k:| Southwest Grayson: | 12.4% (6,952) |
| State: | 13.0% (760,276) |
Number of households with income $100k - 125k:| Southwest Grayson: | 9.7% (5,427) |
| State: | 10.2% (597,596) |
Number of households with income $125k - 150k:| Southwest Grayson: | 8.9% (5,016) |
| Texas: | 7.4% (436,830) |
Number of households with income $150k - 200k:| Southwest Grayson: | 8.5% (4,792) |
| State: | 9.9% (583,067) |
Number of households with income > $200k:| Southwest Grayson: | 7.3% (4,110) |
| Texas: | 13.5% (792,647) |
Aggregate household income in Southwest Grayson in 2022: $302,454,269
Median family income in Southwest Grayson in 2022:| Southwest Grayson: | $107,258 |
| Texas: | $101,788 |
Number of families with income < $10k:| Southwest Grayson: | 0.7% (16) |
| State: | 2.8% (108,142) |
Number of families with income $10k - 20k:| Southwest Grayson: | 2.3% (57) |
| State: | 2.9% (113,421) |
Number of families with income $20k - 30k:| Southwest Grayson: | 3.5% (88) |
| State: | 4.1% (157,688) |
Number of families with income $30k - 40k:| Southwest Grayson: | 5.0% (124) |
| State: | 5.2% (198,847) |
Number of families with income $40k - 50k:| Southwest Grayson: | 7.7% (191) |
| State: | 5.6% (216,490) |
Number of families with income $50k - 60k:| Southwest Grayson: | 4.0% (99) |
| Texas: | 5.7% (220,689) |
Number of families with income $60k - 75k:| Southwest Grayson: | 12.0% (299) |
| State: | 9.0% (346,106) |
Number of families with income $75k - 100k:| Southwest Grayson: | 19.8% (493) |
| State: | 13.7% (527,363) |
Number of families with income $100k - 125k:| Southwest Grayson: | 10.4% (259) |
| State: | 11.6% (448,411) |
Number of families with income $125k - 150k:| Southwest Grayson: | 13.6% (338) |
| State: | 9.2% (355,798) |
Number of families with income $150k - 200k:| Southwest Grayson: | 13.3% (331) |
| State: | 12.5% (480,185) |
Number of families with income > $200k:| Southwest Grayson: | 7.7% (191) |
| State: | 17.6% (677,490) |
Median non-family income in Southwest Grayson in 2022:| Southwest Grayson: | $44,596 |
| Texas: | $50,587 |
Change in median non-family income between 2000 and 2022:| Southwest Grayson, Texas: | +99.6% |
| State: | +87.7% |
Median per capita income in Southwest Grayson in 2022:| Southwest Grayson: | $38,187 |
| State: | $47,740 |
Change in median per capita income between 2000 and 2022:| Southwest Grayson, Texas: | +91.1% |
| State: | +114.3% |
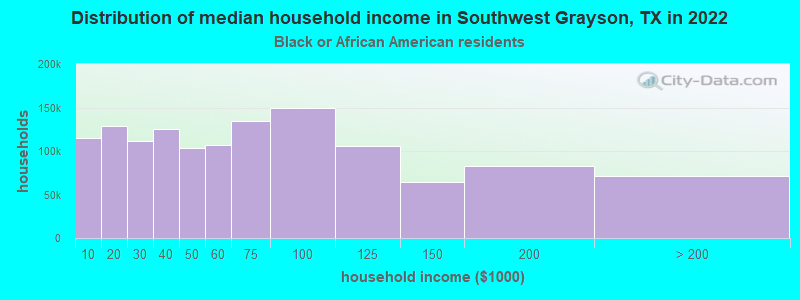
Income statistics for Black or African American residents
Median household income in Southwest Grayson, TX in 2022:| Southwest Grayson: | $107,460 |
| State: | $55,759 |
Change in median household income between 2000 and 2022:| Southwest Grayson, Texas: | +99.9% |
| State: | +90.3% |
Number of households with income < $10k:| Southwest Grayson: | 8.9% (115,474) |
| State: | 8.9% (126,378) |
Number of households with income $10k - 20k:| Southwest Grayson: | 9.9% (129,099) |
| State: | 9.9% (140,369) |
Number of households with income $20k - 30k:| Southwest Grayson: | 8.5% (111,070) |
| State: | 8.5% (120,639) |
Number of households with income $30k - 40k:| Southwest Grayson: | 9.7% (125,577) |
| State: | 9.7% (137,517) |
Number of households with income $40k - 50k:| Southwest Grayson: | 7.9% (103,164) |
| Texas: | 8.0% (112,973) |
Number of households with income $50k - 60k:| Southwest Grayson: | 8.2% (106,897) |
| State: | 8.3% (117,156) |
Number of households with income $60k - 75k:| Southwest Grayson: | 10.4% (134,942) |
| State: | 10.4% (147,462) |
Number of households with income $75k - 100k:| Southwest Grayson: | 11.5% (148,998) |
| State: | 11.5% (162,718) |
Number of households with income $100k - 125k:| Southwest Grayson: | 8.1% (105,790) |
| State: | 8.2% (115,829) |
Number of households with income $125k - 150k:| Southwest Grayson: | 4.9% (64,106) |
| Texas: | 4.9% (69,556) |
Number of households with income $150k - 200k:| Southwest Grayson: | 6.4% (83,029) |
| State: | 6.4% (90,701) |
Number of households with income > $200k:| Southwest Grayson: | 5.5% (71,332) |
| Texas: | 5.5% (77,988) |
Aggregate household income in Southwest Grayson in 2022: $285,962
Median family income in Southwest Grayson in 2022:| Southwest Grayson: | $111,293 |
| State: | $69,134 |
Median per capita income in Southwest Grayson in 2022:| Southwest Grayson: | $35,827 |
| Texas: | $30,490 |
Change in median per capita income between 2000 and 2022:| Southwest Grayson, Texas: | +108.2% |
| State: | +113.9% |
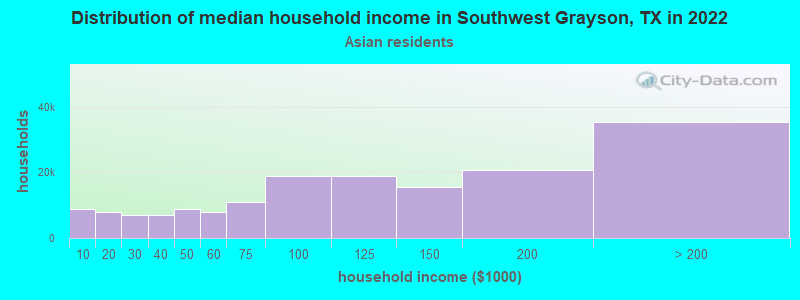
Income statistics for Asian residents
Median household income in Southwest Grayson, TX in 2022:| Southwest Grayson: | $22,882 |
| State: | $107,673 |
Number of households with income < $10k:| Southwest Grayson: | 5.3% (8,782) |
| State: | 5.2% (29,885) |
Number of households with income $10k - 20k:| Southwest Grayson: | 4.8% (7,946) |
| State: | 4.7% (27,044) |
Number of households with income $20k - 30k:| Southwest Grayson: | 4.1% (6,848) |
| State: | 4.1% (23,363) |
Number of households with income $30k - 40k:| Southwest Grayson: | 4.1% (6,846) |
| Texas: | 4.1% (23,309) |
Number of households with income $40k - 50k:| Southwest Grayson: | 5.2% (8,752) |
| State: | 5.2% (29,826) |
Number of households with income $50k - 60k:| Southwest Grayson: | 4.6% (7,763) |
| Texas: | 4.7% (26,512) |
Number of households with income $60k - 75k:| Southwest Grayson: | 6.5% (10,843) |
| Texas: | 6.5% (36,905) |
Number of households with income $75k - 100k:| Southwest Grayson: | 11.3% (18,854) |
| State: | 11.3% (64,350) |
Number of households with income $100k - 125k:| Southwest Grayson: | 11.3% (18,975) |
| Texas: | 11.4% (64,714) |
Number of households with income $125k - 150k:| Southwest Grayson: | 9.3% (15,469) |
| State: | 9.3% (52,719) |
Number of households with income $150k - 200k:| Southwest Grayson: | 12.5% (20,823) |
| State: | 12.5% (70,953) |
Number of households with income > $200k:| Southwest Grayson: | 21.1% (35,291) |
| State: | 21.1% (120,260) |
Aggregate household income in Southwest Grayson in 2022: $874,169
Median family income in Southwest Grayson in 2022:| Southwest Grayson: | $21,293 |
| Texas: | $123,328 |
Median per capita income in Southwest Grayson in 2022:| Southwest Grayson: | $10,911 |
| Texas: | $48,626 |
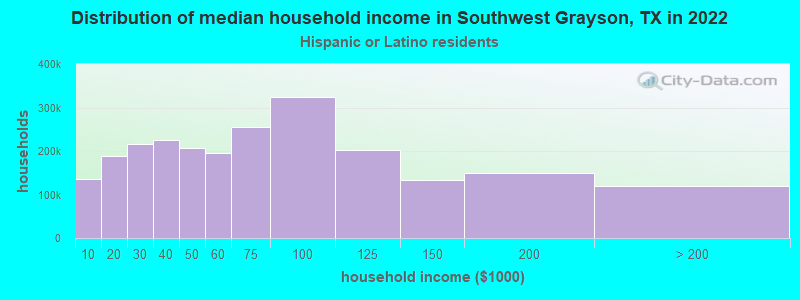
Income statistics for Hispanic or Latino residents
Median household income in Southwest Grayson, TX in 2022:| Southwest Grayson: | $72,774 |
| Texas: | $60,504 |
Change in median household income between 2000 and 2022:| Southwest Grayson, Texas: | +92.8% |
| State: | +102.5% |
Number of households with income < $10k:| Southwest Grayson: | 5.8% (135,334) |
| State: | 5.8% (213,953) |
Number of households with income $10k - 20k:| Southwest Grayson: | 8.0% (188,218) |
| State: | 8.0% (297,456) |
Number of households with income $20k - 30k:| Southwest Grayson: | 9.2% (215,051) |
| State: | 9.2% (340,166) |
Number of households with income $30k - 40k:| Southwest Grayson: | 9.5% (224,213) |
| State: | 9.5% (354,336) |
Number of households with income $40k - 50k:| Southwest Grayson: | 8.8% (206,784) |
| Texas: | 8.8% (327,013) |
Number of households with income $50k - 60k:| Southwest Grayson: | 8.3% (195,163) |
| Texas: | 8.3% (308,818) |
Number of households with income $60k - 75k:| Southwest Grayson: | 10.9% (256,242) |
| Texas: | 10.9% (405,109) |
Number of households with income $75k - 100k:| Southwest Grayson: | 13.8% (323,768) |
| Texas: | 13.8% (511,639) |
Number of households with income $100k - 125k:| Southwest Grayson: | 8.6% (202,340) |
| Texas: | 8.6% (319,728) |
Number of households with income $125k - 150k:| Southwest Grayson: | 5.7% (133,603) |
| State: | 5.7% (210,932) |
Number of households with income $150k - 200k:| Southwest Grayson: | 6.4% (149,210) |
| Texas: | 6.4% (236,055) |
Number of households with income > $200k:| Southwest Grayson: | 5.1% (119,795) |
| State: | 5.1% (189,259) |
Aggregate household income in Southwest Grayson in 2022: $62,873,598
Median family income in Southwest Grayson in 2022:| Southwest Grayson: | $73,629 |
| Texas: | $65,080 |
Number of families with income < $10k:| Southwest Grayson: | 5.6% (77) |
| State: | 5.3% (147,493) |
Number of families with income $10k - 20k:| Southwest Grayson: | 7.2% (100) |
| State: | 6.3% (174,531) |
Number of families with income $20k - 30k:| Southwest Grayson: | 7.5% (105) |
| Texas: | 8.6% (238,528) |
Number of families with income $30k - 40k:| Southwest Grayson: | 9.5% (132) |
| State: | 9.1% (251,999) |
Number of families with income $40k - 50k:| Southwest Grayson: | 11.5% (160) |
| Texas: | 8.6% (240,188) |
Number of families with income $50k - 60k:| Southwest Grayson: | 9.8% (136) |
| State: | 8.0% (223,566) |
Number of families with income $60k - 75k:| Southwest Grayson: | 13.8% (191) |
| Texas: | 10.9% (302,688) |
Number of families with income $75k - 100k:| Southwest Grayson: | 18.0% (250) |
| State: | 14.3% (398,554) |
Number of families with income $100k - 125k:| Southwest Grayson: | 5.8% (80) |
| Texas: | 9.5% (264,007) |
Number of families with income $125k - 150k:| Southwest Grayson: | 4.2% (58) |
| State: | 6.2% (171,274) |
Number of families with income $150k - 200k:| Southwest Grayson: | 4.4% (62) |
| State: | 7.3% (202,259) |
Number of families with income > $200k:| Southwest Grayson: | 2.8% (39) |
| State: | 5.9% (165,129) |
Median non-family income in Southwest Grayson in 2022:| Southwest Grayson: | $56,124 |
| State: | $39,934 |
Change in median non-family income between 2000 and 2022:| Southwest Grayson, Texas: | +120.8% |
| State: | +109.1% |
Median per capita income in Southwest Grayson in 2022:| Southwest Grayson: | $29,558 |
| State: | $24,862 |
Change in median per capita income between 2000 and 2022:| Southwest Grayson, Texas: | +146.2% |
| State: | +130.8% |
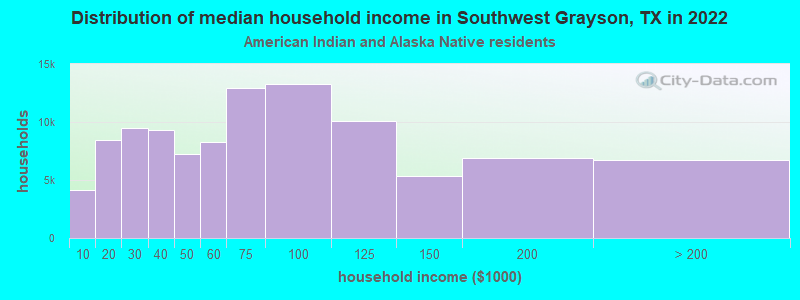
Income statistics for American Indian and Alaska Native residents
Median household income in Southwest Grayson, TX in 2022:| Southwest Grayson: | $131,947 |
| Texas: | $65,765 |
Change in median household income between 2000 and 2022:| Southwest Grayson, Texas: | +55.1% |
| State: | +88.3% |
Number of households with income < $10k:| Southwest Grayson: | 4.1% (4,147) |
| Texas: | 4.1% (3,398) |
Number of households with income $10k - 20k:| Southwest Grayson: | 8.3% (8,479) |
| State: | 8.3% (6,949) |
Number of households with income $20k - 30k:| Southwest Grayson: | 9.3% (9,448) |
| State: | 9.3% (7,742) |
Number of households with income $30k - 40k:| Southwest Grayson: | 9.1% (9,296) |
| Texas: | 9.1% (7,627) |
Number of households with income $40k - 50k:| Southwest Grayson: | 7.1% (7,233) |
| State: | 7.1% (5,922) |
Number of households with income $50k - 60k:| Southwest Grayson: | 8.1% (8,253) |
| State: | 8.1% (6,761) |
Number of households with income $60k - 75k:| Southwest Grayson: | 12.7% (12,915) |
| State: | 12.7% (10,588) |
Number of households with income $75k - 100k:| Southwest Grayson: | 13.0% (13,308) |
| Texas: | 13.0% (10,903) |
Number of households with income $100k - 125k:| Southwest Grayson: | 9.9% (10,076) |
| State: | 9.9% (8,256) |
Number of households with income $125k - 150k:| Southwest Grayson: | 5.2% (5,311) |
| Texas: | 5.2% (4,355) |
Number of households with income $150k - 200k:| Southwest Grayson: | 6.7% (6,855) |
| State: | 6.7% (5,623) |
Number of households with income > $200k:| Southwest Grayson: | 6.6% (6,730) |
| State: | 6.6% (5,522) |
Aggregate household income in Southwest Grayson in 2022: $786,359
Median family income in Southwest Grayson in 2022:| Southwest Grayson: | $170,516 |
| State: | $72,369 |
Number of families with income $60k - 75k:| Southwest Grayson: | 7.1% (3) |
| Texas: | 12.1% (7,429) |
Number of families with income $75k - 100k:| Southwest Grayson: | 92.9% (34) |
| State: | 14.4% (8,852) |
Median per capita income in Southwest Grayson in 2022:| Southwest Grayson: | $32,252 |
| State: | $28,166 |
Change in median per capita income between 2000 and 2022:| Southwest Grayson, Texas: | +95.5% |
| State: | +77.2% |
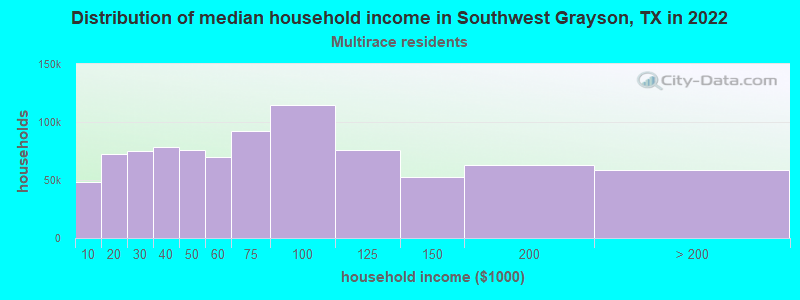
Income statistics for Multirace residents
Median household income in Southwest Grayson, TX in 2022:| Southwest Grayson: | $53,854 |
| Texas: | $62,748 |
Change in median household income between 2000 and 2022:| Southwest Grayson, Texas: | +108.5% |
| Texas: | +92.3% |
Number of households with income < $10k:| Southwest Grayson: | 5.5% (48,373) |
| State: | 5.5% (122,324) |
Number of households with income $10k - 20k:| Southwest Grayson: | 8.2% (72,065) |
| Texas: | 8.2% (182,232) |
Number of households with income $20k - 30k:| Southwest Grayson: | 8.5% (74,844) |
| Texas: | 8.5% (189,456) |
Number of households with income $30k - 40k:| Southwest Grayson: | 8.9% (78,081) |
| State: | 8.9% (197,499) |
Number of households with income $40k - 50k:| Southwest Grayson: | 8.7% (75,843) |
| State: | 8.7% (191,735) |
Number of households with income $50k - 60k:| Southwest Grayson: | 8.0% (70,148) |
| State: | 8.0% (177,535) |
Number of households with income $60k - 75k:| Southwest Grayson: | 10.5% (91,944) |
| State: | 10.5% (232,479) |
Number of households with income $75k - 100k:| Southwest Grayson: | 13.1% (114,832) |
| Texas: | 13.1% (290,448) |
Number of households with income $100k - 125k:| Southwest Grayson: | 8.7% (75,783) |
| Texas: | 8.6% (191,595) |
Number of households with income $125k - 150k:| Southwest Grayson: | 6.0% (52,785) |
| State: | 6.0% (133,361) |
Number of households with income $150k - 200k:| Southwest Grayson: | 7.2% (62,870) |
| State: | 7.2% (159,195) |
Number of households with income > $200k:| Southwest Grayson: | 6.7% (58,535) |
| State: | 6.7% (148,064) |
Aggregate household income in Southwest Grayson in 2022: $35,565,125
Median family income in Southwest Grayson in 2022:| Southwest Grayson: | $62,788 |
| State: | $69,780 |
Number of families with income < $10k:| Southwest Grayson: | 13.8% (48) |
| State: | 4.4% (70,825) |
Number of families with income $10k - 20k:| Southwest Grayson: | 5.1% (18) |
| State: | 5.9% (95,279) |
Number of families with income $20k - 30k:| Southwest Grayson: | 20.4% (70) |
| State: | 7.8% (126,627) |
Number of families with income $30k - 40k:| Southwest Grayson: | 10.5% (36) |
| State: | 8.5% (137,626) |
Number of families with income $40k - 50k:| Southwest Grayson: | 15.4% (53) |
| State: | 8.4% (135,809) |
Number of families with income $60k - 75k:| Southwest Grayson: | 10.1% (35) |
| State: | 10.5% (169,549) |
Number of families with income $75k - 100k:| Southwest Grayson: | 24.8% (85) |
| State: | 14.0% (226,284) |
Median non-family income in Southwest Grayson in 2022:| Southwest Grayson: | $32,594 |
| Texas: | $40,634 |
Change in median non-family income between 2000 and 2022:| Southwest Grayson, Texas: | +93.2% |
| State: | +77.2% |
Median per capita income in Southwest Grayson in 2022:| Southwest Grayson: | $35,823 |
| Texas: | $26,785 |
Income statistics for other residents
Number of households with income < $10k:| Southwest Grayson: | 5.8% (39) |
| State: | 5.9% (54,162) |
Number of households with income $10k - 20k:| Southwest Grayson: | 6.9% (46) |
| Texas: | 6.8% (62,891) |
Number of households with income $20k - 30k:| Southwest Grayson: | 10.6% (71) |
| Texas: | 10.6% (97,294) |
Number of households with income $30k - 40k:| Southwest Grayson: | 10.9% (73) |
| State: | 10.8% (99,670) |
Number of households with income $40k - 50k:| Southwest Grayson: | 9.4% (63) |
| State: | 9.3% (85,548) |
Number of households with income $50k - 60k:| Southwest Grayson: | 9.0% (60) |
| State: | 9.0% (82,757) |
Number of households with income $60k - 75k:| Southwest Grayson: | 10.9% (73) |
| State: | 10.9% (100,326) |
Number of households with income $75k - 100k:| Southwest Grayson: | 14.0% (94) |
| State: | 14.0% (128,767) |
Number of households with income $100k - 125k:| Southwest Grayson: | 8.2% (55) |
| State: | 8.2% (75,218) |
Number of households with income $125k - 150k:| Southwest Grayson: | 4.8% (32) |
| Texas: | 4.8% (44,223) |
Number of households with income $150k - 200k:| Southwest Grayson: | 5.5% (37) |
| Texas: | 5.6% (51,376) |
Number of households with income > $200k:| Southwest Grayson: | 4.0% (27) |
| State: | 4.0% (36,393) |
Aggregate household income in Southwest Grayson in 2022: $16,183,468
Median family income in Southwest Grayson in 2022:| Southwest Grayson: | $79,729 |
| Texas: | $60,064 |
Number of families with income < $10k:| Southwest Grayson: | 3.7% (7) |
| Texas: | 6.8% (47,502) |
Number of families with income $10k - 20k:| Southwest Grayson: | 1.5% (3) |
| State: | 6.0% (41,763) |
Number of families with income $20k - 30k:| Southwest Grayson: | 3.1% (6) |
| State: | 9.9% (68,761) |
Number of families with income $30k - 40k:| Southwest Grayson: | 4.5% (9) |
| Texas: | 9.7% (67,685) |
Number of families with income $40k - 50k:| Southwest Grayson: | 3.7% (7) |
| Texas: | 9.0% (62,441) |
Number of families with income $50k - 60k:| Southwest Grayson: | 4.9% (9) |
| State: | 8.5% (59,321) |
Number of families with income $75k - 100k:| Southwest Grayson: | 6.6% (13) |
| State: | 14.5% (101,032) |
Number of families with income $100k - 125k:| Southwest Grayson: | 7.3% (14) |
| State: | 8.8% (61,439) |
Number of families with income $125k - 150k:| Southwest Grayson: | 64.6% (123) |
| State: | 5.1% (35,727) |
Median per capita income in Southwest Grayson in 2022:| Southwest Grayson: | $24,305 |
| State: | $23,899 |
Change in median per capita income between 2000 and 2022:| Southwest Grayson, Texas: | +119.7% |
| State: | +135.2% |