West Valley, Washington (WA) income map, earnings map, and wages data
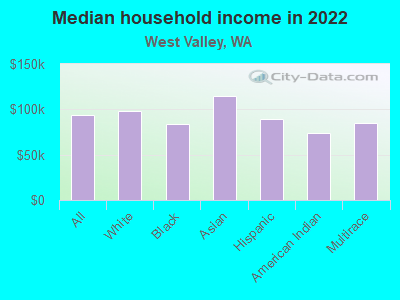
The median household income in West Valley, WA in 2022 was $93,888, which was 2.8% greater than the median annual income of $91,306 across the entire state of Washington. Compared to the median income of $51,201 in 2000 this represents an increase of 45.5%. The per capita income in 2022 was $46,393, which means an increase of 44.5% compared to 2000 when it was $25,765.
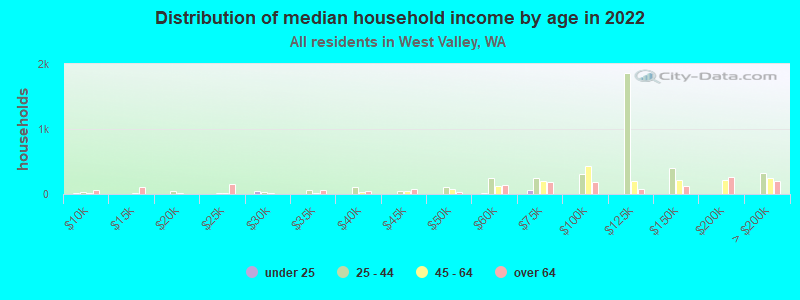
Income statistics for all residents
Median household income in West Valley, WA in 2022:| West Valley: | $93,889 |
| State: | $91,306 |
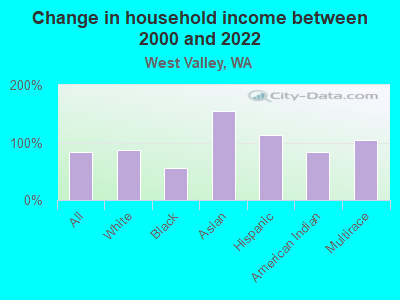
Change in median household income between 2000 and 2022:| West Valley, Washington: | +83.4% |
| State: | +99.5% |
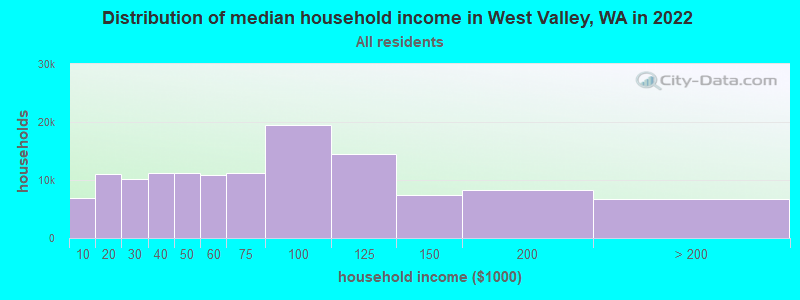
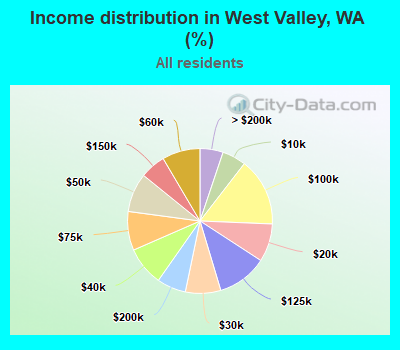
Number of households with income < $10k:| West Valley: | 5.3% (6,852) |
| State: | 4.5% (139,331) |
Number of households with income $10k - 20k:| West Valley: | 8.5% (10,961) |
| Washington: | 5.0% (154,508) |
Number of households with income $20k - 30k:| West Valley: | 7.9% (10,163) |
| State: | 5.4% (166,555) |
Number of households with income $30k - 40k:| West Valley: | 8.7% (11,213) |
| Washington: | 5.5% (170,324) |
Number of households with income $40k - 50k:| West Valley: | 8.7% (11,223) |
| State: | 6.0% (183,941) |
Number of households with income $50k - 60k:| West Valley: | 8.5% (10,907) |
| Washington: | 6.1% (187,395) |
Number of households with income $60k - 75k:| West Valley: | 8.7% (11,160) |
| Washington: | 8.7% (266,771) |
Number of households with income $75k - 100k:| West Valley: | 15.2% (19,550) |
| State: | 13.1% (404,672) |
Number of households with income $100k - 125k:| West Valley: | 11.2% (14,414) |
| State: | 11.0% (337,911) |
Number of households with income $125k - 150k:| West Valley: | 5.7% (7,340) |
| State: | 8.0% (244,934) |
Number of households with income $150k - 200k:| West Valley: | 6.5% (8,361) |
| State: | 10.5% (323,812) |
Number of households with income > $200k:| West Valley: | 5.2% (6,663) |
| State: | 16.2% (499,799) |
Aggregate household income in West Valley in 2022: $841,919,317
Median family income in West Valley in 2022:| West Valley: | $103,561 |
| State: | $109,192 |
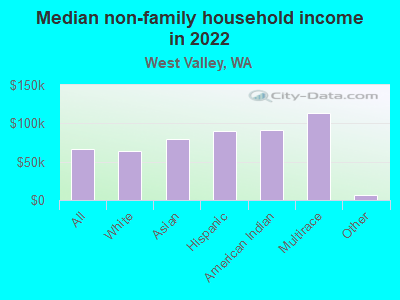
Median non-family income in West Valley in 2022:| West Valley: | $65,881 |
| Washington: | $57,299 |
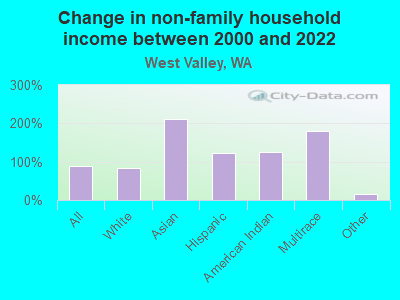
Change in median non-family income between 2000 and 2022:| West Valley, Washington: | +90.3% |
| State: | +94.9% |
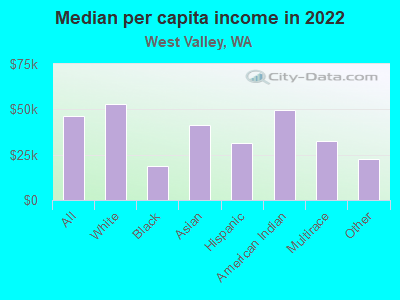
Median per capita income in West Valley in 2022:| West Valley: | $46,394 |
| State: | $50,764 |
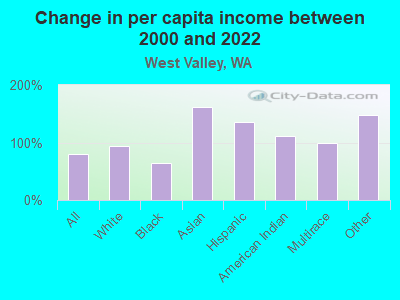
Change in median per capita income between 2000 and 2022:| West Valley, Washington: | +80.1% |
| State: | +121.0% |
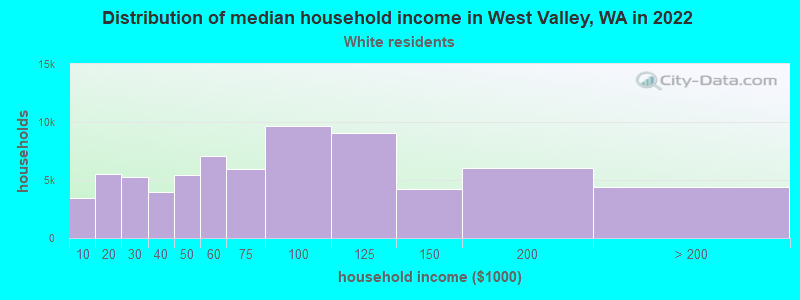
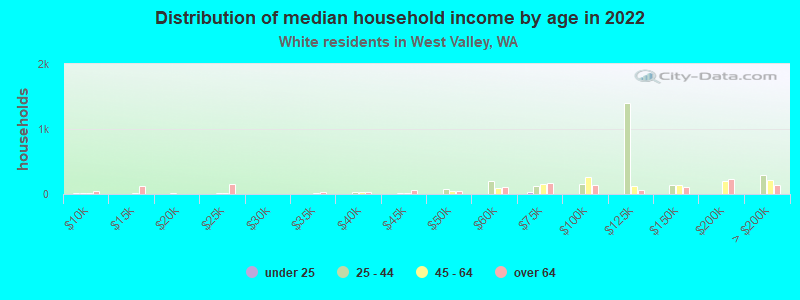
Income statistics for White residents
Median household income in West Valley, WA in 2022:| West Valley: | $98,408 |
| State: | $91,916 |
Change in median household income between 2000 and 2022:| West Valley, Washington: | +87.5% |
| Washington: | +95.4% |
Number of households with income < $10k:| West Valley: | 5.0% (3,486) |
| Washington: | 4.3% (95,850) |
Number of households with income $10k - 20k:| West Valley: | 7.9% (5,516) |
| State: | 4.8% (106,421) |
Number of households with income $20k - 30k:| West Valley: | 7.5% (5,259) |
| State: | 5.5% (122,860) |
Number of households with income $30k - 40k:| West Valley: | 5.7% (3,968) |
| Washington: | 5.4% (119,627) |
Number of households with income $40k - 50k:| West Valley: | 7.8% (5,433) |
| State: | 5.9% (132,276) |
Number of households with income $50k - 60k:| West Valley: | 10.1% (7,102) |
| State: | 6.1% (136,212) |
Number of households with income $60k - 75k:| West Valley: | 8.5% (5,926) |
| State: | 8.8% (196,086) |
Number of households with income $75k - 100k:| West Valley: | 13.8% (9,639) |
| Washington: | 13.4% (299,192) |
Number of households with income $100k - 125k:| West Valley: | 12.9% (9,044) |
| State: | 11.3% (252,209) |
Number of households with income $125k - 150k:| West Valley: | 6.0% (4,203) |
| State: | 7.9% (175,962) |
Number of households with income $150k - 200k:| West Valley: | 8.6% (5,995) |
| Washington: | 10.7% (239,156) |
Number of households with income > $200k:| West Valley: | 6.3% (4,427) |
| State: | 16.1% (359,917) |
Aggregate household income in West Valley in 2022: $498,261,571
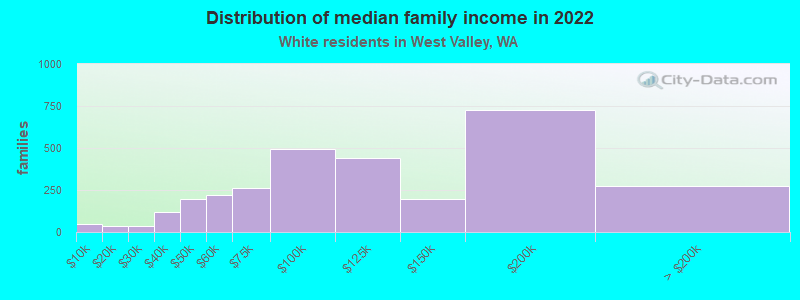
Median family income in West Valley in 2022:| West Valley: | $110,517 |
| State: | $112,511 |
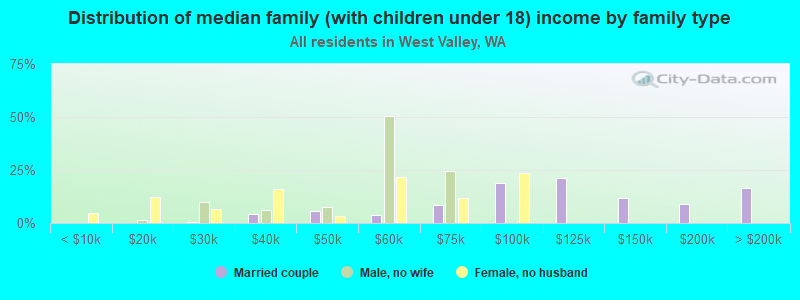
Number of families with income < $10k:| West Valley: | 1.5% (45) |
| Washington: | 2.4% (33,676) |
Number of families with income $10k - 20k:| West Valley: | 1.1% (34) |
| State: | 2.0% (28,228) |
Number of families with income $20k - 30k:| West Valley: | 1.2% (35) |
| State: | 2.9% (39,288) |
Number of families with income $30k - 40k:| West Valley: | 3.9% (119) |
| Washington: | 3.6% (50,190) |
Number of families with income $40k - 50k:| West Valley: | 6.4% (194) |
| State: | 4.6% (63,009) |
Number of families with income $50k - 60k:| West Valley: | 7.2% (219) |
| Washington: | 5.0% (69,270) |
Number of families with income $60k - 75k:| West Valley: | 8.5% (259) |
| State: | 8.2% (112,369) |
Number of families with income $75k - 100k:| West Valley: | 16.4% (497) |
| State: | 14.1% (194,214) |
Number of families with income $100k - 125k:| West Valley: | 14.5% (441) |
| State: | 13.2% (182,184) |
Number of families with income $125k - 150k:| West Valley: | 6.4% (195) |
| Washington: | 9.5% (130,928) |
Number of families with income $150k - 200k:| West Valley: | 23.9% (727) |
| Washington: | 13.7% (188,621) |
Number of families with income > $200k:| West Valley: | 9.0% (274) |
| State: | 20.8% (285,982) |
Median non-family income in West Valley in 2022:| West Valley: | $63,975 |
| State: | $56,103 |
Change in median non-family income between 2000 and 2022:| West Valley, Washington: | +83.0% |
| Washington: | +87.7% |
Median per capita income in West Valley in 2022:| West Valley: | $52,720 |
| Washington: | $55,212 |
Change in median per capita income between 2000 and 2022:| West Valley, Washington: | +93.7% |
| State: | +123.8% |
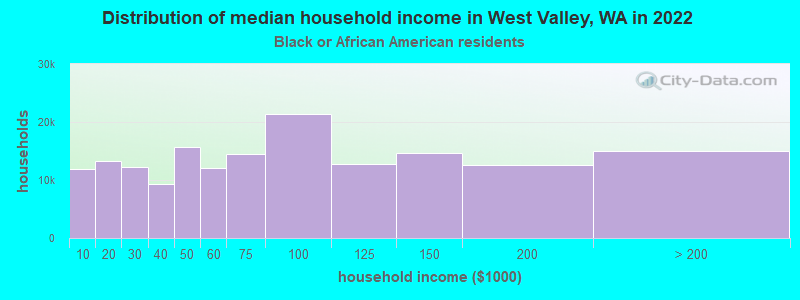
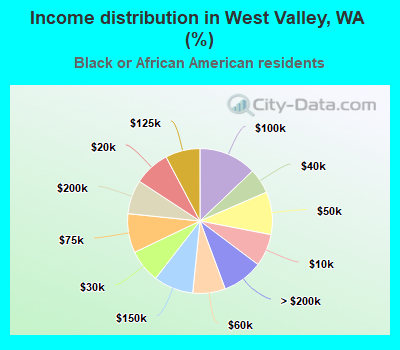
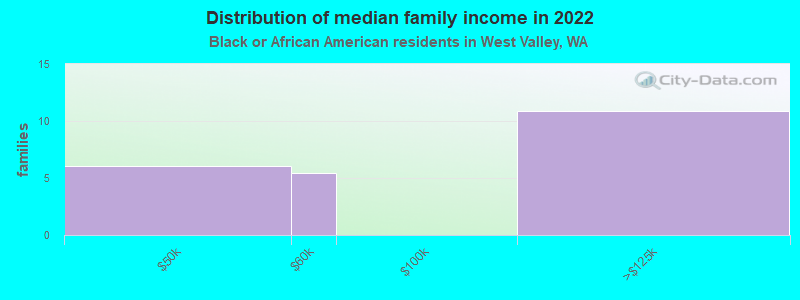
Income statistics for Black or African American residents
Median household income in West Valley, WA in 2022:| West Valley: | $83,443 |
| Washington: | $68,202 |
Change in median household income between 2000 and 2022:| West Valley, Washington: | +56.0% |
| Washington: | +89.9% |
Number of households with income < $10k:| West Valley: | 7.2% (11,937) |
| State: | 7.2% (8,014) |
Number of households with income $10k - 20k:| West Valley: | 8.0% (13,262) |
| State: | 8.0% (8,904) |
Number of households with income $20k - 30k:| West Valley: | 7.4% (12,224) |
| Washington: | 7.4% (8,207) |
Number of households with income $30k - 40k:| West Valley: | 5.6% (9,264) |
| State: | 5.6% (6,220) |
Number of households with income $40k - 50k:| West Valley: | 9.5% (15,766) |
| State: | 9.5% (10,585) |
Number of households with income $50k - 60k:| West Valley: | 7.3% (12,032) |
| State: | 7.3% (8,078) |
Number of households with income $60k - 75k:| West Valley: | 8.7% (14,454) |
| Washington: | 8.7% (9,704) |
Number of households with income $75k - 100k:| West Valley: | 12.9% (21,322) |
| State: | 12.9% (14,315) |
Number of households with income $100k - 125k:| West Valley: | 7.7% (12,797) |
| State: | 7.7% (8,592) |
Number of households with income $125k - 150k:| West Valley: | 8.9% (14,656) |
| State: | 8.9% (9,840) |
Number of households with income $150k - 200k:| West Valley: | 7.6% (12,562) |
| State: | 7.6% (8,434) |
Number of households with income > $200k:| West Valley: | 9.1% (15,006) |
| State: | 9.1% (10,075) |
Aggregate household income in West Valley in 2022: $3,119,632
Median family income in West Valley in 2022:| West Valley: | $108,493 |
| State: | $82,165 |
Number of families with income $40k - 50k:| West Valley: | 27.2% (6) |
| Washington: | 6.8% (4,558) |
Number of families with income $50k - 60k:| West Valley: | 24.3% (5) |
| State: | 7.0% (4,687) |
Number of families with income $100k - 125k:| West Valley: | 48.5% (11) |
| Washington: | 9.0% (6,018) |
Median per capita income in West Valley in 2022:| West Valley: | $18,937 |
| Washington: | $38,209 |
Change in median per capita income between 2000 and 2022:| West Valley, Washington: | +65.0% |
| State: | +115.3% |
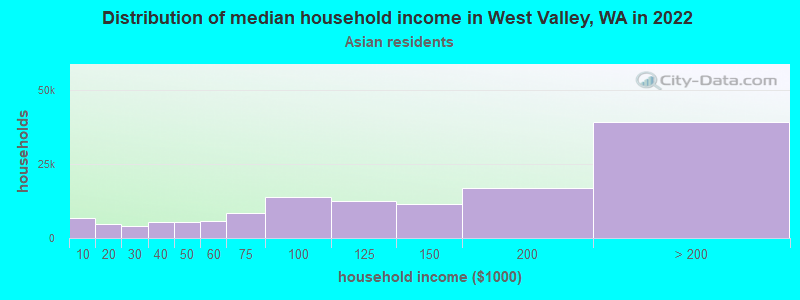
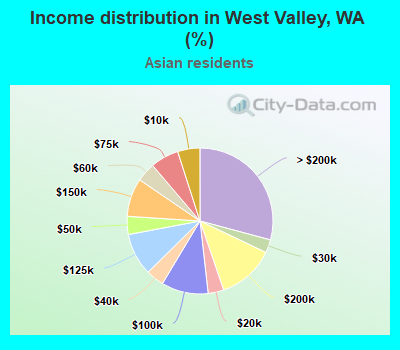
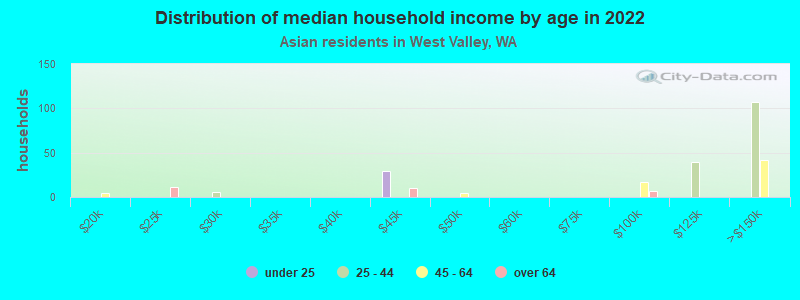
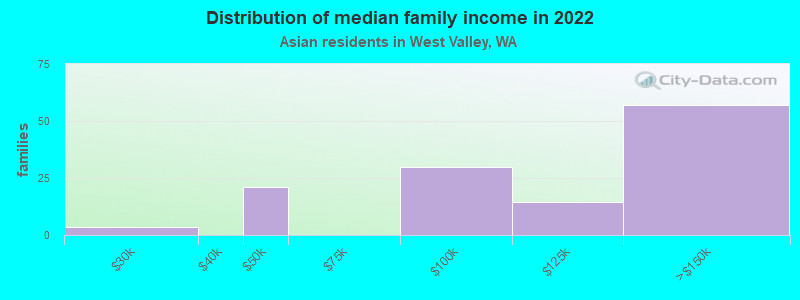
Income statistics for Asian residents
Median household income in West Valley, WA in 2022:| West Valley: | $114,346 |
| State: | $125,692 |
Number of households with income < $10k:| West Valley: | 4.9% (6,632) |
| Washington: | 4.9% (14,099) |
Number of households with income $10k - 20k:| West Valley: | 3.5% (4,655) |
| State: | 3.5% (9,873) |
Number of households with income $20k - 30k:| West Valley: | 2.9% (3,926) |
| State: | 2.9% (8,352) |
Number of households with income $30k - 40k:| West Valley: | 4.0% (5,378) |
| State: | 4.0% (11,415) |
Number of households with income $40k - 50k:| West Valley: | 4.0% (5,383) |
| State: | 4.0% (11,421) |
Number of households with income $50k - 60k:| West Valley: | 4.2% (5,702) |
| State: | 4.2% (12,100) |
Number of households with income $60k - 75k:| West Valley: | 6.3% (8,433) |
| State: | 6.3% (17,903) |
Number of households with income $75k - 100k:| West Valley: | 10.4% (13,971) |
| State: | 10.4% (29,663) |
Number of households with income $100k - 125k:| West Valley: | 9.4% (12,642) |
| State: | 9.4% (26,839) |
Number of households with income $125k - 150k:| West Valley: | 8.5% (11,399) |
| Washington: | 8.5% (24,200) |
Number of households with income $150k - 200k:| West Valley: | 12.6% (16,979) |
| State: | 12.6% (35,976) |
Number of households with income > $200k:| West Valley: | 29.2% (39,181) |
| State: | 29.2% (83,109) |
Aggregate household income in West Valley in 2022: $15,686,097
Median family income in West Valley in 2022:| West Valley: | $103,311 |
| State: | $143,595 |
Number of families with income $20k - 30k:| West Valley: | 2.8% (4) |
| State: | 1.9% (3,558) |
Number of families with income $40k - 50k:| West Valley: | 16.8% (21) |
| State: | 3.6% (6,707) |
Number of families with income $75k - 100k:| West Valley: | 23.6% (30) |
| Washington: | 11.7% (21,919) |
Number of families with income $100k - 125k:| West Valley: | 11.5% (15) |
| Washington: | 9.3% (17,280) |
Number of families with income $125k - 150k:| West Valley: | 45.3% (57) |
| State: | 8.4% (15,602) |
Median non-family income in West Valley in 2022:| West Valley: | $79,431 |
| State: | $84,971 |
Median per capita income in West Valley in 2022:| West Valley: | $41,247 |
| State: | $67,666 |
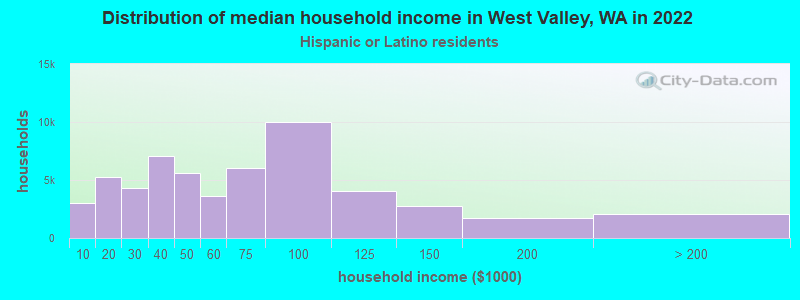
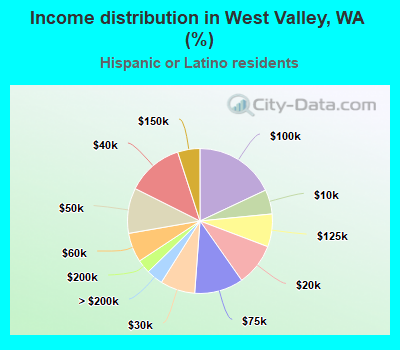
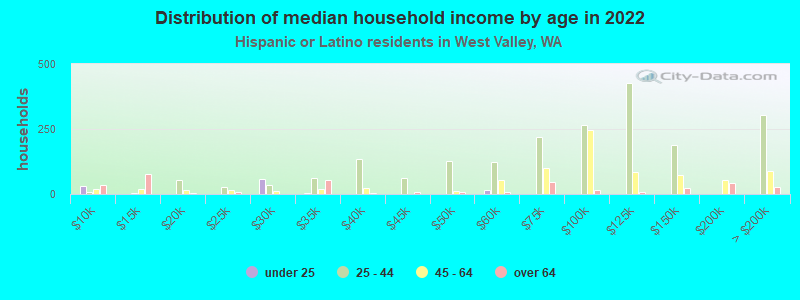
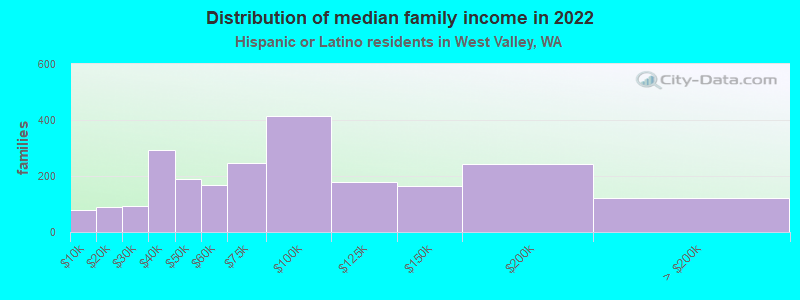
Income statistics for Hispanic or Latino residents
Median household income in West Valley, WA in 2022:| West Valley: | $89,219 |
| State: | $74,770 |
Change in median household income between 2000 and 2022:| West Valley, Washington: | +113.4% |
| State: | +128.3% |
Number of households with income < $10k:| West Valley: | 5.4% (3,031) |
| State: | 4.9% (14,456) |
Number of households with income $10k - 20k:| West Valley: | 9.5% (5,275) |
| State: | 5.3% (15,449) |
Number of households with income $20k - 30k:| West Valley: | 7.8% (4,325) |
| Washington: | 6.8% (20,016) |
Number of households with income $30k - 40k:| West Valley: | 12.6% (7,032) |
| State: | 7.7% (22,548) |
Number of households with income $40k - 50k:| West Valley: | 10.1% (5,627) |
| Washington: | 7.3% (21,450) |
Number of households with income $50k - 60k:| West Valley: | 6.6% (3,653) |
| State: | 7.7% (22,744) |
Number of households with income $60k - 75k:| West Valley: | 10.9% (6,073) |
| State: | 10.5% (30,737) |
Number of households with income $75k - 100k:| West Valley: | 18.0% (10,016) |
| Washington: | 14.9% (43,843) |
Number of households with income $100k - 125k:| West Valley: | 7.3% (4,075) |
| State: | 11.1% (32,554) |
Number of households with income $125k - 150k:| West Valley: | 5.0% (2,764) |
| State: | 7.4% (21,624) |
Number of households with income $150k - 200k:| West Valley: | 3.1% (1,697) |
| State: | 7.3% (21,360) |
Number of households with income > $200k:| West Valley: | 3.7% (2,060) |
| Washington: | 9.2% (27,055) |
Aggregate household income in West Valley in 2022: $32,916,926
Median family income in West Valley in 2022:| West Valley: | $88,633 |
| State: | $76,866 |
Number of families with income < $10k:| West Valley: | 3.4% (77) |
| State: | 4.4% (9,443) |
Number of families with income $10k - 20k:| West Valley: | 3.9% (88) |
| State: | 3.5% (7,524) |
Number of families with income $20k - 30k:| West Valley: | 4.1% (92) |
| State: | 5.6% (12,052) |
Number of families with income $30k - 40k:| West Valley: | 12.8% (292) |
| State: | 8.3% (17,803) |
Number of families with income $40k - 50k:| West Valley: | 8.4% (190) |
| State: | 7.7% (16,361) |
Number of families with income $50k - 60k:| West Valley: | 7.4% (169) |
| State: | 7.9% (16,852) |
Number of families with income $60k - 75k:| West Valley: | 10.8% (247) |
| State: | 11.4% (24,342) |
Number of families with income $75k - 100k:| West Valley: | 18.3% (416) |
| State: | 14.4% (30,698) |
Number of families with income $100k - 125k:| West Valley: | 7.8% (178) |
| State: | 11.4% (24,331) |
Number of families with income $125k - 150k:| West Valley: | 7.2% (164) |
| State: | 7.5% (16,099) |
Number of families with income $150k - 200k:| West Valley: | 10.7% (243) |
| State: | 8.2% (17,551) |
Number of families with income > $200k:| West Valley: | 5.3% (122) |
| State: | 9.7% (20,653) |
Median non-family income in West Valley in 2022:| West Valley: | $89,557 |
| Washington: | $54,173 |
Change in median non-family income between 2000 and 2022:| West Valley, Washington: | +123.2% |
| State: | +105.8% |
Median per capita income in West Valley in 2022:| West Valley: | $31,231 |
| Washington: | $28,252 |
Change in median per capita income between 2000 and 2022:| West Valley, Washington: | +135.5% |
| State: | +150.2% |
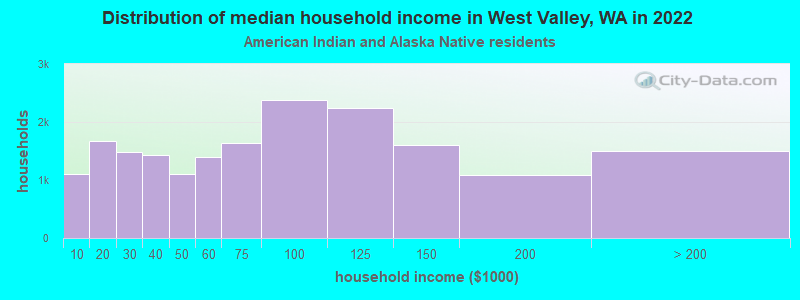
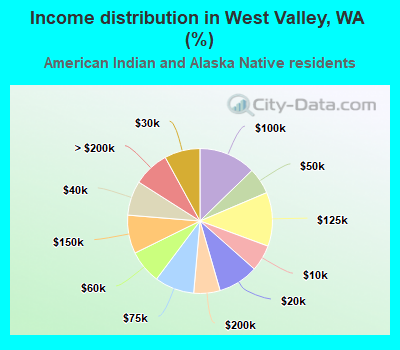
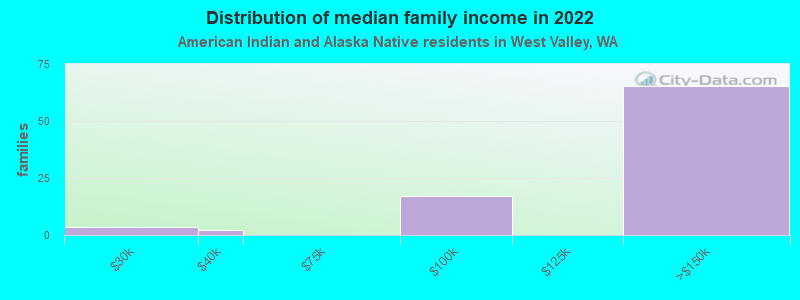
Income statistics for American Indian and Alaska Native residents
Median household income in West Valley, WA in 2022:| West Valley: | $74,399 |
| State: | $71,255 |
Change in median household income between 2000 and 2022:| West Valley, Washington: | +84.4% |
| Washington: | +118.1% |
Number of households with income < $10k:| West Valley: | 5.9% (1,097) |
| State: | 5.9% (1,768) |
Number of households with income $10k - 20k:| West Valley: | 9.0% (1,674) |
| State: | 8.9% (2,694) |
Number of households with income $20k - 30k:| West Valley: | 8.0% (1,481) |
| Washington: | 8.0% (2,412) |
Number of households with income $30k - 40k:| West Valley: | 7.7% (1,435) |
| State: | 7.7% (2,327) |
Number of households with income $40k - 50k:| West Valley: | 5.9% (1,097) |
| State: | 5.8% (1,755) |
Number of households with income $50k - 60k:| West Valley: | 7.5% (1,395) |
| Washington: | 7.5% (2,259) |
Number of households with income $60k - 75k:| West Valley: | 8.8% (1,645) |
| Washington: | 8.8% (2,669) |
Number of households with income $75k - 100k:| West Valley: | 12.7% (2,371) |
| State: | 12.8% (3,861) |
Number of households with income $100k - 125k:| West Valley: | 12.0% (2,238) |
| Washington: | 12.0% (3,618) |
Number of households with income $125k - 150k:| West Valley: | 8.6% (1,598) |
| State: | 8.6% (2,580) |
Number of households with income $150k - 200k:| West Valley: | 5.9% (1,093) |
| State: | 5.9% (1,774) |
Number of households with income > $200k:| West Valley: | 8.0% (1,496) |
| State: | 8.1% (2,447) |
Aggregate household income in West Valley in 2022: $5,014,338
Median family income in West Valley in 2022:| West Valley: | $55,660 |
| State: | $79,010 |
Number of families with income $20k - 30k:| West Valley: | 4.0% (3) |
| State: | 6.2% (1,258) |
Number of families with income $30k - 40k:| West Valley: | 2.6% (2) |
| Washington: | 5.9% (1,190) |
Number of families with income $75k - 100k:| West Valley: | 19.3% (17) |
| State: | 13.1% (2,669) |
Number of families with income $125k - 150k:| West Valley: | 74.1% (65) |
| Washington: | 9.8% (2,000) |
Median non-family income in West Valley in 2022:| West Valley: | $91,308 |
| State: | $35,591 |
Change in median non-family income between 2000 and 2022:| West Valley, Washington: | +125.3% |
| State: | +61.8% |
Median per capita income in West Valley in 2022:| West Valley: | $49,786 |
| State: | $27,053 |
Change in median per capita income between 2000 and 2022:| West Valley, Washington: | +110.8% |
| State: | +98.6% |
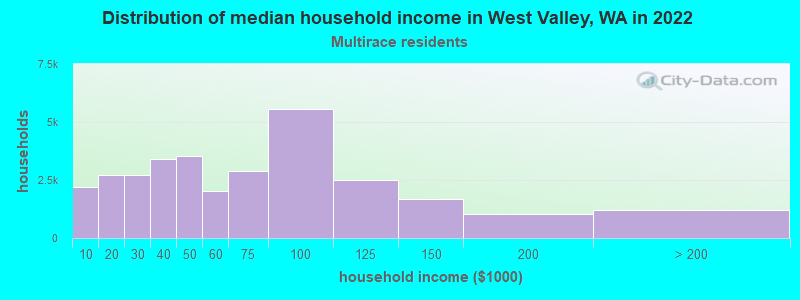
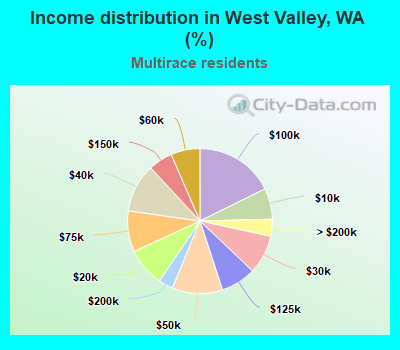
Income statistics for Multirace residents
Median household income in West Valley, WA in 2022:| West Valley: | $85,370 |
| State: | $84,303 |
Change in median household income between 2000 and 2022:| West Valley, Washington: | +104.9% |
| Washington: | +125.7% |
Number of households with income < $10k:| West Valley: | 6.9% (2,180) |
| Washington: | 4.3% (12,040) |
Number of households with income $10k - 20k:| West Valley: | 8.6% (2,717) |
| State: | 6.6% (18,437) |
Number of households with income $20k - 30k:| West Valley: | 8.7% (2,731) |
| State: | 5.2% (14,559) |
Number of households with income $30k - 40k:| West Valley: | 10.9% (3,415) |
| Washington: | 6.7% (18,491) |
Number of households with income $40k - 50k:| West Valley: | 11.2% (3,539) |
| Washington: | 6.3% (17,459) |
Number of households with income $50k - 60k:| West Valley: | 6.5% (2,045) |
| State: | 6.9% (19,086) |
Number of households with income $60k - 75k:| West Valley: | 9.1% (2,868) |
| Washington: | 9.1% (25,310) |
Number of households with income $75k - 100k:| West Valley: | 17.7% (5,565) |
| State: | 13.5% (37,493) |
Number of households with income $100k - 125k:| West Valley: | 7.9% (2,480) |
| State: | 10.7% (29,626) |
Number of households with income $125k - 150k:| West Valley: | 5.4% (1,697) |
| State: | 8.6% (23,899) |
Number of households with income $150k - 200k:| West Valley: | 3.3% (1,024) |
| State: | 10.2% (28,214) |
Number of households with income > $200k:| West Valley: | 3.8% (1,197) |
| State: | 11.9% (32,947) |
Aggregate household income in West Valley in 2022: $107,627,882
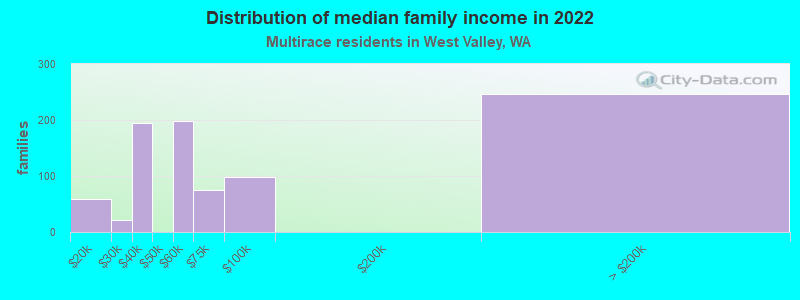
Median family income in West Valley in 2022:| West Valley: | $102,540 |
| Washington: | $95,629 |
Number of families with income $10k - 20k:| West Valley: | 6.6% (59) |
| State: | 4.3% (7,519) |
Number of families with income $20k - 30k:| West Valley: | 2.5% (22) |
| Washington: | 4.4% (7,775) |
Number of families with income $30k - 40k:| West Valley: | 21.7% (194) |
| State: | 5.8% (10,186) |
Number of families with income $50k - 60k:| West Valley: | 22.3% (199) |
| Washington: | 5.6% (9,922) |
Number of families with income $60k - 75k:| West Valley: | 8.4% (75) |
| State: | 9.7% (17,113) |
Number of families with income $75k - 100k:| West Valley: | 11.1% (99) |
| Washington: | 13.6% (23,984) |
Number of families with income > $200k:| West Valley: | 27.5% (246) |
| Washington: | 14.4% (25,289) |
Median non-family income in West Valley in 2022:| West Valley: | $113,387 |
| Washington: | $56,573 |
Median per capita income in West Valley in 2022:| West Valley: | $32,640 |
| Washington: | $32,496 |
Change in median per capita income between 2000 and 2022:| West Valley, Washington: | +100.5% |
| State: | +156.8% |
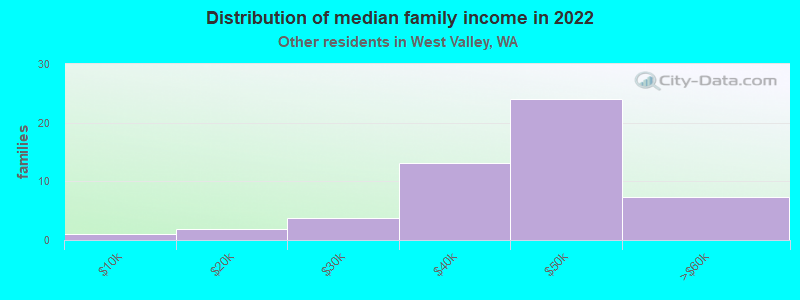
Income statistics for other residents
Number of households with income < $10k:| West Valley: | 2.4% (2) |
| State: | 5.3% (6,540) |
Number of households with income $10k - 20k:| West Valley: | 12.9% (11) |
| State: | 6.0% (7,385) |
Number of households with income $20k - 30k:| West Valley: | 7.1% (6) |
| State: | 7.5% (9,289) |
Number of households with income $30k - 40k:| West Valley: | 16.5% (14) |
| State: | 8.9% (11,015) |
Number of households with income $40k - 50k:| West Valley: | 8.2% (7) |
| Washington: | 7.6% (9,399) |
Number of households with income $50k - 60k:| West Valley: | 5.9% (5) |
| State: | 7.2% (8,867) |
Number of households with income $60k - 75k:| West Valley: | 10.6% (9) |
| State: | 10.5% (13,032) |
Number of households with income $75k - 100k:| West Valley: | 18.8% (16) |
| State: | 14.6% (18,007) |
Number of households with income $100k - 125k:| West Valley: | 8.2% (7) |
| Washington: | 12.2% (15,128) |
Number of households with income $125k - 150k:| West Valley: | 3.5% (3) |
| State: | 5.6% (6,950) |
Number of households with income $150k - 200k:| West Valley: | 3.5% (3) |
| State: | 7.1% (8,749) |
Number of households with income > $200k:| West Valley: | 2.4% (2) |
| State: | 7.5% (9,208) |
Aggregate household income in West Valley in 2022: $5,659,724
Median family income in West Valley in 2022:| West Valley: | $92,562 |
| Washington: | $72,588 |
Number of families with income < $10k:| West Valley: | 1.9% (1) |
| State: | 5.5% (5,287) |
Number of families with income $10k - 20k:| West Valley: | 3.7% (2) |
| State: | 4.0% (3,814) |
Number of families with income $20k - 30k:| West Valley: | 7.2% (4) |
| State: | 6.6% (6,293) |
Number of families with income $30k - 40k:| West Valley: | 25.6% (13) |
| Washington: | 9.2% (8,827) |
Number of families with income $40k - 50k:| West Valley: | 47.2% (24) |
| State: | 8.0% (7,634) |
Number of families with income $50k - 60k:| West Valley: | 14.3% (7) |
| State: | 7.7% (7,357) |
Median non-family income in West Valley in 2022:| West Valley: | $7,158 |
| State: | $44,777 |
Change in median non-family income between 2000 and 2022:| West Valley, Washington: | +14.5% |
| Washington: | +84.2% |
Median per capita income in West Valley in 2022:| West Valley: | $22,814 |
| Washington: | $27,542 |
Change in median per capita income between 2000 and 2022:| West Valley, Washington: | +148.3% |
| State: | +167.8% |