Carriage Lane neighborhood in Lexington, Kentucky (KY), 40517 detailed profile
Settings
X

Area: 0.069 square miles
Population: 301
Population density: 4,386 people per square mile

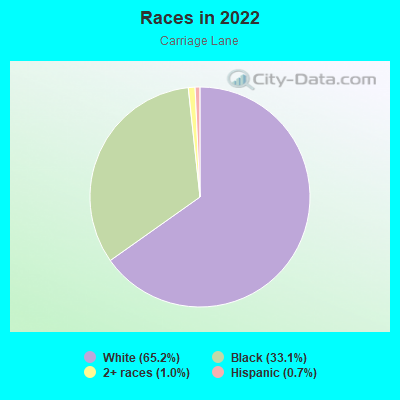
- 19565.2%White
- 9933.1%Black
- 31.0%Two or more races
- 20.7%Hispanic or Latino
Median household income in 2022:
| Carriage Lane: | $60,147 |
| Kentucky: | $59,341 |
Distribution of median household income
![Distribution of median household income]()
- 2Less than $10,000
- 4$10,000 to $19,999
- 12$20,000 to $29,999
- 9$30,000 to $39,999
- 7$40,000 to $49,999
- 17$50,000 to $59,999
- 7$60,000 to $74,999
- 3$75,000 to $99,999
- 7$100,000 to $124,999
- 11$125,000 to $149,999
- 16$150,000 to $199,999
- 6$200,000 or more

Distribution of owner-occupied house/condo value
![Distribution of owner-occupied house/condo value]()
- 3Less than $50,000
- 4$100,000 to $149,999
- 20$150,000 to $199,999
- 23$200,000 to $249,999
- 12$250,000 to $299,999
- 6$300,000 to $399,999

Distribution of rent paid by renters
![Distribution of rent paid by renters]()
- 1$100 to $199
- 4$200 to $299
- 3$300 to $399
- 2$400 to $499
- 2$500 to $599
- 11$600 to $699
- 14$700 to $799
- 11$800 to $899
- 3$900 to $999
- 4$1,000 to $1,249
- 3$1,250 to $1,499

Median rent in 2022:
| Carriage Lane: | $721 |
| Kentucky: | $702 |
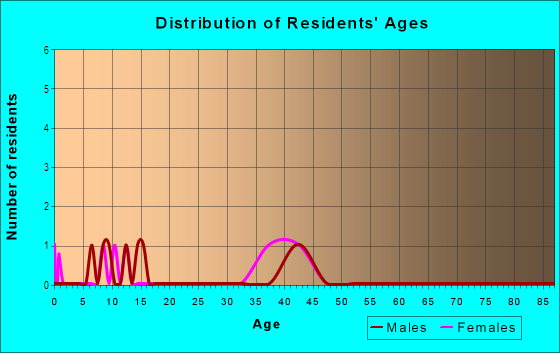
| Males: | 169 |
| Females: | 131 |
| Males: | 21.8 years |
| Females: | 51.6 years |
Average household size:
| Carriage Lane: | 3.2 people |
| Kentucky: | 2.4 people |
Percentage of family households:
| Carriage Lane: | 48.2% |
| Kentucky: | 45.9% |
| Here: | 28.8% |
| Kentucky: | 47.1% |
Percentage of married-couple families with children (among all households):
| Carriage Lane: | 6.1% |
| Kentucky: | 58.4% |
Percentage of single-mother households (among all households):
| Carriage Lane: | 21.8% |
| Kentucky: | 9.3% |
Percentage of never married males 15 years old and over:
Percentage of never married females 15 years old and over:
| Carriage Lane: | 31.2% |
| Kentucky: | 16.3% |
Percentage of never married females 15 years old and over:
| Carriage Lane: | 8.2% |
| Kentucky: | 13.5% |
Percentage of people that speak English not well or not at all:
| Carriage Lane: | 0.0% |
| Kentucky: | 1.1% |
Percentage of people born in this state:
Percentage of people born in another U.S. state:
Percentage of native residents but born outside the U.S.:
Percentage of foreign born residents:
| Here: | 65.9% |
| Kentucky: | 67.2% |
Percentage of people born in another U.S. state:
| Carriage Lane: | 24.9% |
| Kentucky: | 28.0% |
Percentage of native residents but born outside the U.S.:
| Here: | 3.3% |
| Kentucky: | 0.8% |
Percentage of foreign born residents:
| Here: | 5.9% |
| Kentucky: | 4.0% |
Owner-occupied
Renter-occupied

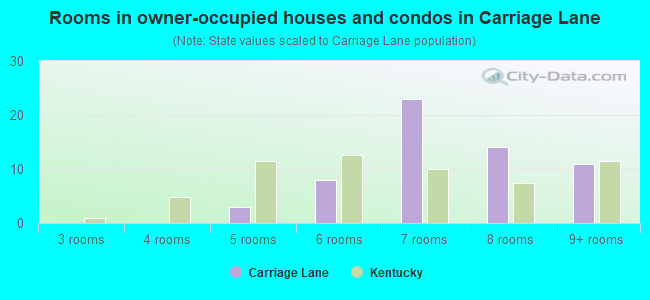
- Rooms in owner-occupied houses and condos in Carriage Lane
- 01 room
- 02 rooms
- 03 rooms
- 04 rooms
- 35 rooms
- 86 rooms
- 237 rooms
- 148 rooms
- 119+ rooms
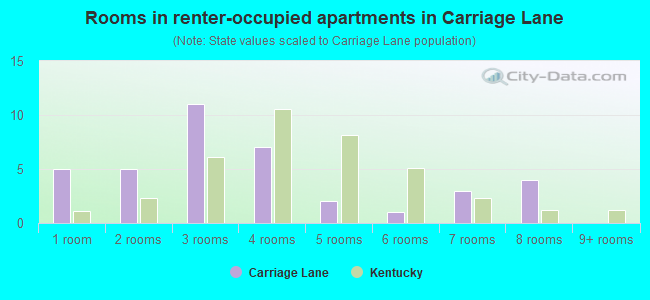
- Rooms in renter-occupied apartments in Carriage Lane
- 51 room
- 52 rooms
- 113 rooms
- 74 rooms
- 25 rooms
- 16 rooms
- 37 rooms
- 48 rooms
- 09+ rooms
Owner-occupied
Renter-occupied
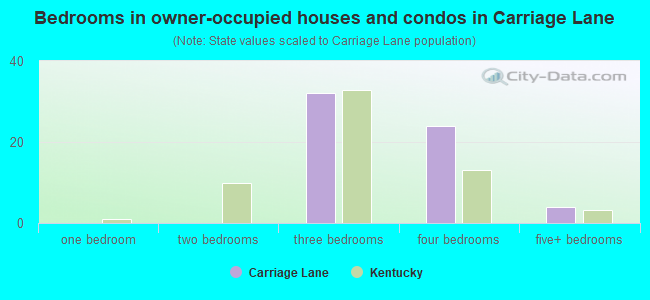
- Bedrooms in owner-occupied houses and condos in Carriage Lane
- 0no bedroom
- 01 bedroom
- 02 bedrooms
- 323 bedrooms
- 244 bedrooms
- 45+ bedrooms
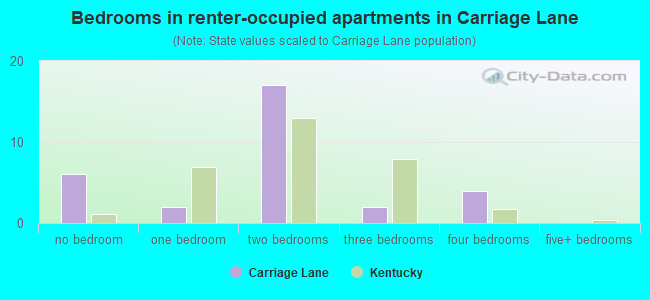
- Bedrooms in renter-occupied apartments in Carriage Lane
- 6no bedroom
- 21 bedroom
- 172 bedrooms
- 23 bedrooms
- 44 bedrooms
- 05+ bedrooms
Average number of cars or other vehicles available in houses/condos:
Average number of cars or other vehicles available in apartments:
| This neighborhood: | 2.3 |
| Kentucky: | 2.1 |
Average number of cars or other vehicles available in apartments:
| Here: | 1.1 |
| Kentucky: | 1.3 |
Percentage of units with a mortgage:
| Carriage Lane: | 64.1% |
| Kentucky: | 56.7% |
Average estimated value of detached houses in 2022 (69.8% of all units):
| Carriage Lane: | $213,263 |
| Kentucky: | $256,452 |
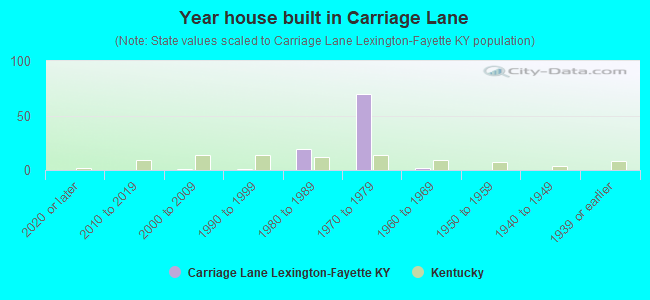
- Year house built in Carriage Lane
- 02020 or later
- 02010 to 2019
- 12000 to 2009
- 11990 to 1999
- 191980 to 1989
- 701970 to 1979
- 21960 to 1969
- 01950 to 1959
- 01940 to 1949
- 01939 or earlier
Travel time to work (commute)
![Travel time to work (commute)]()
- 75 to 9 minutes
- 1510 to 14 minutes
- 2215 to 19 minutes
- 2920 to 24 minutes
- 1025 to 29 minutes
- 1230 to 34 minutes
- 135 to 39 minutes
- 245 to 59 minutes
- 390 or more minutes

Means of transportation to work
![Means of transportation to work]()
- 64.7%92Drove a car alone
- 24.6%35Carpooled
- 1.4%2Bus
- 1.4%2Walked
- 0.7%1Other means
- 6.3%9Worked at home

Time leaving home to go to work
![Time leaving home to go to work]()
- 412:00 a.m. to 4:59 a.m.
- 45:30 a.m. to 5:59 a.m.
- 56:00 a.m. to 6:29 a.m.
- 136:30 a.m. to 6:59 a.m.
- 47:00 a.m. to 7:29 a.m.
- 117:30 a.m. to 7:59 a.m.
- 118:00 a.m. to 8:29 a.m.
- 148:30 a.m. to 8:59 a.m.
- 79:00 a.m. to 9:59 a.m.
- 710:00 a.m. to 10:59 a.m.
- 111:00 a.m. to 11:59 a.m.
- 312:00 p.m. to 3:59 p.m.
- 144:00 p.m. to 11:59 p.m.

Occupations of males:
- Percentage of males in management occupations (except farmers):
Here: 20.5% Kentucky: 10.7%
- Percentage of males in business and financial operations occupations:
Here: 2.3% Kentucky: 4.0%
- Percentage of males in computer and mathematical occupations:
Here: 14.1% Kentucky: 3.0%
- Percentage of males in architecture and engineering occupations:
Here: 2.5% Kentucky: 2.7%
- Percentage of males in community and social services occupations:
Here: 1.8% Kentucky: 1.4%
- Percentage of males in service occupations:
Here: 13.1% Kentucky: 12.5%
- Percentage of males in sales and office occupations:
Here: 17.0% Kentucky: 14.0%
- Percentage of males in construction, extraction, and maintenance occupations:
Here: 5.5% Kentucky: 8.7%
- Percentage of males in production occupations:
Here: 5.6% Kentucky: 12.3%
- Percentage of males in transportation occupations:
Here: 11.7% Kentucky: 6.7%
- Percentage of males in material moving occupations:
Here: 3.5% Kentucky: 7.7%
Occupations of females:
- Percentage of females in management occupations (except farmers):
Here: 4.5% Kentucky: 8.4%
- Percentage of females in business and financial operations occupations:
Here: 7.8% Kentucky: 5.3%
- Percentage of females in architecture and engineering occupations:
Here: 2.7% Kentucky: 0.6%
- Percentage of females in community and social services occupations:
Here: 2.7% Kentucky: 2.8%
- Percentage of females in education, training, and library occupations:
Here: 17.5% Kentucky: 9.3%
- Percentage of females in arts, design, entertainment, sports, and media occupations:
Here: 1.5% Kentucky: 1.5%
- Percentage of females in healthcare practitioners and technical occupations:
Here: 4.0% Kentucky: 11.8%
- Percentage of females in service occupations:
Here: 14.7% Kentucky: 19.1%
- Percentage of females in sales and office occupations:
Here: 35.7% Kentucky: 27.8%
- Percentage of females in material moving occupations:
Here: 13.0% Kentucky: 3.2%
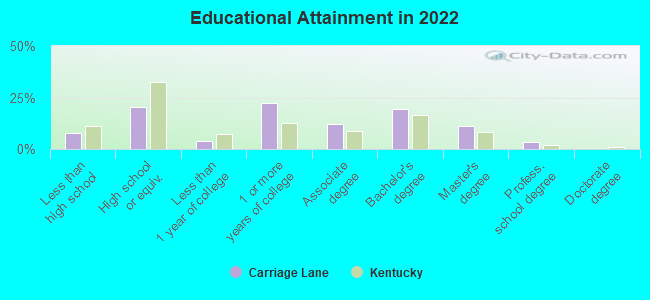
Education in this neighborhood (subdivision or community):
- Percentage of people 3 years and older in K-12 schools:
Carriage Lane: 18.1% Kentucky: 16.5%
- Percentage of people 3 years and older in undergraduate colleges:
Carriage Lane: 6.3% Kentucky: 4.1%
- Percentage of people 3 years and older in grad. or professional schools:
Carriage Lane: 1.0% Kentucky: 1.3%
- Percentage of students K-12 enrolled in private schools:
Carriage Lane: 7.7% Kentucky: 16.3%
Percentage of population below poverty level:
| Carriage Lane: | 19.9% |
| Kentucky: | 16.5% |
Median year owner moved in (as recorded in 2022):
Median year renter moved in (as recorded in 2022):
| Carriage Lane: | 2004 |
| Kentucky: | 2010 |
Median year renter moved in (as recorded in 2022):
| Carriage Lane: | 2018 |
| Kentucky: | 2020 |
Percentage of married-couple families with both working:
| Carriage Lane: | 100.0% |
| Kentucky: | 70.7% |
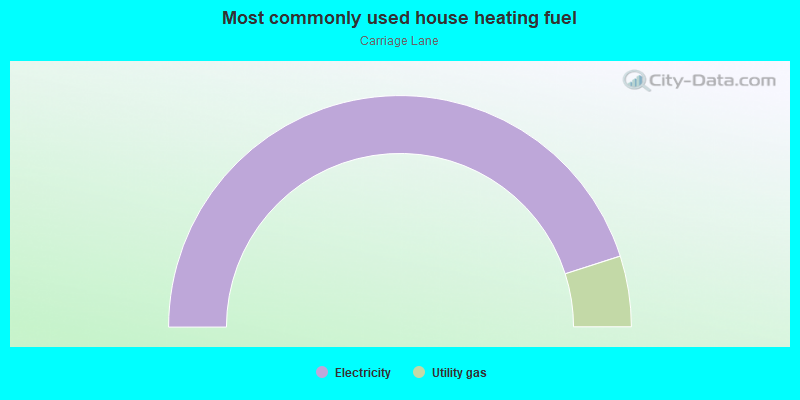
- 90.1%Electricity
- 9.9%Utility gas
Roads and streets:
Carriage Ln
Length: 0.53 miles
Directions: E-W, N-S, SE-NW, SW-NE
Address range: 3230 to 3337
Directions: E-W, N-S, SE-NW, SW-NE
Address range: 3230 to 3337
Golf Course Cir
Length: 0.09 miles
Directions: E-W, SW-NE
Address range: 1300 to 1399
Directions: E-W, SW-NE
Address range: 1300 to 1399
Carriage Lane Cir
Length: 0.04 miles
Direction: E-W
Address range: 3200 to 3214
Direction: E-W
Address range: 3200 to 3214