Castlewood neighborhood in Lexington, Kentucky (KY), 40505 detailed profile
Settings
X

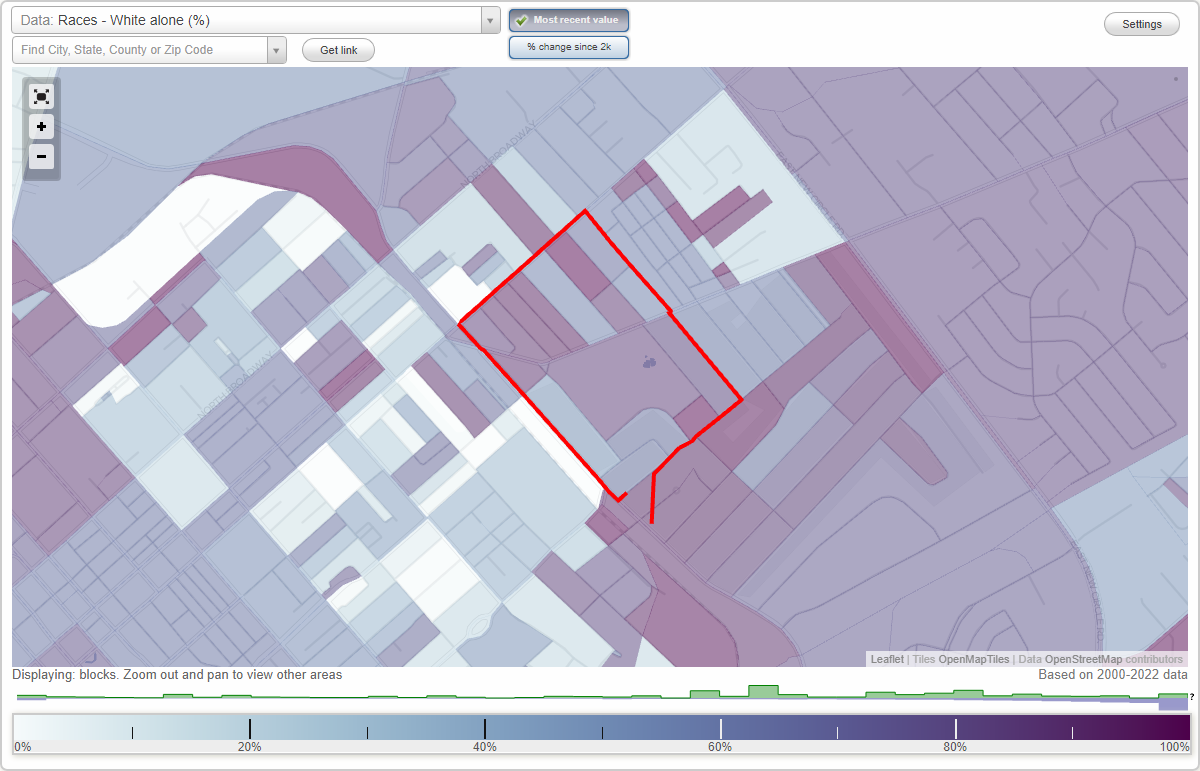
Area: 0.216 square miles
Population: 1,399
Population density: 6,467 people per square mile

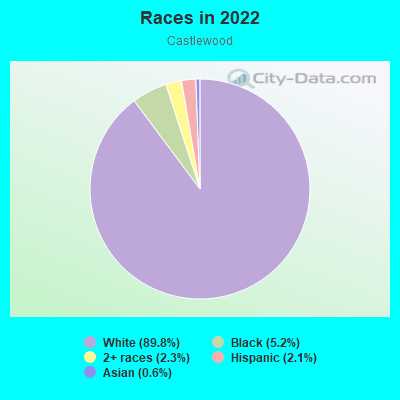
- 1,26389.8%White
- 735.2%Black
- 322.3%Two or more races
- 302.1%Hispanic or Latino
- 80.6%Asian
Median household income in 2022:
| Castlewood: | $67,695 |
| Kentucky: | $59,341 |
Distribution of median household income
![Distribution of median household income]()
- 19Less than $10,000
- 58$10,000 to $19,999
- 41$20,000 to $29,999
- 51$30,000 to $39,999
- 104$40,000 to $49,999
- 10$50,000 to $59,999
- 101$60,000 to $74,999
- 128$75,000 to $99,999
- 35$100,000 to $124,999
- 35$125,000 to $149,999
- 43$150,000 to $199,999
- 6$200,000 or more

Distribution of owner-occupied house/condo value
![Distribution of owner-occupied house/condo value]()
- 7Less than $50,000
- 164$50,000 to $99,999
- 141$100,000 to $149,999
- 58$150,000 to $199,999
- 35$200,000 to $249,999
- 13$250,000 to $299,999
- 4$300,000 to $399,999
- 10$1,000,000 or more

Distribution of rent paid by renters
![Distribution of rent paid by renters]()
- 9$200 to $299
- 33$400 to $499
- 34$500 to $599
- 72$600 to $699
- 20$700 to $799
- 11$800 to $899
- 43$900 to $999
- 38$1,000 to $1,249
- 3$1,250 to $1,499

Median rent in 2022:
| Castlewood: | $942 |
| Kentucky: | $702 |
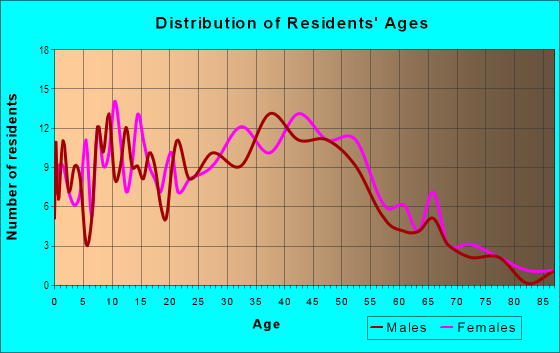
| Males: | 830 |
| Females: | 569 |
| Males: | 38.1 years |
| Females: | 34.9 years |
Average household size:
| Castlewood: | 2.7 people |
| Kentucky: | 2.4 people |
Percentage of family households:
| Castlewood: | 50.9% |
| Kentucky: | 45.9% |
| Here: | 40.2% |
| Kentucky: | 47.1% |
Percentage of married-couple families with children (among all households):
| Castlewood: | 36.5% |
| Kentucky: | 58.4% |
Percentage of single-mother households (among all households):
| Castlewood: | 3.4% |
| Kentucky: | 9.3% |
Percentage of never married males 15 years old and over:
Percentage of never married females 15 years old and over:
| Castlewood: | 21.1% |
| Kentucky: | 16.3% |
Percentage of never married females 15 years old and over:
| Castlewood: | 4.5% |
| Kentucky: | 13.5% |
Percentage of people born in this state:
Percentage of people born in another U.S. state:
Percentage of native residents but born outside the U.S.:
Percentage of foreign born residents:
| Here: | 62.2% |
| Kentucky: | 67.2% |
Percentage of people born in another U.S. state:
| Castlewood: | 27.9% |
| Kentucky: | 28.0% |
Percentage of native residents but born outside the U.S.:
| Here: | 0.4% |
| Kentucky: | 0.8% |
Percentage of foreign born residents:
| Here: | 9.5% |
| Kentucky: | 4.0% |
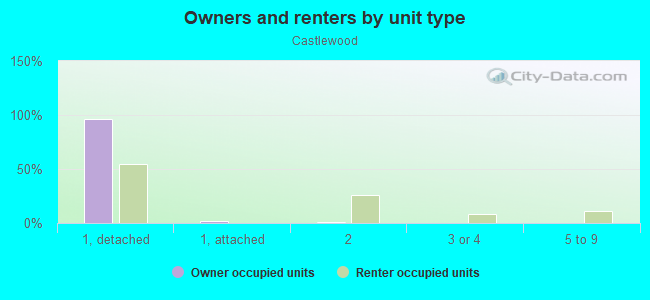
Owner-occupied
Renter-occupied

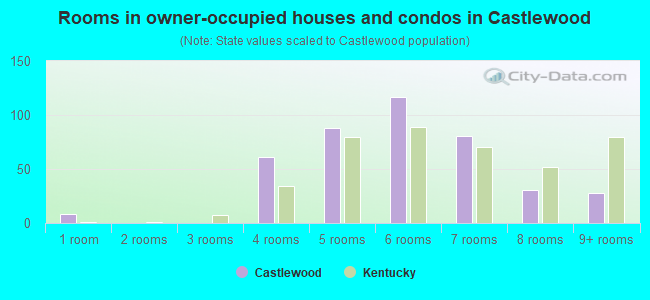
- Rooms in owner-occupied houses and condos in Castlewood
- 81 room
- 02 rooms
- 03 rooms
- 614 rooms
- 885 rooms
- 1176 rooms
- 817 rooms
- 318 rooms
- 289+ rooms
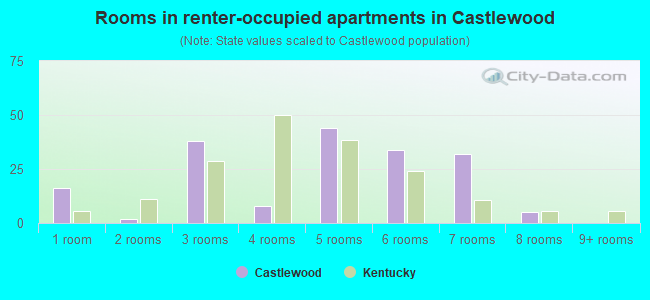
- Rooms in renter-occupied apartments in Castlewood
- 161 room
- 22 rooms
- 383 rooms
- 84 rooms
- 445 rooms
- 346 rooms
- 327 rooms
- 58 rooms
- 09+ rooms
Owner-occupied
Renter-occupied
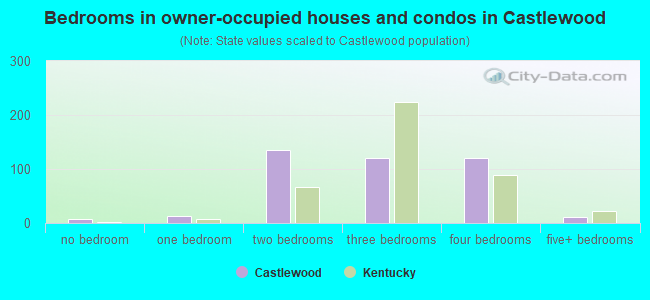
- Bedrooms in owner-occupied houses and condos in Castlewood
- 8no bedroom
- 131 bedroom
- 1362 bedrooms
- 1203 bedrooms
- 1204 bedrooms
- 115+ bedrooms
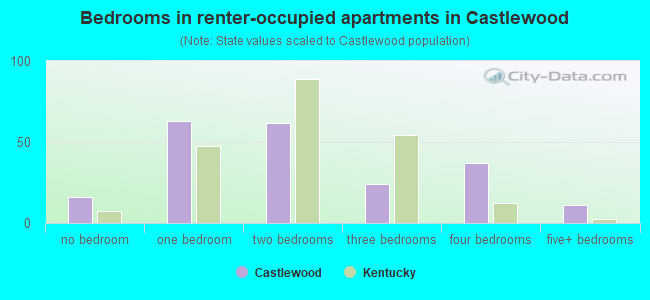
- Bedrooms in renter-occupied apartments in Castlewood
- 16no bedroom
- 631 bedroom
- 622 bedrooms
- 243 bedrooms
- 374 bedrooms
- 115+ bedrooms
Average number of cars or other vehicles available in houses/condos:
Average number of cars or other vehicles available in apartments:
| This neighborhood: | 1.6 |
| Kentucky: | 2.1 |
Average number of cars or other vehicles available in apartments:
| Here: | 1.9 |
| Kentucky: | 1.3 |
Percentage of units with a mortgage:
| Castlewood: | 60.4% |
| Kentucky: | 56.7% |
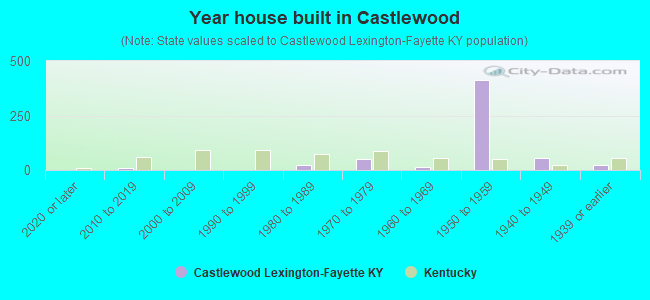
- Year house built in Castlewood
- 02020 or later
- 82010 to 2019
- 12000 to 2009
- 01990 to 1999
- 251980 to 1989
- 521970 to 1979
- 131960 to 1969
- 4131950 to 1959
- 571940 to 1949
- 251939 or earlier
Travel time to work (commute)
![Travel time to work (commute)]()
- 14Less than 5 minutes
- 665 to 9 minutes
- 4010 to 14 minutes
- 19715 to 19 minutes
- 9820 to 24 minutes
- 925 to 29 minutes
- 15130 to 34 minutes
- 535 to 39 minutes
- 840 to 44 minutes
- 845 to 59 minutes
- 760 to 89 minutes
- 390 or more minutes

Means of transportation to work
![Means of transportation to work]()
- 75.0%570Drove a car alone
- 2.2%17Carpooled
- 1.8%14Bus
- 1.2%9Ferryboat
- 1.7%13Taxi
- 1.3%10Walked
- 7.1%54Other means
- 10.1%77Worked at home

Time leaving home to go to work
![Time leaving home to go to work]()
- 1912:00 a.m. to 4:59 a.m.
- 235:00 a.m. to 5:29 a.m.
- 795:30 a.m. to 5:59 a.m.
- 596:00 a.m. to 6:29 a.m.
- 256:30 a.m. to 6:59 a.m.
- 457:00 a.m. to 7:29 a.m.
- 847:30 a.m. to 7:59 a.m.
- 1248:00 a.m. to 8:29 a.m.
- 628:30 a.m. to 8:59 a.m.
- 509:00 a.m. to 9:59 a.m.
- 510:00 a.m. to 10:59 a.m.
- 311:00 a.m. to 11:59 a.m.
- 2312:00 p.m. to 3:59 p.m.
- 324:00 p.m. to 11:59 p.m.

Occupations of males:
- Percentage of males in management occupations (except farmers):
Here: 2.8% Kentucky: 10.7%
- Percentage of males in business and financial operations occupations:
Here: 6.2% Kentucky: 4.0%
- Percentage of males in computer and mathematical occupations:
Here: 37819.6% Kentucky: 3.0%
- Percentage of males in architecture and engineering occupations:
Here: 7.9% Kentucky: 2.7%
- Percentage of males in community and social services occupations:
Here: 16443.3% Kentucky: 1.4%
- Percentage of males in legal occupations:
Here: 23020.7% Kentucky: 0.8%
- Percentage of males in education, training, and library occupations:
Here: 10.5% Kentucky: 2.9%
- Percentage of males in arts, design, entertainment, sports, and media occupations:
Here: 2.0% Kentucky: 1.3%
- Percentage of males in healthcare practitioners and technical occupations:
Here: 3.4% Kentucky: 3.1%
- Percentage of males in service occupations:
Here: 5.1% Kentucky: 12.5%
- Percentage of males in sales and office occupations:
Here: 20.9% Kentucky: 14.0%
- Percentage of males in farming, fishing, and forestry occupations:
Here: 11510.3% Kentucky: 0.8%
- Percentage of males in construction, extraction, and maintenance occupations:
Here: 2.3% Kentucky: 8.7%
- Percentage of males in production occupations:
Here: 7.3% Kentucky: 12.3%
- Percentage of males in transportation occupations:
Here: 29.9% Kentucky: 6.7%
- Percentage of males in material moving occupations:
Here: 1.7% Kentucky: 7.7%
Occupations of females:
- Percentage of females in management occupations (except farmers):
Here: 1.8% Kentucky: 8.4%
- Percentage of females in business and financial operations occupations:
Here: 10631.8% Kentucky: 5.3%
- Percentage of females in architecture and engineering occupations:
Here: 13289.8% Kentucky: 0.6%
- Percentage of females in community and social services occupations:
Here: 23921.7% Kentucky: 2.8%
- Percentage of females in legal occupations:
Here: 13289.8% Kentucky: 1.1%
- Percentage of females in education, training, and library occupations:
Here: 11.4% Kentucky: 9.3%
- Percentage of females in arts, design, entertainment, sports, and media occupations:
Here: 31895.5% Kentucky: 1.5%
- Percentage of females in healthcare practitioners and technical occupations:
Here: 8.2% Kentucky: 11.8%
- Percentage of females in service occupations:
Here: 44.7% Kentucky: 19.1%
- Percentage of females in sales and office occupations:
Here: 21.5% Kentucky: 27.8%
- Percentage of females in farming, fishing, and forestry occupations:
Here: 15947.8% Kentucky: 0.2%
- Percentage of females in production occupations:
Here: 9.1% Kentucky: 5.2%
- Percentage of females in transportation occupations:
Here: 3.2% Kentucky: 1.1%
- Percentage of females in material moving occupations:
Here: 63791.1% Kentucky: 3.2%
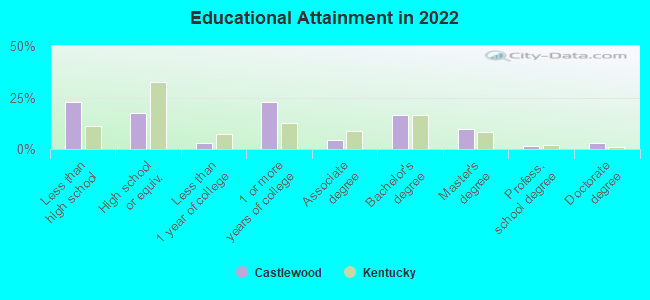
Education in this neighborhood (subdivision or community):
- Percentage of people 3 years and older in K-12 schools:
Castlewood: 24.9% Kentucky: 16.5%
- Percentage of people 3 years and older in undergraduate colleges:
Castlewood: 2.5% Kentucky: 4.1%
- Percentage of people 3 years and older in grad. or professional schools:
Castlewood: 4.1% Kentucky: 1.3%
- Percentage of students K-12 enrolled in private schools:
Castlewood: 1.2% Kentucky: 16.3%
Percentage of population below poverty level:
| Castlewood: | 19.3% |
| Kentucky: | 16.5% |
Median year owner moved in (as recorded in 2022):
Median year renter moved in (as recorded in 2022):
| Castlewood: | 2002 |
| Kentucky: | 2010 |
Median year renter moved in (as recorded in 2022):
| Castlewood: | 2014 |
| Kentucky: | 2020 |
Percentage of married-couple families with both working:
| Castlewood: | 116.0% |
| Kentucky: | 70.7% |
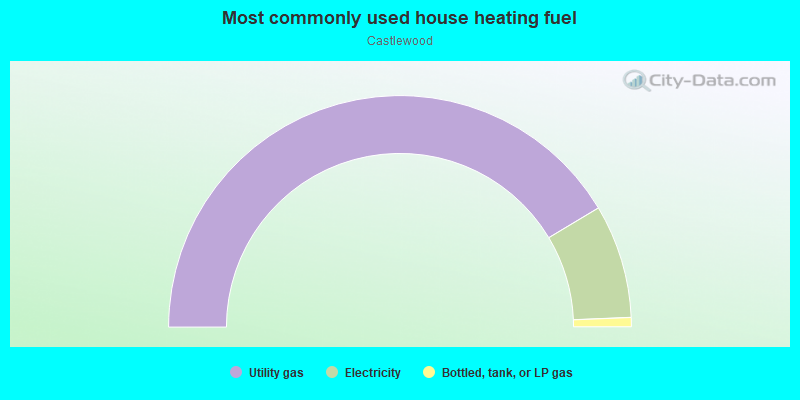
- 82.8%Utility gas
- 15.9%Electricity
- 1.3%Bottled, tank, or LP gas
Roads and streets:
Carlisle Ave
Length: 0.56 miles
Direction: SE-NW
Address range: 134 to 499
Direction: SE-NW
Address range: 134 to 499
Bryan Ave
Length: 0.50 miles
Direction: E-W
Address range: 832 to 1199
Direction: E-W
Address range: 832 to 1199
Castlewood Dr
Length: 0.34 miles
Direction: SE-NW
Address range: 100 to 299
Direction: SE-NW
Address range: 100 to 299
Park View Ave
Length: 0.32 miles
Direction: SE-NW
Address range: 300 to 599
Direction: SE-NW
Address range: 300 to 599
Highland Park Dr
Length: 0.30 miles
Directions: E-W, SE-NW, SW-NE
Address range: 900 to 999
Directions: E-W, SE-NW, SW-NE
Address range: 900 to 999
Oak Hill Dr
Length: 0.25 miles
Direction: SW-NE
Address range: 900 to 1119
Direction: SW-NE
Address range: 900 to 1119
Idlewild Ct
Length: 0.17 miles
Directions: E-W, SE-NW, SW-NE
Address range: 820 to 999
Directions: E-W, SE-NW, SW-NE
Address range: 820 to 999
Orion Way
Length: 0.15 miles
Direction: SW-NE
Address range: 1000 to 1106
Direction: SW-NE
Address range: 1000 to 1106
Devonia Ave
Length: 0.14 miles
Direction: SE-NW
Address range: 200 to 299
Direction: SE-NW
Address range: 200 to 299
Arceme Ave
Length: 0.11 miles
Direction: SE-NW
Address range: 200 to 299
Direction: SE-NW
Address range: 200 to 299
Churchill Dr
Length: 0.10 miles
Direction: SW-NE
Address range: 1000 to 1099
Direction: SW-NE
Address range: 1000 to 1099
Maple Ave
Length: 0.03 miles
Direction: N-S
Address range: 808 to 999
Direction: N-S
Address range: 808 to 999