Cottage Line neighborhood in Norfolk, Virginia (VA), 23503 detailed profile
Settings
X


Business Search - 14 Million verified businesses
Area: 0.180 square miles
Population: 1,239
Population density:
| Cottage Line: | 6,894 people per square mile |
| Norfolk: | 4,337 people per square mile |

- 72855.4%White
- 31924.3%Black
- 1047.9%Hispanic or Latino
- 604.6%American Indian
- 423.2%Some other race
- 332.5%Two or more races
- 272.1%Asian

Median household income in 2022:
| Cottage Line: | $55,877 |
| Norfolk: | $61,090 |
Distribution of median household income
![Distribution of median household income]()
- 37Less than $10,000
- 40$10,000 to $19,999
- 91$20,000 to $29,999
- 82$30,000 to $39,999
- 82$40,000 to $49,999
- 57$50,000 to $59,999
- 88$60,000 to $74,999
- 82$75,000 to $99,999
- 47$100,000 to $124,999
- 42$125,000 to $149,999
- 23$150,000 to $199,999
- 42$200,000 or more

Distribution of owner-occupied house/condo value
![Distribution of owner-occupied house/condo value]()
- 5Less than $50,000
- 34$50,000 to $99,999
- 23$100,000 to $149,999
- 30$150,000 to $199,999
- 53$200,000 to $249,999
- 50$250,000 to $299,999
- 68$300,000 to $399,999
- 19$400,000 to $499,999
- 24$500,000 to $749,999
- 17$750,000 to $999,999
- 2$1,000,000 or more

Distribution of rent paid by renters
![Distribution of rent paid by renters]()
- 18$100 to $199
- 87$300 to $399
- 35$400 to $499
- 13$500 to $599
- 100$600 to $699
- 73$700 to $799
- 102$800 to $899
- 66$900 to $999
- 51$1,000 to $1,249
- 40$1,250 to $1,499
- 56$1,500 to $1,999
- 34$2,000 or more

Median rent in 2022:
| Cottage Line: | $914 |
| Norfolk: | $1,035 |
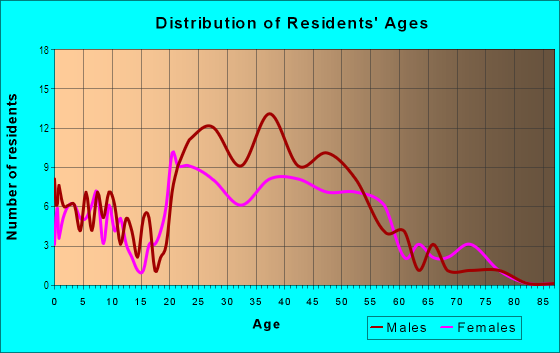
| Males: | 632 |
| Females: | 607 |
Males:
| This neighborhood: | 39.6 years |
| Whole city: | 31.3 years |
| This neighborhood: | 44.5 years |
| Whole city: | 34.4 years |
Average household size:
| Cottage Line: | 1.8 people |
| Norfolk: | 2.3 people |
Percentage of family households:
| Cottage Line: | 35.4% |
| Norfolk: | 41.3% |
| Here: | 27.2% |
| Norfolk: | 31.7% |
Percentage of married-couple families with children (among all households):
| Cottage Line: | 18.4% |
| Norfolk: | 20.2% |
Percentage of single-mother households (among all households):
| Cottage Line: | 21.3% |
| Norfolk: | 16.3% |
Percentage of never married males 15 years old and over:
Percentage of never married females 15 years old and over:
| Cottage Line: | 20.9% |
| Norfolk: | 25.4% |
Percentage of never married females 15 years old and over:
| Cottage Line: | 17.1% |
| city: | 20.5% |
Percentage of people that speak English not well or not at all:
| Cottage Line: | 0.2% |
| Norfolk: | 1.4% |
Percentage of people born in this state:
Percentage of people born in another U.S. state:
Percentage of native residents but born outside the U.S.:
Percentage of foreign born residents:
| Here: | 39.6% |
| Norfolk: | 51.1% |
Percentage of people born in another U.S. state:
| Cottage Line: | 50.8% |
| Norfolk: | 40.8% |
Percentage of native residents but born outside the U.S.:
| Here: | 2.3% |
| city: | 1.6% |
Percentage of foreign born residents:
| Here: | 7.3% |
| Norfolk: | 6.5% |

Owner-occupied
Renter-occupied


- Rooms in owner-occupied houses and condos in Cottage Line
- 01 room
- 582 rooms
- 133 rooms
- 294 rooms
- 495 rooms
- 456 rooms
- 277 rooms
- 168 rooms
- 329+ rooms

- Rooms in renter-occupied apartments in Cottage Line
- 121 room
- 352 rooms
- 573 rooms
- 1724 rooms
- 735 rooms
- 646 rooms
- 217 rooms
- 178 rooms
- 199+ rooms
Owner-occupied
Renter-occupied

- Bedrooms in owner-occupied houses and condos in Cottage Line
- 0no bedroom
- 211 bedroom
- 432 bedrooms
- 1053 bedrooms
- 494 bedrooms
- 85+ bedrooms

- Bedrooms in renter-occupied apartments in Cottage Line
- 12no bedroom
- 1281 bedroom
- 1992 bedrooms
- 943 bedrooms
- 264 bedrooms
- 75+ bedrooms
Average number of cars or other vehicles available in houses/condos:
Average number of cars or other vehicles available in apartments:
| This neighborhood: | 1.7 |
| Norfolk: | 2.0 |
Average number of cars or other vehicles available in apartments:
| Here: | 1.1 |
| city: | 1.3 |
Percentage of units with a mortgage:
| Cottage Line: | 73.7% |
| Norfolk: | 70.0% |

- Year house built in Cottage Line
- 42020 or later
- 1042010 to 2019
- 122000 to 2009
- 971990 to 1999
- 1021980 to 1989
- 651970 to 1979
- 941960 to 1969
- 1021950 to 1959
- 661940 to 1949
- 781939 or earlier

City-data.com crime index for city in 2020 (higher means more crime):
| City: | 327.9 |
| U.S. average: | 219.5 |
Travel time to work (commute)
![Travel time to work (commute)]()
- 3Less than 5 minutes
- 155 to 9 minutes
- 7610 to 14 minutes
- 11015 to 19 minutes
- 12320 to 24 minutes
- 4925 to 29 minutes
- 8230 to 34 minutes
- 2335 to 39 minutes
- 2640 to 44 minutes
- 5045 to 59 minutes
- 4960 to 89 minutes
- 1290 or more minutes

Means of transportation to work
![Means of transportation to work]()
- 81.0%590Drove a car alone
- 8.5%62Carpooled
- 7.0%51Bus
- 2.3%17Bicycle
- 1.1%8Walked
- 0.8%6Other means
- 6.2%45Worked at home

Time leaving home to go to work
![Time leaving home to go to work]()
- 3812:00 a.m. to 4:59 a.m.
- 555:00 a.m. to 5:29 a.m.
- 125:30 a.m. to 5:59 a.m.
- 656:00 a.m. to 6:29 a.m.
- 536:30 a.m. to 6:59 a.m.
- 947:00 a.m. to 7:29 a.m.
- 517:30 a.m. to 7:59 a.m.
- 448:00 a.m. to 8:29 a.m.
- 298:30 a.m. to 8:59 a.m.
- 719:00 a.m. to 9:59 a.m.
- 2410:00 a.m. to 10:59 a.m.
- 711:00 a.m. to 11:59 a.m.
- 3612:00 p.m. to 3:59 p.m.
- 504:00 p.m. to 11:59 p.m.

Occupations of males:
- Percentage of males in management occupations (except farmers):
Here: 6.0% city: 8.2%
- Percentage of males in business and financial operations occupations:
Here: 1.8% city: 4.4%
- Percentage of males in computer and mathematical occupations:
Here: 3.4% city: 4.2%
- Percentage of males in architecture and engineering occupations:
Here: 6.7% city: 3.7%
- Percentage of males in community and social services occupations:
Here: 3.3% city: 1.3%
- Percentage of males in legal occupations:
Here: 1.7% city: 1.0%
- Percentage of males in education, training, and library occupations:
Here: 2.4% city: 3.9%
- Percentage of males in arts, design, entertainment, sports, and media occupations:
Here: 1.8% city: 2.2%
- Percentage of males in healthcare practitioners and technical occupations:
Here: 5.3% city: 3.2%
- Percentage of males in service occupations:
Here: 7.9% city: 16.9%
- Percentage of males in sales and office occupations:
Here: 32.9% city: 15.6%
- Percentage of males in construction, extraction, and maintenance occupations:
Here: 5.9% city: 9.8%
- Percentage of males in production occupations:
Here: 7.1% city: 6.5%
- Percentage of males in transportation occupations:
Here: 7.1% city: 5.3%
Occupations of females:
- Percentage of females in management occupations (except farmers):
Here: 4.9% city: 7.7%
- Percentage of females in business and financial operations occupations:
Here: 1.2% city: 5.2%
- Percentage of females in architecture and engineering occupations:
Here: 2.7% city: 1.0%
- Percentage of females in life, physical, and social science occupations:
Here: 3.7% city: 0.9%
- Percentage of females in community and social services occupations:
Here: 3.7% city: 3.1%
- Percentage of females in education, training, and library occupations:
Here: 10.5% city: 9.1%
- Percentage of females in healthcare practitioners and technical occupations:
Here: 6.7% city: 9.6%
- Percentage of females in service occupations:
Here: 14.4% city: 22.3%
- Percentage of females in sales and office occupations:
Here: 40.1% city: 28.7%
- Percentage of females in transportation occupations:
Here: 2.6% city: 1.6%
- Percentage of females in material moving occupations:
Here: 8.4% city: 2.4%
Percentage of people 16-64 in Armed Forces:
| Cottage Line: | 9.5% |
| Norfolk: | 15.8% |
Education in this neighborhood (subdivision or community):
- Percentage of people 3 years and older in K-12 schools:
Cottage Line: 21.1% Norfolk: 14.3%
- Percentage of people 3 years and older in undergraduate colleges:
Cottage Line: 5.7% Norfolk: 8.0%
- Percentage of people 3 years and older in grad. or professional schools:
Cottage Line: 2.1% Norfolk: 2.1%
- Percentage of students K-12 enrolled in private schools:
Cottage Line: 20.6% Norfolk: 16.2%
Percentage of population below poverty level:
| Cottage Line: | 12.2% |
| Norfolk: | 17.7% |
Median year owner moved in (as recorded in 2022):
Median year renter moved in (as recorded in 2022):
| Cottage Line: | 2012 |
| Norfolk: | 2013 |
Median year renter moved in (as recorded in 2022):
| Cottage Line: | 2017 |
| Norfolk: | 2020 |
Percentage of married-couple families with both working:
| Cottage Line: | 92.6% |
| Norfolk: | 65.5% |

- 54.3%Electricity
- 36.3%Utility gas
- 3.5%Bottled, tank, or LP gas
- 2.4%Fuel oil, kerosene, etc.
- 2.1%No fuel used
- 1.5%Other fuel
Highways in this neighborhood:
US Hwy 60 (E Ocean View Ave)
Length: 2.12 miles
Directions: E-W, SE-NW
Address range: 666 to 2099
Directions: E-W, SE-NW
Address range: 666 to 2099
Roads and streets:
Cottage Pl
Length: 0.10 miles
Direction: SE-NW
Address range: 1100 to 1199
Direction: SE-NW
Address range: 1100 to 1199
Beach View St Exd
Length: 0.08 miles
Direction: SW-NE
Direction: SW-NE
Cape View Ave
Length: 0.06 miles
Direction: SW-NE
Address range: 9700 to 9799
Direction: SW-NE
Address range: 9700 to 9799
Grove Ave
Length: 0.05 miles
Direction: N-S
Direction: N-S
Chesapeake St
Length: 0.04 miles
Directions: E-W, SE-NW, SW-NE
Address range: 9700 to 9799
Directions: E-W, SE-NW, SW-NE
Address range: 9700 to 9799
Inlet Rd
Length: 0.04 miles
Directions: N-S, SW-NE
Address range: 9700 to 9799
Directions: N-S, SW-NE
Address range: 9700 to 9799