East Fairmont neighborhood in Norfolk, Virginia (VA), 23513 detailed profile
Settings
X


Business Search - 14 Million verified businesses
Area: 0.037 square miles
Population: 258
Population density:
| East Fairmont: | 6,951 people per square mile |
| Norfolk: | 4,337 people per square mile |

- 13450.4%Black
- 6925.9%White
- 2710.2%Hispanic or Latino
- 269.8%Two or more races
- 93.4%Asian
- 10.4%Native Hawaiian and Other
Pacific Islander

Median household income in 2022:
| East Fairmont: | $79,182 |
| Norfolk: | $61,090 |
Distribution of median household income
![Distribution of median household income]()
- 2Less than $10,000
- 8$10,000 to $19,999
- 6$20,000 to $29,999
- 15$30,000 to $39,999
- 4$40,000 to $49,999
- 3$50,000 to $59,999
- 14$60,000 to $74,999
- 13$75,000 to $99,999
- 8$100,000 to $124,999
- 2$125,000 to $149,999
- 2$150,000 to $199,999
- 11$200,000 or more

Distribution of owner-occupied house/condo value
![Distribution of owner-occupied house/condo value]()
- 14Less than $50,000
- 11$50,000 to $99,999
- 13$100,000 to $149,999
- 18$150,000 to $199,999
- 7$200,000 to $249,999
- 10$250,000 to $299,999
- 10$300,000 to $399,999

Distribution of rent paid by renters
![Distribution of rent paid by renters]()
- 5$300 to $399
- 2$500 to $599
- 3$600 to $699
- 6$700 to $799
- 6$800 to $899
- 3$900 to $999
- 17$1,000 to $1,249
- 3$1,250 to $1,499
- 1$1,500 to $1,999
- 2$2,000 or more

Median rent in 2022:
| East Fairmont: | $1,142 |
| Norfolk: | $1,035 |
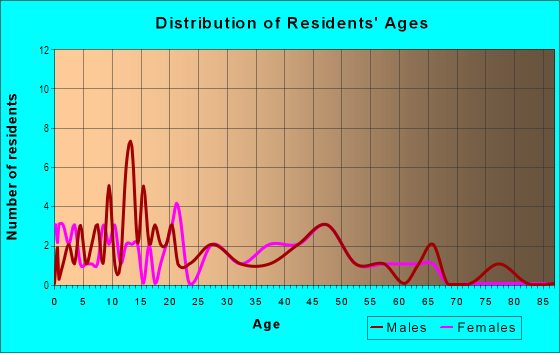
| Males: | 127 |
| Females: | 130 |
Males:
| This neighborhood: | 30.1 years |
| Whole city: | 31.3 years |
| This neighborhood: | 33.3 years |
| Whole city: | 34.4 years |
Average household size:
| East Fairmont: | 2.7 people |
| Norfolk: | 2.3 people |
Percentage of family households:
| East Fairmont: | 65.4% |
| Norfolk: | 41.3% |
| Here: | 42.4% |
| Norfolk: | 31.7% |
Percentage of married-couple families with children (among all households):
| East Fairmont: | 11.0% |
| Norfolk: | 20.2% |
Percentage of single-mother households (among all households):
| East Fairmont: | 8.7% |
| Norfolk: | 16.3% |
Percentage of never married males 15 years old and over:
Percentage of never married females 15 years old and over:
| East Fairmont: | 19.2% |
| Norfolk: | 25.4% |
Percentage of never married females 15 years old and over:
| East Fairmont: | 16.8% |
| city: | 20.5% |
Percentage of people that speak English not well or not at all:
| East Fairmont: | 0.9% |
| Norfolk: | 1.4% |
Percentage of people born in this state:
Percentage of people born in another U.S. state:
Percentage of native residents but born outside the U.S.:
Percentage of foreign born residents:
| Here: | 56.2% |
| Norfolk: | 51.1% |
Percentage of people born in another U.S. state:
| East Fairmont: | 34.7% |
| Norfolk: | 40.8% |
Percentage of native residents but born outside the U.S.:
| Here: | 1.3% |
| city: | 1.6% |
Percentage of foreign born residents:
| Here: | 7.8% |
| Norfolk: | 6.5% |

Owner-occupied
Renter-occupied


- Rooms in owner-occupied houses and condos in East Fairmont
- 01 room
- 02 rooms
- 13 rooms
- 104 rooms
- 135 rooms
- 156 rooms
- 117 rooms
- 98 rooms
- 139+ rooms

- Rooms in renter-occupied apartments in East Fairmont
- 01 room
- 02 rooms
- 23 rooms
- 64 rooms
- 25 rooms
- 76 rooms
- 17 rooms
- 08 rooms
- 09+ rooms
Owner-occupied
Renter-occupied

- Bedrooms in owner-occupied houses and condos in East Fairmont
- 0no bedroom
- 01 bedroom
- 92 bedrooms
- 313 bedrooms
- 104 bedrooms
- 105+ bedrooms

- Bedrooms in renter-occupied apartments in East Fairmont
- 0no bedroom
- 41 bedroom
- 102 bedrooms
- 73 bedrooms
- 14 bedrooms
- 05+ bedrooms
Average number of cars or other vehicles available in houses/condos:
Average number of cars or other vehicles available in apartments:
| This neighborhood: | 2.4 |
| Norfolk: | 2.0 |
Average number of cars or other vehicles available in apartments:
| Here: | 1.6 |
| city: | 1.3 |
Percentage of units with a mortgage:
| East Fairmont: | 77.0% |
| Norfolk: | 70.0% |
Average estimated value of detached houses in 2022 (83.0% of all units):
| East Fairmont: | $185,294 |
| Norfolk: | $337,508 |

- Year house built in East Fairmont
- 02020 or later
- 92010 to 2019
- 122000 to 2009
- 11990 to 1999
- 111980 to 1989
- 151970 to 1979
- 51960 to 1969
- 121950 to 1959
- 241940 to 1949
- 301939 or earlier

City-data.com crime index for city in 2020 (higher means more crime):
| City: | 327.9 |
| U.S. average: | 219.5 |
Travel time to work (commute)
![Travel time to work (commute)]()
- 1Less than 5 minutes
- 35 to 9 minutes
- 1310 to 14 minutes
- 3315 to 19 minutes
- 1420 to 24 minutes
- 625 to 29 minutes
- 3330 to 34 minutes
- 435 to 39 minutes
- 645 to 59 minutes
- 190 or more minutes

Means of transportation to work
![Means of transportation to work]()
- 82.3%112Drove a car alone
- 15.4%21Carpooled
- 0.7%1Bus
- 1.5%2Walked
- 2.9%4Other means
- 3.7%5Worked at home

Time leaving home to go to work
![Time leaving home to go to work]()
- 512:00 a.m. to 4:59 a.m.
- 175:00 a.m. to 5:29 a.m.
- 55:30 a.m. to 5:59 a.m.
- 256:00 a.m. to 6:29 a.m.
- 76:30 a.m. to 6:59 a.m.
- 147:00 a.m. to 7:29 a.m.
- 87:30 a.m. to 7:59 a.m.
- 48:00 a.m. to 8:29 a.m.
- 38:30 a.m. to 8:59 a.m.
- 99:00 a.m. to 9:59 a.m.
- 512:00 p.m. to 3:59 p.m.
- 114:00 p.m. to 11:59 p.m.

Occupations of males:
- Percentage of males in management occupations (except farmers):
Here: 4.5% city: 8.2%
- Percentage of males in architecture and engineering occupations:
Here: 5.4% city: 3.7%
- Percentage of males in life, physical, and social science occupations:
Here: 1.2% city: 1.2%
- Percentage of males in community and social services occupations:
Here: 6.1% city: 1.3%
- Percentage of males in service occupations:
Here: 21.4% city: 16.9%
- Percentage of males in sales and office occupations:
Here: 10.6% city: 15.6%
- Percentage of males in construction, extraction, and maintenance occupations:
Here: 10.6% city: 9.8%
- Percentage of males in production occupations:
Here: 14.1% city: 6.5%
Occupations of females:
- Percentage of females in management occupations (except farmers):
Here: 20.2% city: 7.7%
- Percentage of females in business and financial operations occupations:
Here: 14.5% city: 5.2%
- Percentage of females in community and social services occupations:
Here: 1.8% city: 3.1%
- Percentage of females in education, training, and library occupations:
Here: 10.2% city: 9.1%
- Percentage of females in service occupations:
Here: 27.0% city: 22.3%
- Percentage of females in sales and office occupations:
Here: 26.4% city: 28.7%
Percentage of people 16-64 in Armed Forces:
| East Fairmont: | 7.2% |
| Norfolk: | 15.8% |
Education in this neighborhood (subdivision or community):
- Percentage of people 3 years and older in K-12 schools:
East Fairmont: 16.0% Norfolk: 14.3%
- Percentage of people 3 years and older in undergraduate colleges:
East Fairmont: 3.4% Norfolk: 8.0%
- Percentage of people 3 years and older in grad. or professional schools:
East Fairmont: 1.7% Norfolk: 2.1%
- Percentage of students K-12 enrolled in private schools:
East Fairmont: 5.3% Norfolk: 16.2%
Percentage of population below poverty level:
| East Fairmont: | 13.0% |
| Norfolk: | 17.7% |
Median year owner moved in (as recorded in 2022):
Median year renter moved in (as recorded in 2022):
| East Fairmont: | 2007 |
| Norfolk: | 2013 |
Median year renter moved in (as recorded in 2022):
| East Fairmont: | 2018 |
| Norfolk: | 2020 |
Percentage of married-couple families with both working:
| East Fairmont: | 87.1% |
| Norfolk: | 65.5% |

- 55.9%Electricity
- 39.5%Utility gas
- 2.4%Fuel oil, kerosene, etc.
- 2.2%Other fuel
Roads and streets:
Lafayette Blvd
Length: 0.18 miles
Direction: E-W
Address range: 3500 to 3699
Direction: E-W
Address range: 3500 to 3699
Upshur St
Length: 0.18 miles
Direction: E-W
Address range: 3500 to 3641
Direction: E-W
Address range: 3500 to 3641
Oklahoma Ave
Length: 0.12 miles
Direction: N-S
Address range: 3100 to 3199
Direction: N-S
Address range: 3100 to 3199
Montana Ave
Length: 0.12 miles
Direction: N-S
Address range: 3100 to 3199
Direction: N-S
Address range: 3100 to 3199
Kansas Ave
Length: 0.12 miles
Direction: N-S
Address range: 3100 to 3199
Direction: N-S
Address range: 3100 to 3199
Illinois Ave
Length: 0.11 miles
Direction: N-S
Address range: 3100 to 3199
Direction: N-S
Address range: 3100 to 3199