Ellwood Park (Monument) neighborhood in Baltimore, Maryland (MD), 21224, 21205 detailed profile
Settings
X

Business Search - 14 Million verified businesses
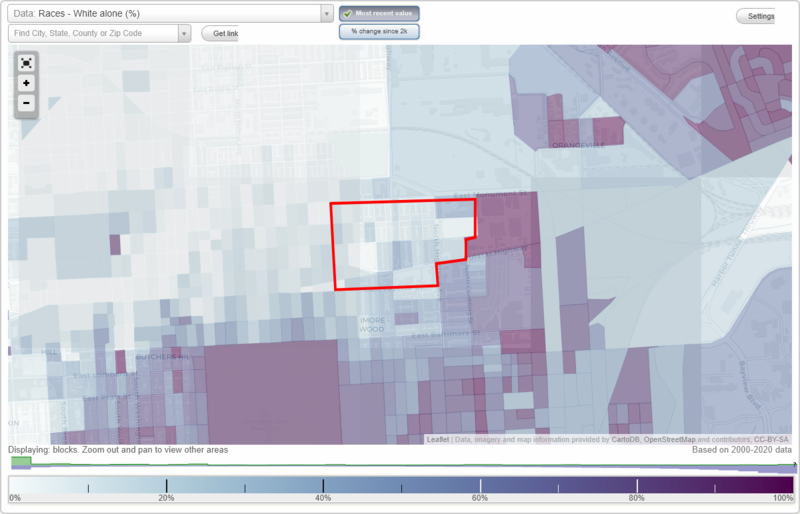
Area: 0.131 square miles
Population: 2,103
Population density:
| Ellwood Park (Monument): | 16,035 people per square mile |
| Baltimore: | 7,053 people per square mile |

- 1,19048.0%Black
- 51220.6%Hispanic or Latino
- 37115.0%Two or more races
- 2118.5%White
- 1295.2%Some other race
- 471.9%Asian
- 170.7%American Indian
- 30.1%Native Hawaiian and Other
Pacific Islander

Distribution of median household income
![Distribution of median household income]()
- 76Less than $10,000
- 191$10,000 to $19,999
- 190$20,000 to $29,999
- 327$30,000 to $39,999
- 91$40,000 to $49,999
- 120$50,000 to $59,999
- 8$60,000 to $74,999
- 73$75,000 to $99,999
- 85$100,000 to $124,999
- 11$125,000 to $149,999
- 86$150,000 to $199,999
- 119$200,000 or more

Distribution of owner-occupied house/condo value
![Distribution of owner-occupied house/condo value]()
- 121Less than $50,000
- 323$50,000 to $99,999
- 164$100,000 to $149,999
- 91$150,000 to $199,999
- 70$200,000 to $249,999
- 10$250,000 to $299,999
- 33$300,000 to $399,999
- 61$400,000 to $499,999
- 11$500,000 to $749,999

Distribution of rent paid by renters
![Distribution of rent paid by renters]()
- 30Less than $100
- 156$100 to $199
- 33$200 to $299
- 11$300 to $399
- 14$400 to $499
- 42$500 to $599
- 19$600 to $699
- 14$700 to $799
- 213$800 to $899
- 30$900 to $999
- 117$1,000 to $1,249
- 189$1,250 to $1,499
- 48$1,500 to $1,999
- 30$2,000 or more

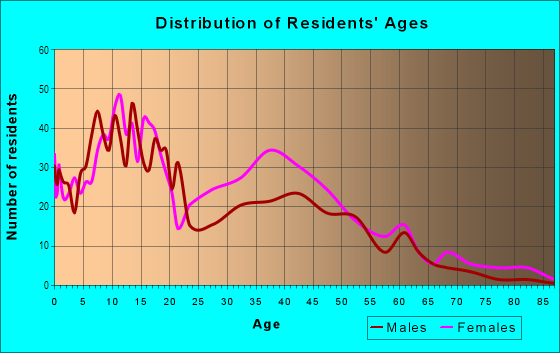
| Males: | 1,132 |
| Females: | 971 |
Males:
| This neighborhood: | 40.8 years |
| Whole city: | 35.0 years |
| This neighborhood: | 45.6 years |
| Whole city: | 38.2 years |
Average household size:
| Ellwood Park (Monument): | 11.0 people |
| Baltimore: | 2.2 people |
Percentage of family households:
| Ellwood Park (Monument): | 46.1% |
| Baltimore: | 34.2% |
| Here: | 30.8% |
| Baltimore: | 23.3% |
Percentage of married-couple families with children (among all households):
| Ellwood Park (Monument): | 19.6% |
| Baltimore: | 22.4% |
Percentage of single-mother households (among all households):
| Ellwood Park (Monument): | 17.6% |
| Baltimore: | 18.7% |
Percentage of never married males 15 years old and over:
Percentage of never married females 15 years old and over:
| Ellwood Park (Monument): | 28.5% |
| Baltimore: | 25.1% |
Percentage of never married females 15 years old and over:
| Ellwood Park (Monument): | 20.8% |
| city: | 27.5% |
Percentage of people that speak English not well or not at all:
| Ellwood Park (Monument): | 9.4% |
| Baltimore: | 2.3% |
Percentage of people born in this state:
Percentage of people born in another U.S. state:
Percentage of native residents but born outside the U.S.:
Percentage of foreign born residents:
| Here: | 55.7% |
| Baltimore: | 64.4% |
Percentage of people born in another U.S. state:
| Ellwood Park (Monument): | 30.4% |
| Baltimore: | 25.0% |
Percentage of native residents but born outside the U.S.:
| Here: | 2.6% |
| city: | 0.9% |
Percentage of foreign born residents:
| Here: | 11.8% |
| Baltimore: | 9.7% |
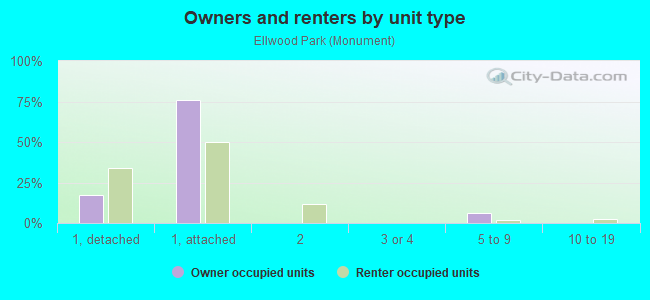
Owner-occupied
Renter-occupied

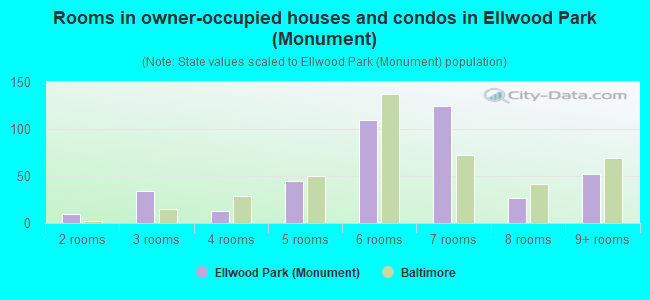
- Rooms in owner-occupied houses and condos in Ellwood Park <
> - 01 room
- 102 rooms
- 343 rooms
- 134 rooms
- 455 rooms
- 1106 rooms
- 1257 rooms
- 278 rooms
- 529+ rooms
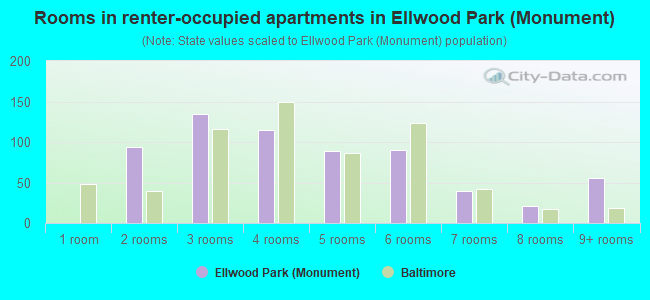
- Rooms in renter-occupied apartments in Ellwood Park <
> - 01 room
- 942 rooms
- 1353 rooms
- 1154 rooms
- 895 rooms
- 906 rooms
- 397 rooms
- 218 rooms
- 569+ rooms
Owner-occupied
Renter-occupied
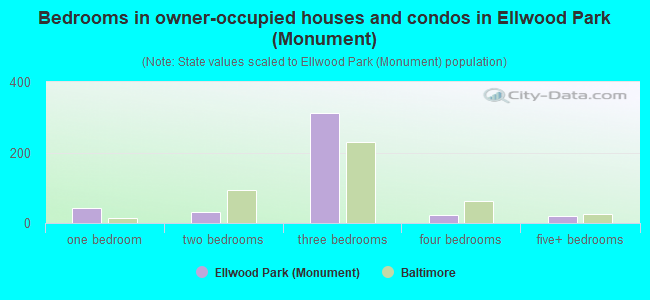
- Bedrooms in owner-occupied houses and condos in Ellwood Park <
> - 0no bedroom
- 421 bedroom
- 312 bedrooms
- 3123 bedrooms
- 244 bedrooms
- 195+ bedrooms
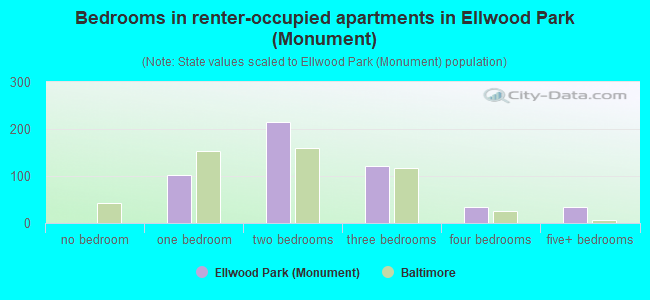
- Bedrooms in renter-occupied apartments in Ellwood Park <
> - 0no bedroom
- 1031 bedroom
- 2142 bedrooms
- 1223 bedrooms
- 334 bedrooms
- 335+ bedrooms
Average number of cars or other vehicles available in houses/condos:
Average number of cars or other vehicles available in apartments:
| This neighborhood: | 1.3 |
| Baltimore: | 1.5 |
Average number of cars or other vehicles available in apartments:
| Here: | |
| city: |
Percentage of units with a mortgage:
| Ellwood Park (Monument): | 59.7% |
| Baltimore: | 64.3% |
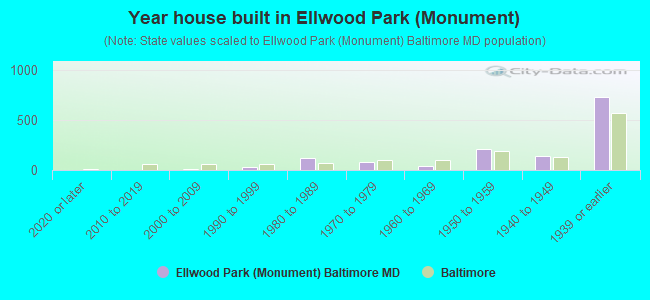
- Year house built in Ellwood Park <
> - 02020 or later
- 02010 to 2019
- 62000 to 2009
- 261990 to 1999
- 1241980 to 1989
- 751970 to 1979
- 391960 to 1969
- 2081950 to 1959
- 1421940 to 1949
- 7261939 or earlier
Travel time to work (commute)
![Travel time to work (commute)]()
- 43Less than 5 minutes
- 575 to 9 minutes
- 4210 to 14 minutes
- 24415 to 19 minutes
- 17020 to 24 minutes
- 5825 to 29 minutes
- 13930 to 34 minutes
- 3235 to 39 minutes
- 1640 to 44 minutes
- 15045 to 59 minutes
- 4460 to 89 minutes
- 8190 or more minutes

Means of transportation to work
![Means of transportation to work]()
- 46.1%297Drove a car alone
- 12.7%82Carpooled
- 33.8%218Bus
- 4.5%29Subway or elevated rail
- 14.0%90Long-distance train or commuter rail
- 10.4%67Taxi
- 2.2%14Bicycle
- 23.0%148Walked
- 1.4%9Other means
- 20.2%130Worked at home

Time leaving home to go to work
![Time leaving home to go to work]()
- 9812:00 a.m. to 4:59 a.m.
- 765:00 a.m. to 5:29 a.m.
- 195:30 a.m. to 5:59 a.m.
- 686:00 a.m. to 6:29 a.m.
- 816:30 a.m. to 6:59 a.m.
- 2277:00 a.m. to 7:29 a.m.
- 1607:30 a.m. to 7:59 a.m.
- 998:00 a.m. to 8:29 a.m.
- 978:30 a.m. to 8:59 a.m.
- 689:00 a.m. to 9:59 a.m.
- 1210:00 a.m. to 10:59 a.m.
- 511:00 a.m. to 11:59 a.m.
- 2612:00 p.m. to 3:59 p.m.
- 294:00 p.m. to 11:59 p.m.

Occupations of males:
- Percentage of males in management occupations (except farmers):
Here: 4.0% city: 10.7%
- Percentage of males in business and financial operations occupations:
Here: 8.0% city: 5.9%
- Percentage of males in computer and mathematical occupations:
Here: 3.6% city: 6.1%
- Percentage of males in architecture and engineering occupations:
Here: 6.1% city: 2.9%
- Percentage of males in life, physical, and social science occupations:
Here: 7.2% city: 2.3%
- Percentage of males in legal occupations:
Here: 1.6% city: 1.8%
- Percentage of males in education, training, and library occupations:
Here: 3.5% city: 5.4%
- Percentage of males in arts, design, entertainment, sports, and media occupations:
Here: 9.8% city: 2.8%
- Percentage of males in service occupations:
Here: 11.1% city: 14.7%
- Percentage of males in sales and office occupations:
Here: 3.8% city: 14.2%
- Percentage of males in construction, extraction, and maintenance occupations:
Here: 10.7% city: 5.6%
- Percentage of males in production occupations:
Here: 14.5% city: 4.2%
- Percentage of males in transportation occupations:
Here: 28.3% city: 6.8%
- Percentage of males in material moving occupations:
Here: 21.0% city: 7.0%
Occupations of females:
- Percentage of females in management occupations (except farmers):
Here: 12.0% city: 10.1%
- Percentage of females in business and financial operations occupations:
Here: 9.0% city: 6.6%
- Percentage of females in architecture and engineering occupations:
Here: 2.9% city: 0.9%
- Percentage of females in community and social services occupations:
Here: 2.2% city: 3.6%
- Percentage of females in education, training, and library occupations:
Here: 2.1% city: 10.7%
- Percentage of females in healthcare practitioners and technical occupations:
Here: 2.0% city: 9.8%
- Percentage of females in service occupations:
Here: 50.6% city: 20.4%
- Percentage of females in sales and office occupations:
Here: 22.4% city: 22.3%
- Percentage of females in production occupations:
Here: 10.0% city: 2.3%
- Percentage of females in transportation occupations:
Here: 5.2% city: 1.7%
- Percentage of females in material moving occupations:
Here: 5.7% city: 1.9%
Percentage of people 16-64 in Armed Forces:
| Ellwood Park (Monument): | 0.3% |
| Baltimore: | 0.4% |
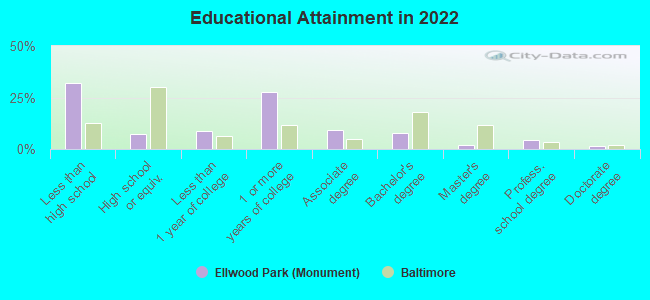
Education in this neighborhood (subdivision or community):
- Percentage of people 3 years and older in K-12 schools:
Ellwood Park (Monument): 45.3% Baltimore: 14.7%
- Percentage of people 3 years and older in undergraduate colleges:
Ellwood Park (Monument): 13.0% Baltimore: 6.0%
- Percentage of people 3 years and older in grad. or professional schools:
Ellwood Park (Monument): 4.3% Baltimore: 2.8%
- Percentage of students K-12 enrolled in private schools:
Ellwood Park (Monument): 24.7% Baltimore: 12.7%
Percentage of population below poverty level:
| Ellwood Park (Monument): | 25.1% |
| Baltimore: | 18.5% |
Percentage of married-couple families with both working:
| Ellwood Park (Monument): | 53.8% |
| Baltimore: | 79.2% |
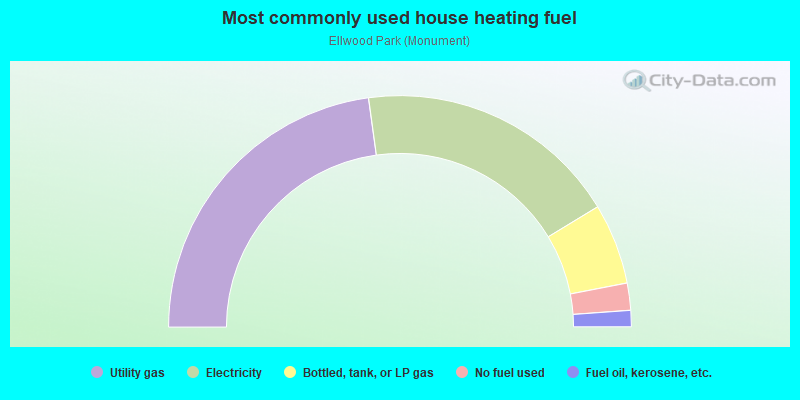
- 45.7%Utility gas
- 37.0%Electricity
- 11.3%Bottled, tank, or LP gas
- 3.8%No fuel used
- 2.3%Fuel oil, kerosene, etc.
Highways in this neighborhood:
US Hwy 40 (Orleans St)
Length: 0.15 miles
Direction: E-W
Address range: 2910 to 3099
Direction: E-W
Address range: 2910 to 3099
Roads and streets:
Pulaski Hwy
Length: 0.55 miles
Direction: E-W
Address range: 2911 to 3599
Direction: E-W
Address range: 2911 to 3599
Jefferson St
Length: 0.54 miles
Direction: E-W
Address range: 2910 to 3417
Direction: E-W
Address range: 2910 to 3417
Mc Elderry St
Length: 0.45 miles
Direction: E-W
Address range: 2920 to 3533
Direction: E-W
Address range: 2920 to 3533
N East Ave
Length: 0.23 miles
Direction: N-S
Address range: 200 to 599
Direction: N-S
Address range: 200 to 599
N Curley St
Length: 0.19 miles
Direction: N-S
Address range: 200 to 599
Direction: N-S
Address range: 200 to 599
N Potomac St
Length: 0.19 miles
Direction: N-S
Address range: 200 to 599
Direction: N-S
Address range: 200 to 599
N Ellwood Ave
Length: 0.17 miles
Direction: N-S
Address range: 300 to 599
Direction: N-S
Address range: 300 to 599
N Robinson St
Length: 0.17 miles
Direction: N-S
Address range: 300 to 599
Direction: N-S
Address range: 300 to 599
Loneys Ln
Length: 0.17 miles
Direction: N-S
Address range: 300 to 399
Direction: N-S
Address range: 300 to 399
N Bouldin St
Length: 0.16 miles
Direction: N-S
Address range: 400 to 599
Direction: N-S
Address range: 400 to 599
N Clinton St
Length: 0.16 miles
Direction: N-S
Address range: 400 to 599
Direction: N-S
Address range: 400 to 599
N Highland Ave
Length: 0.15 miles
Direction: N-S
Address range: 400 to 599
Direction: N-S
Address range: 400 to 599
E Fayette St
Length: 0.15 miles
Direction: E-W
Address range: 3201 to 3341
Direction: E-W
Address range: 3201 to 3341
N Conkling St
Length: 0.07 miles
Direction: N-S
Address range: 400 to 499
Direction: N-S
Address range: 400 to 499
N Decker Ave
Length: 0.07 miles
Direction: N-S
Address range: 500 to 599
Direction: N-S
Address range: 500 to 599