Glenmont Hills neighborhood in Silver Spring, Maryland (MD), 20902, 20906 detailed profile
Settings
X


Business Search - 14 Million verified businesses
Area: 0.426 square miles
Population: 2,863
Population density:
| Glenmont Hills: | 6,716 people per square mile |
| Silver Spring: | 7,993 people per square mile |

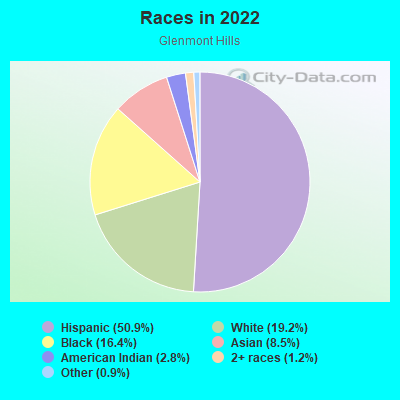
- 1,50450.9%Hispanic or Latino
- 56619.2%White
- 48416.4%Black
- 2518.5%Asian
- 842.8%American Indian
- 361.2%Two or more races
- 280.9%Some other race
Median household income in 2022:
| Glenmont Hills: | $114,458 |
| Silver Spring: | $81,557 |
Distribution of median household income
![Distribution of median household income]()
- 15Less than $10,000
- 35$10,000 to $19,999
- 80$20,000 to $29,999
- 112$30,000 to $39,999
- 69$40,000 to $49,999
- 29$50,000 to $59,999
- 69$60,000 to $74,999
- 121$75,000 to $99,999
- 111$100,000 to $124,999
- 80$125,000 to $149,999
- 127$150,000 to $199,999
- 159$200,000 or more

Distribution of owner-occupied house/condo value
![Distribution of owner-occupied house/condo value]()
- 106Less than $50,000
- 38$50,000 to $99,999
- 15$100,000 to $149,999
- 80$150,000 to $199,999
- 45$200,000 to $249,999
- 50$250,000 to $299,999
- 186$300,000 to $399,999
- 271$400,000 to $499,999
- 111$500,000 to $749,999
- 21$750,000 to $999,999
- 19$1,000,000 or more

Distribution of rent paid by renters
![Distribution of rent paid by renters]()
- 27$800 to $899
- 42$900 to $999
- 35$1,000 to $1,249
- 57$1,250 to $1,499
- 118$1,500 to $1,999
- 159$2,000 or more

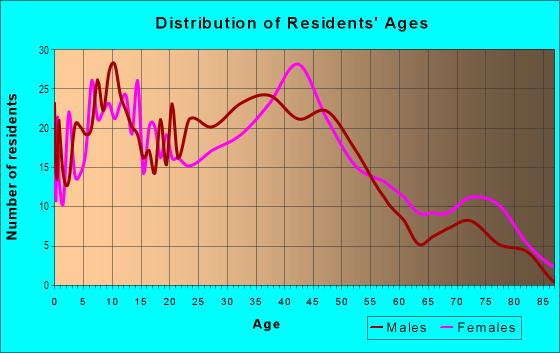
| Males: | 1,534 |
| Females: | 1,329 |
Males:
| This neighborhood: | 42.5 years |
| Whole city: | 36.7 years |
| This neighborhood: | 42.6 years |
| Whole city: | 36.5 years |
Average household size:
| Glenmont Hills: | 6.7 people |
| Silver Spring: | 2.2 people |
Percentage of family households:
| Glenmont Hills: | 52.4% |
| Silver Spring: | 38.8% |
| Here: | 56.9% |
| Silver Spring: | 32.5% |
Percentage of married-couple families with children (among all households):
| Glenmont Hills: | 23.7% |
| Silver Spring: | 34.5% |
Percentage of single-mother households (among all households):
| Glenmont Hills: | 3.6% |
| Silver Spring: | 6.6% |
Percentage of never married males 15 years old and over:
Percentage of never married females 15 years old and over:
| Glenmont Hills: | 20.7% |
| Silver Spring: | 22.2% |
Percentage of never married females 15 years old and over:
| Glenmont Hills: | 15.5% |
| place: | 24.3% |
Percentage of people that speak English not well or not at all:
| Glenmont Hills: | 9.8% |
| Silver Spring: | 9.9% |
Percentage of people born in this state:
Percentage of people born in another U.S. state:
Percentage of native residents but born outside the U.S.:
Percentage of foreign born residents:
| Here: | 28.4% |
| Silver Spring: | 19.7% |
Percentage of people born in another U.S. state:
| Glenmont Hills: | 22.2% |
| Silver Spring: | 45.9% |
Percentage of native residents but born outside the U.S.:
| Here: | 1.4% |
| place: | 2.4% |
Percentage of foreign born residents:
| Here: | 48.0% |
| Silver Spring: | 32.0% |

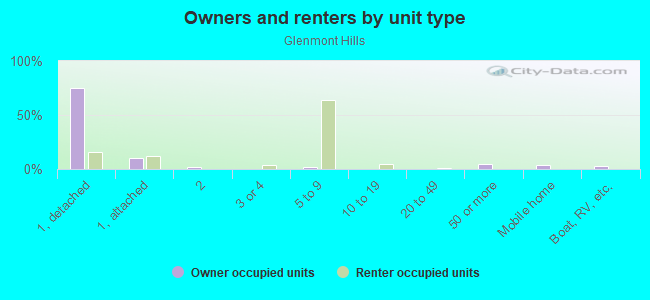
Owner-occupied
Renter-occupied

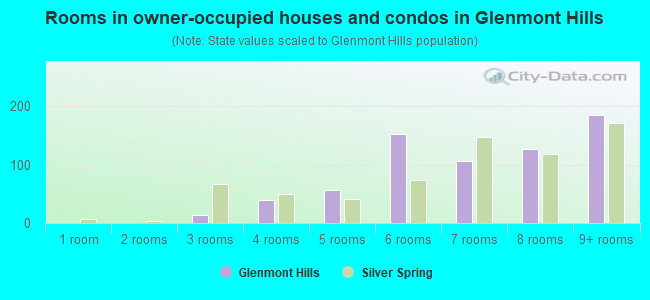
- Rooms in owner-occupied houses and condos in Glenmont Hills
- 01 room
- 02 rooms
- 133 rooms
- 394 rooms
- 565 rooms
- 1536 rooms
- 1077 rooms
- 1278 rooms
- 1859+ rooms
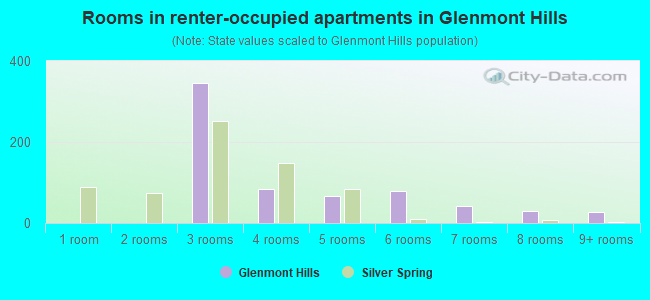
- Rooms in renter-occupied apartments in Glenmont Hills
- 01 room
- 02 rooms
- 3453 rooms
- 844 rooms
- 665 rooms
- 796 rooms
- 427 rooms
- 298 rooms
- 269+ rooms
Owner-occupied
Renter-occupied
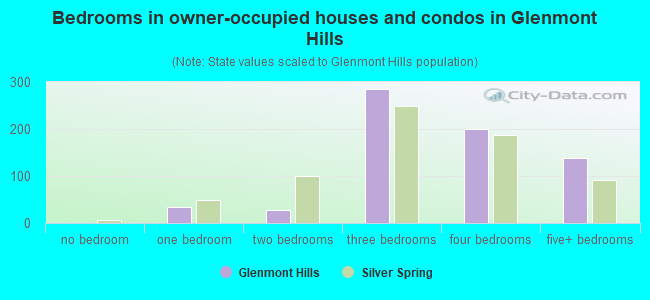
- Bedrooms in owner-occupied houses and condos in Glenmont Hills
- 0no bedroom
- 341 bedroom
- 272 bedrooms
- 2853 bedrooms
- 2014 bedrooms
- 1395+ bedrooms
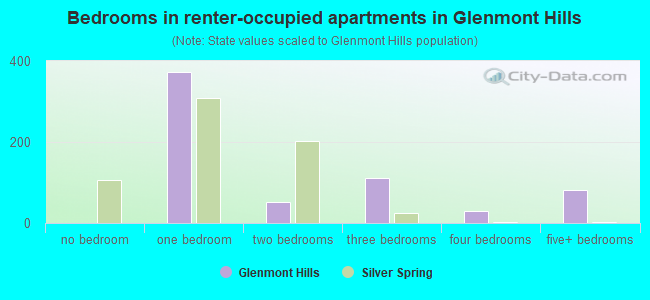
- Bedrooms in renter-occupied apartments in Glenmont Hills
- 0no bedroom
- 3721 bedroom
- 522 bedrooms
- 1123 bedrooms
- 294 bedrooms
- 825+ bedrooms
Average number of cars or other vehicles available in houses/condos:
Average number of cars or other vehicles available in apartments:
| This neighborhood: | 2.2 |
| Silver Spring: | 1.7 |
Average number of cars or other vehicles available in apartments:
| Here: | 2.1 |
| place: | 0.9 |
Percentage of units with a mortgage:
| Glenmont Hills: | 73.6% |
| Silver Spring: | 76.3% |
Average estimated value of detached houses in 2022 (87.1% of all units):
| Glenmont Hills: | $391,619 |
| Maryland: | $526,819 |
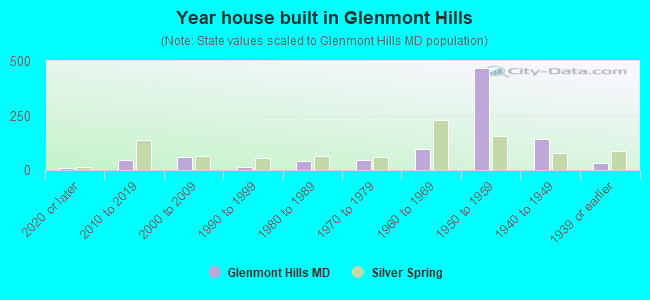
- Year house built in Glenmont Hills
- 92020 or later
- 442010 to 2019
- 582000 to 2009
- 161990 to 1999
- 391980 to 1989
- 461970 to 1979
- 971960 to 1969
- 4661950 to 1959
- 1421940 to 1949
- 341939 or earlier
Travel time to work (commute)
![Travel time to work (commute)]()
- 17Less than 5 minutes
- 565 to 9 minutes
- 9710 to 14 minutes
- 25715 to 19 minutes
- 20020 to 24 minutes
- 16925 to 29 minutes
- 27630 to 34 minutes
- 11735 to 39 minutes
- 11540 to 44 minutes
- 22945 to 59 minutes
- 20860 to 89 minutes
- 7390 or more minutes

Means of transportation to work
![Means of transportation to work]()
- 56.4%946Drove a car alone
- 11.3%190Carpooled
- 7.0%117Bus
- 7.0%117Subway or elevated rail
- 1.4%23Long-distance train or commuter rail
- 0.5%8Light rail, streetcar or trolley
- 3.9%65Taxi
- 4.5%76Walked
- 0.8%14Other means
- 11.2%188Worked at home

Time leaving home to go to work
![Time leaving home to go to work]()
- 5012:00 a.m. to 4:59 a.m.
- 1365:00 a.m. to 5:29 a.m.
- 1235:30 a.m. to 5:59 a.m.
- 2616:00 a.m. to 6:29 a.m.
- 996:30 a.m. to 6:59 a.m.
- 3827:00 a.m. to 7:29 a.m.
- 1287:30 a.m. to 7:59 a.m.
- 1818:00 a.m. to 8:29 a.m.
- 1168:30 a.m. to 8:59 a.m.
- 1569:00 a.m. to 9:59 a.m.
- 9110:00 a.m. to 10:59 a.m.
- 3211:00 a.m. to 11:59 a.m.
- 6412:00 p.m. to 3:59 p.m.
- 824:00 p.m. to 11:59 p.m.

Occupations of males:
- Percentage of males in management occupations (except farmers):
Here: 4.2% place: 11.4%
- Percentage of males in business and financial operations occupations:
Here: 3.1% place: 6.8%
- Percentage of males in computer and mathematical occupations:
Here: 7.7% place: 9.4%
- Percentage of males in architecture and engineering occupations:
Here: 4.3% place: 4.5%
- Percentage of males in life, physical, and social science occupations:
Here: 2.2% place: 5.3%
- Percentage of males in community and social services occupations:
Here: 2.3% place: 1.2%
- Percentage of males in education, training, and library occupations:
Here: 3.5% place: 6.2%
- Percentage of males in arts, design, entertainment, sports, and media occupations:
Here: 1.1% place: 3.9%
- Percentage of males in healthcare practitioners and technical occupations:
Here: 1.6% place: 2.5%
- Percentage of males in service occupations:
Here: 17.1% place: 10.9%
- Percentage of males in sales and office occupations:
Here: 12.9% place: 9.6%
- Percentage of males in construction, extraction, and maintenance occupations:
Here: 22.6% place: 11.6%
- Percentage of males in production occupations:
Here: 3.6% place: 2.2%
- Percentage of males in transportation occupations:
Here: 3.8% place: 6.4%
- Percentage of males in material moving occupations:
Here: 4.4% place: 2.2%
Occupations of females:
- Percentage of females in management occupations (except farmers):
Here: 10.1% place: 13.0%
- Percentage of females in business and financial operations occupations:
Here: 8.6% place: 8.9%
- Percentage of females in computer and mathematical occupations:
Here: 2.8% place: 5.0%
- Percentage of females in life, physical, and social science occupations:
Here: 3.0% place: 3.4%
- Percentage of females in legal occupations:
Here: 3.2% place: 4.2%
- Percentage of females in education, training, and library occupations:
Here: 4.8% place: 11.2%
- Percentage of females in arts, design, entertainment, sports, and media occupations:
Here: 2.3% place: 4.5%
- Percentage of females in healthcare practitioners and technical occupations:
Here: 4.3% place: 5.3%
- Percentage of females in service occupations:
Here: 33.4% place: 20.4%
- Percentage of females in sales and office occupations:
Here: 19.4% place: 16.7%
- Percentage of females in production occupations:
Here: 5.1% place: 0.9%
Percentage of people 16-64 in Armed Forces:
| Glenmont Hills: | 0.1% |
| Silver Spring: | 0.4% |
Education in this neighborhood (subdivision or community):
- Percentage of people 3 years and older in K-12 schools:
Glenmont Hills: 19.2% Silver Spring: 14.1%
- Percentage of people 3 years and older in undergraduate colleges:
Glenmont Hills: 6.8% Silver Spring: 3.4%
- Percentage of people 3 years and older in grad. or professional schools:
Glenmont Hills: 2.2% Silver Spring: 2.0%
- Percentage of students K-12 enrolled in private schools:
Glenmont Hills: 27.2% Silver Spring: 12.6%
Percentage of population below poverty level:
| Glenmont Hills: | 5.8% |
| Silver Spring: | 11.0% |
Median year owner moved in (as recorded in 2022):
| Glenmont Hills: | 2004 |
| Silver Spring: | 2011 |
Percentage of married-couple families with both working:
| Glenmont Hills: | 83.5% |
| Silver Spring: | 80.2% |

- 62.3%Utility gas
- 22.5%Electricity
- 4.9%Solar energy
- 3.0%No fuel used
- 2.8%Wood
- 2.6%Fuel oil, kerosene, etc.
- 1.9%Bottled, tank, or LP gas
Highways in this neighborhood:
Connecticut Ave (State Hwy 185)
Length: 0.42 miles
Direction: N-S
Address range: 12300 to 12699
Direction: N-S
Address range: 12300 to 12699
Georgia Ave (State Hwy 97)
Length: 0.28 miles
Direction: SE-NW
Address range: 12700 to 12899
Direction: SE-NW
Address range: 12700 to 12899
Roads and streets:
Weller Rd
Length: 1.00 miles
Direction: E-W
Address range: 2900 to 3699
Direction: E-W
Address range: 2900 to 3699
Randolph Rd
Length: 0.83 miles
Directions: E-W, SW-NE
Address range: 3000 to 3699
Directions: E-W, SW-NE
Address range: 3000 to 3699
Denley Rd
Length: 0.54 miles
Directions: E-W, N-S, SW-NE
Address range: 12400 to 12699
Directions: E-W, N-S, SW-NE
Address range: 12400 to 12699
Dalewood Dr
Length: 0.52 miles
Directions: E-W, N-S, SW-NE
Address range: 12400 to 12699
Directions: E-W, N-S, SW-NE
Address range: 12400 to 12699
Farthing Dr
Length: 0.49 miles
Directions: E-W, SW-NE
Address range: 3300 to 3599
Directions: E-W, SW-NE
Address range: 3300 to 3599
Harrell St
Length: 0.46 miles
Direction: E-W
Address range: 3300 to 3599
Direction: E-W
Address range: 3300 to 3599
Greenly Dr
Length: 0.40 miles
Directions: E-W, N-S, SW-NE
Address range: 3500 to 3699
Directions: E-W, N-S, SW-NE
Address range: 3500 to 3699
Valleywood Dr
Length: 0.40 miles
Directions: N-S, SE-NW
Address range: 12400 to 12799
Directions: N-S, SE-NW
Address range: 12400 to 12799
Holdridge Rd
Length: 0.39 miles
Direction: SE-NW
Address range: 12600 to 12799
Direction: SE-NW
Address range: 12600 to 12799
Goodhill Rd
Length: 0.37 miles
Directions: N-S, SE-NW
Address range: 12317 to 12699
Directions: N-S, SE-NW
Address range: 12317 to 12699
Gould Rd
Length: 0.37 miles
Directions: N-S, SE-NW, SW-NE
Address range: 12500 to 12799
Directions: N-S, SE-NW, SW-NE
Address range: 12500 to 12799
Everton St
Length: 0.37 miles
Directions: E-W, SW-NE
Address range: 3500 to 3702
Directions: E-W, SW-NE
Address range: 3500 to 3702
Farnell Dr
Length: 0.36 miles
Directions: E-W, N-S, SW-NE
Address range: 12500 to 12699
Directions: E-W, N-S, SW-NE
Address range: 12500 to 12699
Epping Rd
Length: 0.36 miles
Directions: N-S, SE-NW, SW-NE
Address range: 12600 to 12799
Directions: N-S, SE-NW, SW-NE
Address range: 12600 to 12799
Flack St
Length: 0.33 miles
Direction: SE-NW
Address range: 12700 to 12828
Direction: SE-NW
Address range: 12700 to 12828
Hathaway Dr
Length: 0.20 miles
Directions: N-S, SW-NE
Address range: 12600 to 12799
Directions: N-S, SW-NE
Address range: 12600 to 12799
Dean Rd
Length: 0.17 miles
Directions: N-S, SE-NW
Address range: 12600 to 12709
Directions: N-S, SE-NW
Address range: 12600 to 12709
Bluhill Rd
Length: 0.16 miles
Direction: N-S
Address range: 12600 to 12799
Direction: N-S
Address range: 12600 to 12799
Epping Ter
Length: 0.15 miles
Direction: SE-NW
Address range: 12700 to 12899
Direction: SE-NW
Address range: 12700 to 12899
Fredale St
Length: 0.14 miles
Directions: E-W, SE-NW
Address range: 3400 to 3499
Directions: E-W, SE-NW
Address range: 3400 to 3499
Hargo St
Length: 0.13 miles
Directions: E-W, N-S, SW-NE
Address range: 3500 to 3599
Directions: E-W, N-S, SW-NE
Address range: 3500 to 3599
Gaylor Pl
Length: 0.08 miles
Direction: E-W
Address range: 3100 to 3199
Direction: E-W
Address range: 3100 to 3199
Epping Ct
Length: 0.07 miles
Directions: N-S, SE-NW
Address range: 12500 to 12599
Directions: N-S, SE-NW
Address range: 12500 to 12599