Hillen neighborhood in Baltimore, Maryland (MD), 21218 detailed profile
Settings
X

Business Search - 14 Million verified businesses
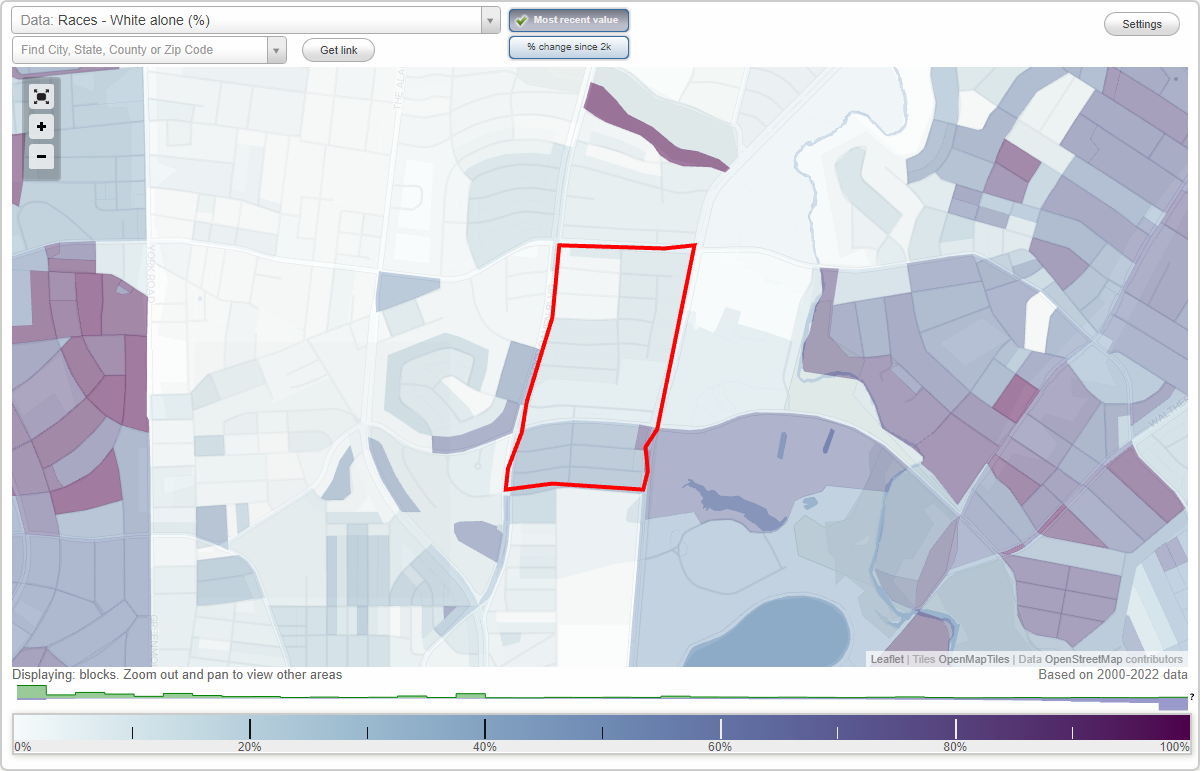
Area: 0.167 square miles
Population: 1,298
Population density:
| Hillen: | 7,758 people per square mile |
| Baltimore: | 7,053 people per square mile |

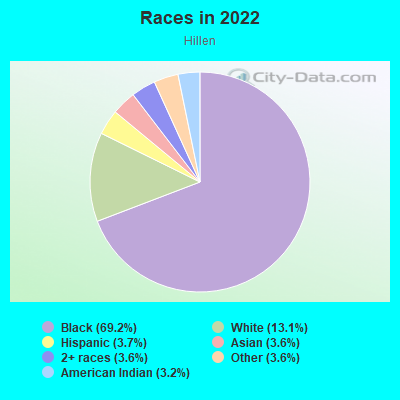
- 97069.2%Black
- 18313.1%White
- 523.7%Hispanic or Latino
- 513.6%Asian
- 503.6%Some other race
- 513.6%Two or more races
- 453.2%American Indian
Distribution of median household income
![Distribution of median household income]()
- 42Less than $10,000
- 10$10,000 to $19,999
- 16$20,000 to $29,999
- 34$30,000 to $39,999
- 82$40,000 to $49,999
- 36$50,000 to $59,999
- 36$60,000 to $74,999
- 40$75,000 to $99,999
- 27$100,000 to $124,999
- 47$125,000 to $149,999
- 23$150,000 to $199,999
- 34$200,000 or more

Distribution of owner-occupied house/condo value
![Distribution of owner-occupied house/condo value]()
- 167Less than $50,000
- 48$50,000 to $99,999
- 35$100,000 to $149,999
- 89$150,000 to $199,999
- 59$200,000 to $249,999
- 25$250,000 to $299,999
- 47$300,000 to $399,999
- 11$400,000 to $499,999
- 5$500,000 to $749,999
- 10$750,000 to $999,999
- 5$1,000,000 or more

Distribution of rent paid by renters
![Distribution of rent paid by renters]()
- 3$300 to $399
- 14$600 to $699
- 3$700 to $799
- 20$800 to $899
- 51$900 to $999
- 10$1,000 to $1,249
- 120$1,250 to $1,499
- 32$1,500 to $1,999
- 5$2,000 or more

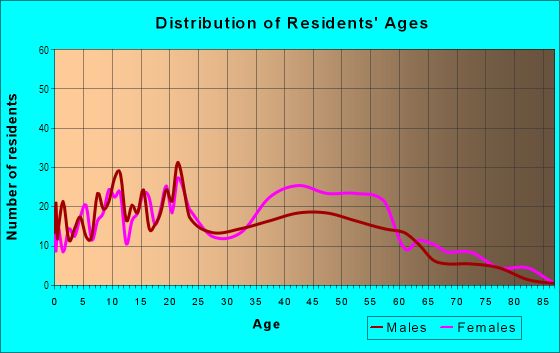
| Males: | 583 |
| Females: | 715 |
Males:
| This neighborhood: | 27.6 years |
| Whole city: | 35.0 years |
| This neighborhood: | 28.0 years |
| Whole city: | 38.2 years |
Average household size:
| Hillen: | 5.7 people |
| Baltimore: | 2.2 people |
Percentage of family households:
| Hillen: | 36.0% |
| Baltimore: | 34.2% |
| Here: | 26.9% |
| Baltimore: | 23.3% |
Percentage of married-couple families with children (among all households):
| Hillen: | 22.3% |
| Baltimore: | 22.4% |
Percentage of single-mother households (among all households):
| Hillen: | 26.4% |
| Baltimore: | 18.7% |
Percentage of never married males 15 years old and over:
Percentage of never married females 15 years old and over:
| Hillen: | 38.7% |
| Baltimore: | 25.1% |
Percentage of never married females 15 years old and over:
| Hillen: | 37.9% |
| city: | 27.5% |
Percentage of people that speak English not well or not at all:
| Hillen: | 0.3% |
| Baltimore: | 2.3% |
Percentage of people born in this state:
Percentage of people born in another U.S. state:
Percentage of native residents but born outside the U.S.:
Percentage of foreign born residents:
| Here: | 50.7% |
| Baltimore: | 64.4% |
Percentage of people born in another U.S. state:
| Hillen: | 40.2% |
| Baltimore: | 25.0% |
Percentage of native residents but born outside the U.S.:
| Here: | 1.4% |
| city: | 0.9% |
Percentage of foreign born residents:
| Here: | 7.7% |
| Baltimore: | 9.7% |
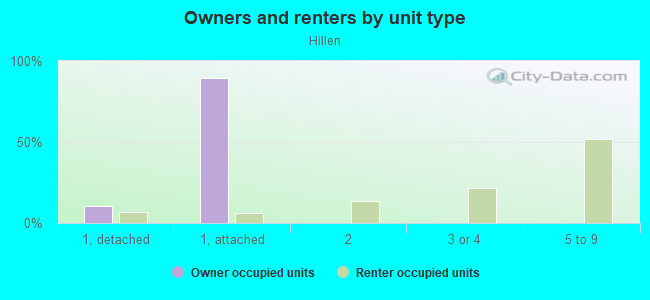
Owner-occupied
Renter-occupied

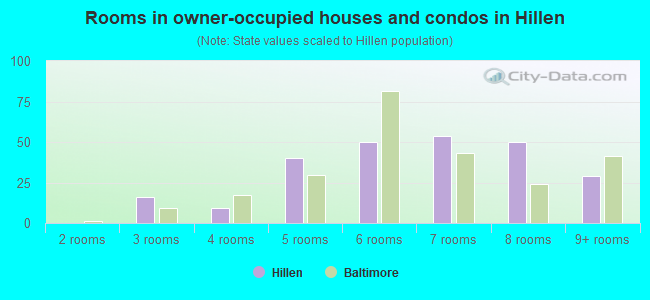
- Rooms in owner-occupied houses and condos in Hillen
- 01 room
- 02 rooms
- 163 rooms
- 94 rooms
- 405 rooms
- 506 rooms
- 547 rooms
- 508 rooms
- 299+ rooms
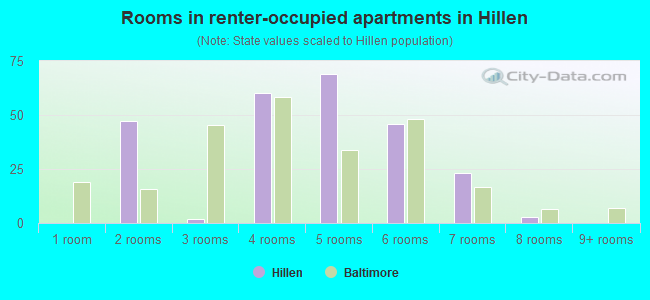
- Rooms in renter-occupied apartments in Hillen
- 01 room
- 472 rooms
- 23 rooms
- 604 rooms
- 695 rooms
- 466 rooms
- 237 rooms
- 38 rooms
- 09+ rooms
Owner-occupied
Renter-occupied
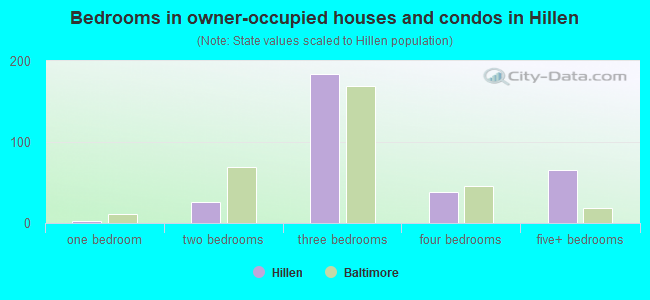
- Bedrooms in owner-occupied houses and condos in Hillen
- 0no bedroom
- 21 bedroom
- 262 bedrooms
- 1843 bedrooms
- 384 bedrooms
- 655+ bedrooms
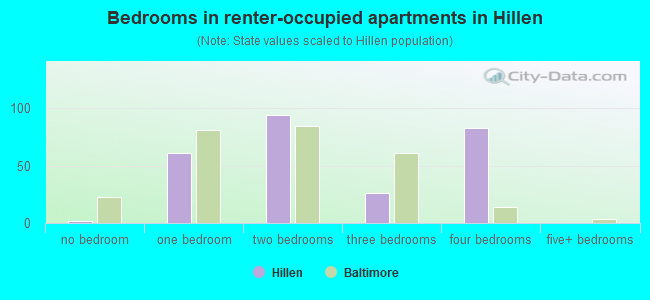
- Bedrooms in renter-occupied apartments in Hillen
- 2no bedroom
- 611 bedroom
- 942 bedrooms
- 263 bedrooms
- 834 bedrooms
- 05+ bedrooms
Average number of cars or other vehicles available in houses/condos:
Average number of cars or other vehicles available in apartments:
| This neighborhood: | 1.5 |
| Baltimore: | 1.5 |
Average number of cars or other vehicles available in apartments:
| Here: | 0.2 |
| city: | 0.8 |
Percentage of units with a mortgage:
| Hillen: | 80.0% |
| Baltimore: | 64.3% |
Average estimated value of townhouses or other attached units in 2022 (70.1% of all units):
| This neighborhood: | $193,847 |
| city: | $206,258 |
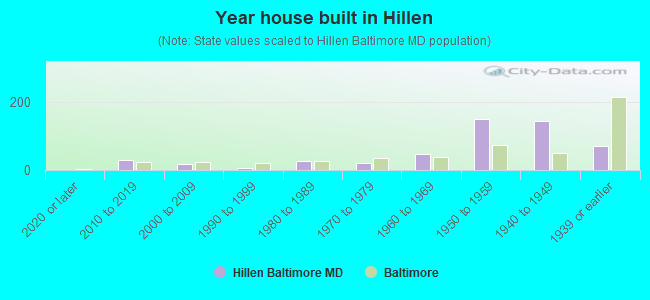
- Year house built in Hillen
- 02020 or later
- 282010 to 2019
- 172000 to 2009
- 51990 to 1999
- 271980 to 1989
- 201970 to 1979
- 481960 to 1969
- 1501950 to 1959
- 1431940 to 1949
- 711939 or earlier
Travel time to work (commute)
![Travel time to work (commute)]()
- 19Less than 5 minutes
- 955 to 9 minutes
- 3410 to 14 minutes
- 9815 to 19 minutes
- 12020 to 24 minutes
- 3825 to 29 minutes
- 5230 to 34 minutes
- 935 to 39 minutes
- 7140 to 44 minutes
- 7545 to 59 minutes
- 4860 to 89 minutes
- 1390 or more minutes

Means of transportation to work
![Means of transportation to work]()
- 52.1%282Drove a car alone
- 11.8%64Carpooled
- 15.7%85Bus
- 2.4%13Subway or elevated rail
- 0.6%3Long-distance train or commuter rail
- 0.6%3Light rail, streetcar or trolley
- 1.3%7Taxi
- 0.4%2Bicycle
- 21.4%116Walked
- 1.1%6Other means
- 6.5%35Worked at home

Time leaving home to go to work
![Time leaving home to go to work]()
- 2012:00 a.m. to 4:59 a.m.
- 155:00 a.m. to 5:29 a.m.
- 85:30 a.m. to 5:59 a.m.
- 306:00 a.m. to 6:29 a.m.
- 236:30 a.m. to 6:59 a.m.
- 437:00 a.m. to 7:29 a.m.
- 757:30 a.m. to 7:59 a.m.
- 908:00 a.m. to 8:29 a.m.
- 318:30 a.m. to 8:59 a.m.
- 449:00 a.m. to 9:59 a.m.
- 4710:00 a.m. to 10:59 a.m.
- 1911:00 a.m. to 11:59 a.m.
- 7512:00 p.m. to 3:59 p.m.
- 934:00 p.m. to 11:59 p.m.

Occupations of males:
- Percentage of males in management occupations (except farmers):
Here: 8.4% city: 10.7%
- Percentage of males in architecture and engineering occupations:
Here: 2.3% city: 2.9%
- Percentage of males in education, training, and library occupations:
Here: 3.5% city: 5.4%
- Percentage of males in arts, design, entertainment, sports, and media occupations:
Here: 4.1% city: 2.8%
- Percentage of males in service occupations:
Here: 36.6% city: 14.7%
- Percentage of males in sales and office occupations:
Here: 8.7% city: 14.2%
- Percentage of males in construction, extraction, and maintenance occupations:
Here: 8.1% city: 5.6%
- Percentage of males in transportation occupations:
Here: 1.9% city: 6.8%
- Percentage of males in material moving occupations:
Here: 24.8% city: 7.0%
Occupations of females:
- Percentage of females in management occupations (except farmers):
Here: 5.1% city: 10.1%
- Percentage of females in business and financial operations occupations:
Here: 7.3% city: 6.6%
- Percentage of females in architecture and engineering occupations:
Here: 3.0% city: 0.9%
- Percentage of females in community and social services occupations:
Here: 11.8% city: 3.6%
- Percentage of females in education, training, and library occupations:
Here: 13.9% city: 10.7%
- Percentage of females in arts, design, entertainment, sports, and media occupations:
Here: 3.0% city: 2.4%
- Percentage of females in healthcare practitioners and technical occupations:
Here: 8.2% city: 9.8%
- Percentage of females in service occupations:
Here: 16.3% city: 20.4%
- Percentage of females in sales and office occupations:
Here: 17.7% city: 22.3%
- Percentage of females in transportation occupations:
Here: 1.5% city: 1.7%
- Percentage of females in material moving occupations:
Here: 11.7% city: 1.9%
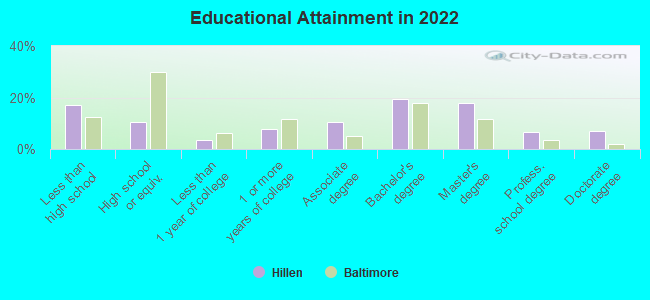
Education in this neighborhood (subdivision or community):
- Percentage of people 3 years and older in K-12 schools:
Hillen: 14.1% Baltimore: 14.7%
- Percentage of people 3 years and older in undergraduate colleges:
Hillen: 59.2% Baltimore: 6.0%
- Percentage of people 3 years and older in grad. or professional schools:
Hillen: 3.1% Baltimore: 2.8%
- Percentage of students K-12 enrolled in private schools:
Hillen: 51.7% Baltimore: 12.7%
Percentage of population below poverty level:
| Hillen: | 12.8% |
| Baltimore: | 18.5% |
Median year owner moved in (as recorded in 2022):
Median year renter moved in (as recorded in 2022):
| Hillen: | 2001 |
| Baltimore: | 2009 |
Median year renter moved in (as recorded in 2022):
| Hillen: | 2017 |
| Baltimore: | 2019 |
Percentage of married-couple families with both working:
| Hillen: | 118.6% |
| Baltimore: | 79.2% |
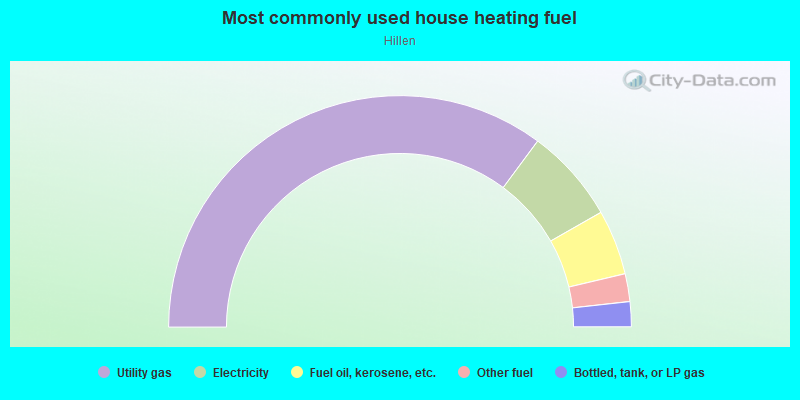
- 70.3%Utility gas
- 13.2%Electricity
- 9.1%Fuel oil, kerosene, etc.
- 3.9%Other fuel
- 3.5%Bottled, tank, or LP gas
Highways in this neighborhood:
State Hwy 41 (Hillen Rd)
Length: 0.55 miles
Directions: N-S, SW-NE
Address range: 4020 to 4598
Directions: N-S, SW-NE
Address range: 4020 to 4598
Roads and streets:
Shadyside Rd
Length: 0.39 miles
Direction: E-W
Address range: 1500 to 1699
Direction: E-W
Address range: 1500 to 1699
Northwick Rd
Length: 0.35 miles
Direction: E-W
Address range: 1518 to 1699
Direction: E-W
Address range: 1518 to 1699
Northgate Rd
Length: 0.30 miles
Direction: E-W
Address range: 1520 to 1699
Direction: E-W
Address range: 1520 to 1699
Fenwick Ave
Length: 0.29 miles
Direction: N-S
Address range: 4200 to 4451
Direction: N-S
Address range: 4200 to 4451
Kingsway Rd
Length: 0.27 miles
Direction: E-W
Address range: 1520 to 1699
Direction: E-W
Address range: 1520 to 1699
Lochwood Rd
Length: 0.26 miles
Direction: E-W
Address range: 1512 to 1699
Direction: E-W
Address range: 1512 to 1699
Argonne Dr
Length: 0.25 miles
Direction: E-W
Address range: 1600 to 1699
Direction: E-W
Address range: 1600 to 1699
Havenwood Rd
Length: 0.24 miles
Direction: E-W
Address range: 1518 to 1699
Direction: E-W
Address range: 1518 to 1699
Ralworth Rd
Length: 0.22 miles
Direction: E-W
Address range: 1600 to 1699
Direction: E-W
Address range: 1600 to 1699
Sheffield Rd
Length: 0.19 miles
Direction: E-W
Address range: 1520 to 1599
Direction: E-W
Address range: 1520 to 1599
Welbourne Rd
Length: 0.16 miles
Direction: N-S
Address range: 4200 to 4499
Direction: N-S
Address range: 4200 to 4499
Tivoly Ave
Length: 0.14 miles
Direction: N-S
Address range: 4020 to 4099
Direction: N-S
Address range: 4020 to 4099
Lockwood Ct
Length: 0.07 miles
Direction: E-W
Direction: E-W
Kingsway Ct
Length: 0.05 miles
Direction: E-W
Address range: 1633 to 1660
Direction: E-W
Address range: 1633 to 1660