Linden neighborhood in Silver Spring, Maryland (MD), 20910 detailed profile
Settings
X


Business Search - 14 Million verified businesses
Area: 0.306 square miles
Population: 1,301
Population density:
| Linden: | 4,258 people per square mile |
| Silver Spring: | 7,993 people per square mile |

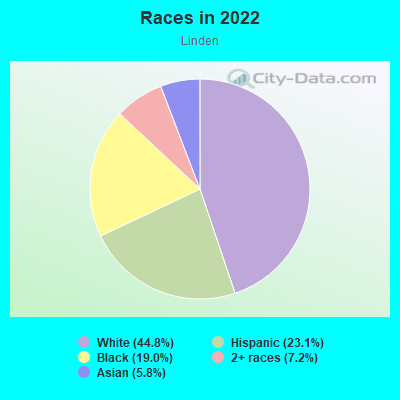
- 58344.8%White
- 30023.1%Hispanic or Latino
- 24719.0%Black
- 937.2%Two or more races
- 765.8%Asian
- 10.08%American Indian
Median household income in 2022:
| Linden: | $136,098 |
| Silver Spring: | $81,557 |
Distribution of median household income
![Distribution of median household income]()
- 52Less than $10,000
- 38$10,000 to $19,999
- 67$20,000 to $29,999
- 74$30,000 to $39,999
- 63$40,000 to $49,999
- 49$50,000 to $59,999
- 9$60,000 to $74,999
- 58$75,000 to $99,999
- 33$100,000 to $124,999
- 31$125,000 to $149,999
- 59$150,000 to $199,999
- 159$200,000 or more

Distribution of owner-occupied house/condo value
![Distribution of owner-occupied house/condo value]()
- 28$50,000 to $99,999
- 89$150,000 to $199,999
- 30$200,000 to $249,999
- 13$250,000 to $299,999
- 25$300,000 to $399,999
- 143$400,000 to $499,999
- 109$500,000 to $749,999
- 164$750,000 to $999,999
- 81$1,000,000 or more

Distribution of rent paid by renters
![Distribution of rent paid by renters]()
- 21$100 to $199
- 7$200 to $299
- 22$300 to $399
- 4$400 to $499
- 20$600 to $699
- 21$700 to $799
- 4$1,000 to $1,249
- 22$1,250 to $1,499
- 163$1,500 to $1,999
- 61$2,000 or more

| Males: | 553 |
| Females: | 747 |
Males:
| This neighborhood: | 37.1 years |
| Whole city: | 36.7 years |
| This neighborhood: | 37.2 years |
| Whole city: | 36.5 years |
Average household size:
| Linden: | 6.1 people |
| Silver Spring: | 2.2 people |
Percentage of family households:
| Linden: | 53.3% |
| Silver Spring: | 38.8% |
| Here: | 43.2% |
| Silver Spring: | 32.5% |
Percentage of married-couple families with children (among all households):
| Linden: | 29.3% |
| Silver Spring: | 34.5% |
Percentage of single-mother households (among all households):
| Linden: | 3.8% |
| Silver Spring: | 6.6% |
Percentage of never married males 15 years old and over:
Percentage of never married females 15 years old and over:
| Linden: | 13.8% |
| Silver Spring: | 22.2% |
Percentage of never married females 15 years old and over:
| Linden: | 22.4% |
| place: | 24.3% |
Percentage of people that speak English not well or not at all:
| Linden: | 8.4% |
| Silver Spring: | 9.9% |
Percentage of people born in this state:
Percentage of people born in another U.S. state:
Percentage of native residents but born outside the U.S.:
Percentage of foreign born residents:
| Here: | 20.4% |
| Silver Spring: | 19.7% |
Percentage of people born in another U.S. state:
| Linden: | 55.8% |
| Silver Spring: | 45.9% |
Percentage of native residents but born outside the U.S.:
| Here: | 2.5% |
| place: | 2.4% |
Percentage of foreign born residents:
| Here: | 21.4% |
| Silver Spring: | 32.0% |
Owner-occupied
Renter-occupied

- Rooms in owner-occupied houses and condos in Linden
- 01 room
- 22 rooms
- 883 rooms
- 294 rooms
- 145 rooms
- 276 rooms
- 627 rooms
- 388 rooms
- 1629+ rooms
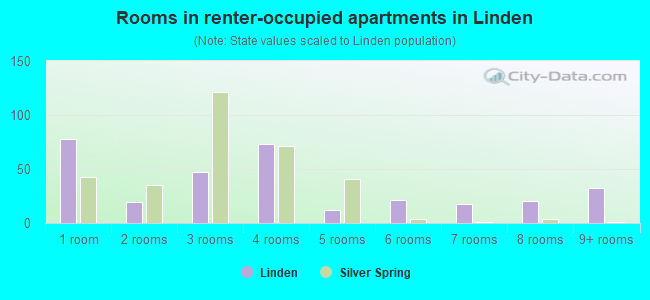
- Rooms in renter-occupied apartments in Linden
- 781 room
- 192 rooms
- 473 rooms
- 734 rooms
- 125 rooms
- 216 rooms
- 187 rooms
- 208 rooms
- 329+ rooms
Owner-occupied
Renter-occupied
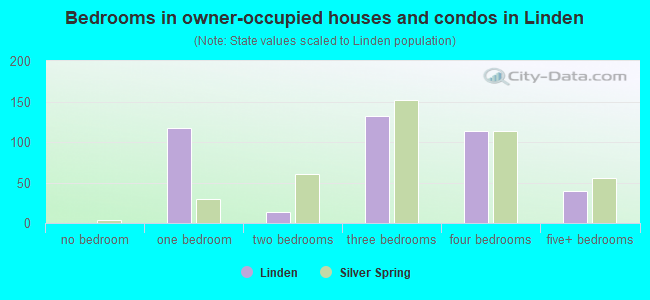
- Bedrooms in owner-occupied houses and condos in Linden
- 0no bedroom
- 1171 bedroom
- 142 bedrooms
- 1323 bedrooms
- 1144 bedrooms
- 395+ bedrooms
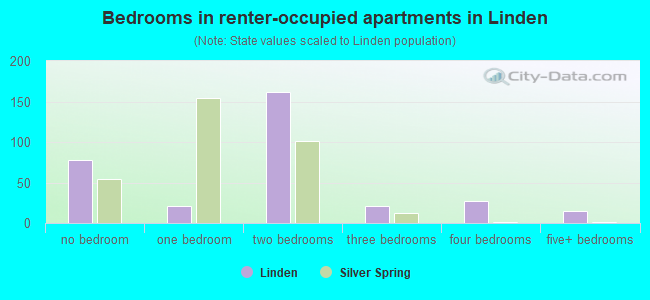
- Bedrooms in renter-occupied apartments in Linden
- 78no bedroom
- 211 bedroom
- 1622 bedrooms
- 213 bedrooms
- 274 bedrooms
- 155+ bedrooms
Average number of cars or other vehicles available in houses/condos:
Average number of cars or other vehicles available in apartments:
| This neighborhood: | 1.6 |
| Silver Spring: | 1.7 |
Average number of cars or other vehicles available in apartments:
| Here: | 1.2 |
| place: | 0.9 |
Percentage of units with a mortgage:
| Linden: | 78.3% |
| Silver Spring: | 76.3% |
Average estimated value of detached houses in 2022 (49.8% of all units):
| Linden: | $798,167 |
| Maryland: | $526,819 |
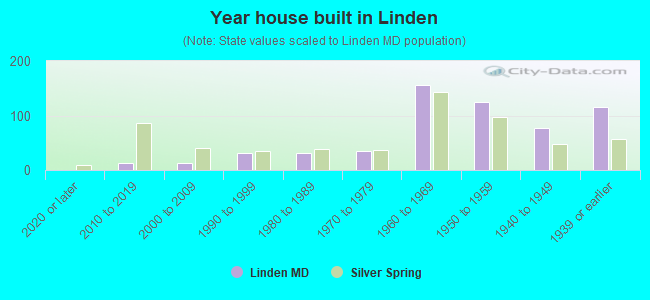
- Year house built in Linden
- 02020 or later
- 122010 to 2019
- 122000 to 2009
- 311990 to 1999
- 311980 to 1989
- 341970 to 1979
- 1561960 to 1969
- 1241950 to 1959
- 771940 to 1949
- 1151939 or earlier
Travel time to work (commute)
![Travel time to work (commute)]()
- 4Less than 5 minutes
- 465 to 9 minutes
- 3910 to 14 minutes
- 7115 to 19 minutes
- 5320 to 24 minutes
- 7225 to 29 minutes
- 13330 to 34 minutes
- 3735 to 39 minutes
- 5140 to 44 minutes
- 9945 to 59 minutes
- 5360 to 89 minutes
- 1190 or more minutes

Means of transportation to work
![Means of transportation to work]()
- 48.6%336Drove a car alone
- 8.5%59Carpooled
- 4.3%30Bus
- 12.1%84Subway or elevated rail
- 4.9%34Long-distance train or commuter rail
- 0.4%3Taxi
- 3.0%21Bicycle
- 1.4%10Walked
- 8.2%57Other means
- 22.4%155Worked at home

Time leaving home to go to work
![Time leaving home to go to work]()
- 2312:00 a.m. to 4:59 a.m.
- 105:00 a.m. to 5:29 a.m.
- 65:30 a.m. to 5:59 a.m.
- 396:00 a.m. to 6:29 a.m.
- 336:30 a.m. to 6:59 a.m.
- 657:00 a.m. to 7:29 a.m.
- 887:30 a.m. to 7:59 a.m.
- 1348:00 a.m. to 8:29 a.m.
- 558:30 a.m. to 8:59 a.m.
- 889:00 a.m. to 9:59 a.m.
- 4510:00 a.m. to 10:59 a.m.
- 611:00 a.m. to 11:59 a.m.
- 3012:00 p.m. to 3:59 p.m.
- 374:00 p.m. to 11:59 p.m.

Occupations of males:
- Percentage of males in management occupations (except farmers):
Here: 14.9% place: 11.4%
- Percentage of males in business and financial operations occupations:
Here: 2.0% place: 6.8%
- Percentage of males in computer and mathematical occupations:
Here: 5.5% place: 9.4%
- Percentage of males in architecture and engineering occupations:
Here: 2.6% place: 4.5%
- Percentage of males in life, physical, and social science occupations:
Here: 7.2% place: 5.3%
- Percentage of males in community and social services occupations:
Here: 2.8% place: 1.2%
- Percentage of males in legal occupations:
Here: 4.2% place: 3.6%
- Percentage of males in education, training, and library occupations:
Here: 5.6% place: 6.2%
- Percentage of males in arts, design, entertainment, sports, and media occupations:
Here: 13.1% place: 3.9%
- Percentage of males in healthcare practitioners and technical occupations:
Here: 4.2% place: 2.5%
- Percentage of males in service occupations:
Here: 14.9% place: 10.9%
- Percentage of males in sales and office occupations:
Here: 15.6% place: 9.6%
- Percentage of males in production occupations:
Here: 6.0% place: 2.2%
- Percentage of males in transportation occupations:
Here: 5.8% place: 6.4%
Occupations of females:
- Percentage of females in management occupations (except farmers):
Here: 9.6% place: 13.0%
- Percentage of females in business and financial operations occupations:
Here: 3.7% place: 8.9%
- Percentage of females in computer and mathematical occupations:
Here: 1.8% place: 5.0%
- Percentage of females in architecture and engineering occupations:
Here: 1.3% place: 1.3%
- Percentage of females in life, physical, and social science occupations:
Here: 3.8% place: 3.4%
- Percentage of females in community and social services occupations:
Here: 5.1% place: 2.9%
- Percentage of females in legal occupations:
Here: 5.4% place: 4.2%
- Percentage of females in education, training, and library occupations:
Here: 6.2% place: 11.2%
- Percentage of females in arts, design, entertainment, sports, and media occupations:
Here: 11.5% place: 4.5%
- Percentage of females in healthcare practitioners and technical occupations:
Here: 6.0% place: 5.3%
- Percentage of females in service occupations:
Here: 26.5% place: 20.4%
- Percentage of females in sales and office occupations:
Here: 20.4% place: 16.7%
Percentage of people 16-64 in Armed Forces:
| Linden: | 1.1% |
| Silver Spring: | 0.4% |
Education in this neighborhood (subdivision or community):
- Percentage of people 3 years and older in K-12 schools:
Linden: 20.6% Silver Spring: 14.1%
- Percentage of people 3 years and older in undergraduate colleges:
Linden: 6.5% Silver Spring: 3.4%
- Percentage of people 3 years and older in grad. or professional schools:
Linden: 1.2% Silver Spring: 2.0%
- Percentage of students K-12 enrolled in private schools:
Linden: 24.5% Silver Spring: 12.6%
Percentage of population below poverty level:
| Linden: | 7.1% |
| Silver Spring: | 11.0% |
Median year owner moved in (as recorded in 2022):
| Linden: | 2004 |
| Silver Spring: | 2011 |
Percentage of married-couple families with both working:
| Linden: | 85.4% |
| Silver Spring: | 80.2% |
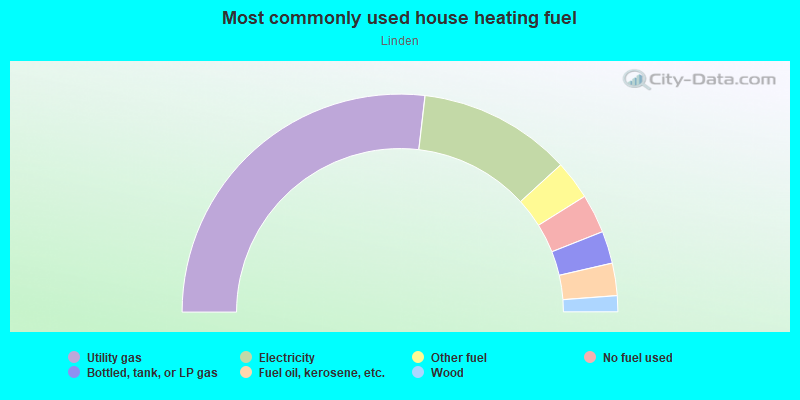
- 53.7%Utility gas
- 22.7%Electricity
- 5.8%Other fuel
- 5.8%No fuel used
- 4.8%Bottled, tank, or LP gas
- 4.8%Fuel oil, kerosene, etc.
- 2.4%Wood
Limited-access highways (interstate or state) in this neighborhood:
Capital Beltway (I- 495)
Length: 0.08 miles
Direction: E-W
Direction: E-W
Highways in this neighborhood:
Seminary Rd (State Hwy 391)
Length: 0.33 miles
Direction: SE-NW
Address range: 2400 to 2507
Direction: SE-NW
Address range: 2400 to 2507
Roads and streets:
Brookville Rd
Length: 0.76 miles
Direction: SW-NE
Address range: 8909 to 9399
Direction: SW-NE
Address range: 8909 to 9399
Linden Ln
Length: 0.63 miles
Direction: E-W
Address range: 200 to 2721
Direction: E-W
Address range: 200 to 2721
Robert Grant Ave
Length: 0.34 miles
Direction: SW-NE
Direction: SW-NE
Montgomery St
Length: 0.28 miles
Direction: E-W
Address range: 2200 to 2499
Direction: E-W
Address range: 2200 to 2499
Warren St
Length: 0.22 miles
Directions: N-S, SE-NW
Address range: 9200 to 9399
Directions: N-S, SE-NW
Address range: 9200 to 9399
Distribution Cir
Length: 0.20 miles
Directions: E-W, N-S
Address range: 2200 to 2399
Directions: E-W, N-S
Address range: 2200 to 2399
Salisbury Rd
Length: 0.15 miles
Direction: E-W
Address range: 2100 to 2499
Direction: E-W
Address range: 2100 to 2499
Sitter Ave
Length: 0.13 miles
Direction: SE-NW
Direction: SE-NW
Fraser Ave
Length: 0.12 miles
Direction: N-S
Address range: 9300 to 9399
Direction: N-S
Address range: 9300 to 9399
Sharon Dr
Length: 0.11 miles
Directions: E-W, N-S, SE-NW
Address range: 1500 to 1599
Directions: E-W, N-S, SE-NW
Address range: 1500 to 1599
Birch Dr
Length: 0.10 miles
Directions: E-W, SE-NW, SW-NE
Address range: 2400 to 2499
Directions: E-W, SE-NW, SW-NE
Address range: 2400 to 2499
Hale Pl
Length: 0.09 miles
Direction: N-S
Address range: 9400 to 9499
Direction: N-S
Address range: 9400 to 9499
Gwyndale Dr
Length: 0.08 miles
Directions: N-S, SE-NW, SW-NE
Address range: 9500 to 9599
Directions: N-S, SE-NW, SW-NE
Address range: 9500 to 9599
Warren Ct
Length: 0.05 miles
Direction: E-W
Address range: 2300 to 2399
Direction: E-W
Address range: 2300 to 2399
Linden Grove Ct
Length: 0.04 miles
Directions: N-S, SE-NW
Address range: 9200 to 9299
Directions: N-S, SE-NW
Address range: 9200 to 9299
Salisbury Ave
Length: 0.02 miles
Direction: E-W
Address range: 2400 to 2499
Direction: E-W
Address range: 2400 to 2499
Railroad features:
Csx RR
Length: 0.66 miles
Directions: N-S, SE-NW
Directions: N-S, SE-NW