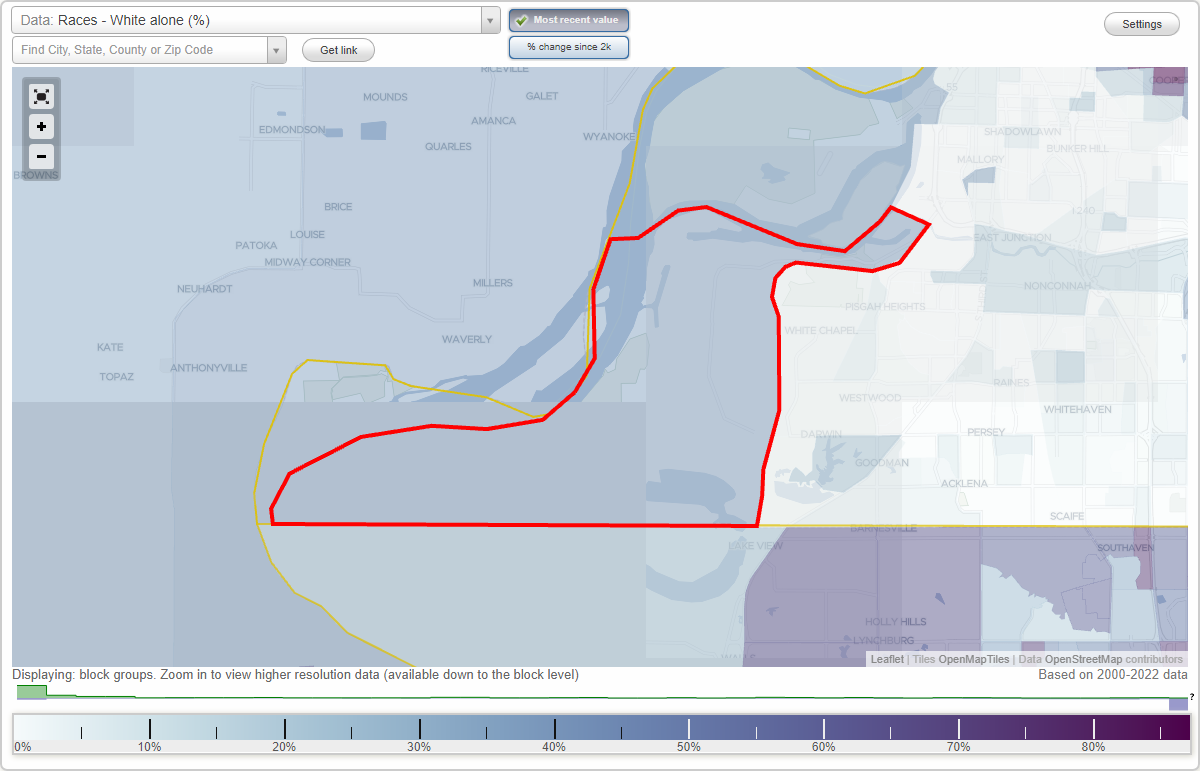
McKeller neighborhood in Memphis, Tennessee (TN), 38109 detailed profile
Settings
X

Business Search - 14 Million verified businesses
Area: 33.113 square miles
Population: 16,405
Population density:
| McKeller: | 495 people per square mile |
| Memphis: | 2,223 people per square mile |

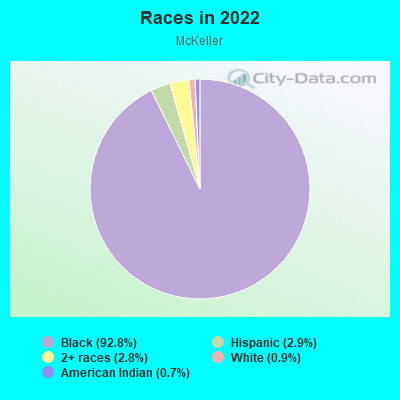
- 15,93092.8%Black
- 4992.9%Hispanic or Latino
- 4822.8%Two or more races
- 1510.9%White
- 1120.7%American Indian
Median household income in 2022:
| McKeller: | $34,049 |
| Memphis: | $50,622 |
Distribution of median household income
![Distribution of median household income]()
- 594Less than $10,000
- 1,271$10,000 to $19,999
- 821$20,000 to $29,999
- 1,885$30,000 to $39,999
- 1,318$40,000 to $49,999
- 249$50,000 to $59,999
- 276$60,000 to $74,999
- 440$75,000 to $99,999
- 417$100,000 to $124,999
- 634$125,000 to $149,999
- 112$150,000 to $199,999
- 412$200,000 or more

Distribution of owner-occupied house/condo value
![Distribution of owner-occupied house/condo value]()
- 2,549Less than $50,000
- 3,036$50,000 to $99,999
- 118$100,000 to $149,999
- 80$150,000 to $199,999
- 57$250,000 to $299,999
- 394$300,000 to $399,999
- 198$500,000 to $749,999
- 38$1,000,000 or more

Distribution of rent paid by renters
![Distribution of rent paid by renters]()
- 41Less than $100
- 82$100 to $199
- 114$200 to $299
- 1,957$300 to $399
- 455$400 to $499
- 1,313$500 to $599
- 996$600 to $699
- 1,795$700 to $799
- 1,336$800 to $899
- 293$900 to $999
- 68$1,000 to $1,249

Median rent in 2022:
| McKeller: | $574 |
| Memphis: | $817 |
| Males: | 7,814 |
| Females: | 8,591 |
Males:
| This neighborhood: | 43.3 years |
| Whole city: | 33.4 years |
| This neighborhood: | 42.7 years |
| Whole city: | 36.2 years |
Average household size:
| McKeller: | 2.9 people |
| Memphis: | 2.4 people |
Percentage of family households:
| McKeller: | 28.3% |
| Memphis: | 40.8% |
| Here: | 17.5% |
| Memphis: | 26.4% |
Percentage of married-couple families with children (among all households):
| McKeller: | 7.7% |
| Memphis: | 15.4% |
Percentage of single-mother households (among all households):
| McKeller: | 26.9% |
| Memphis: | 21.2% |
Percentage of never married males 15 years old and over:
Percentage of never married females 15 years old and over:
| McKeller: | 22.0% |
| Memphis: | 24.0% |
Percentage of never married females 15 years old and over:
| McKeller: | 28.1% |
| city: | 24.7% |
Percentage of people that speak English not well or not at all:
| McKeller: | 0.0% |
| Memphis: | 2.3% |
Percentage of people born in this state:
Percentage of people born in another U.S. state:
Percentage of native residents but born outside the U.S.:
Percentage of foreign born residents:
| Here: | 79.0% |
| Memphis: | 64.2% |
Percentage of people born in another U.S. state:
| McKeller: | 20.1% |
| Memphis: | 27.8% |
Percentage of native residents but born outside the U.S.:
| Here: | 0.0% |
| city: | 0.7% |
Percentage of foreign born residents:
| Here: | 0.9% |
| Memphis: | 7.2% |
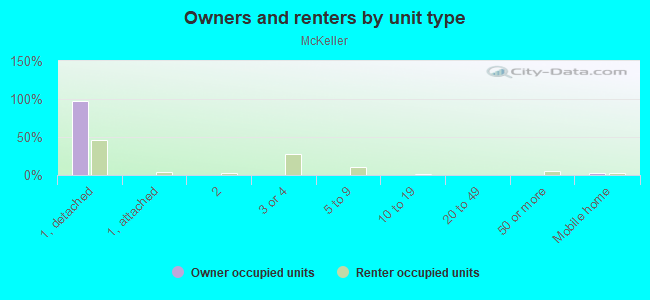
Owner-occupied
Renter-occupied

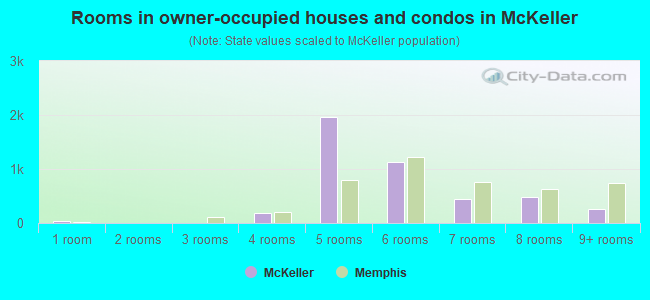
- Rooms in owner-occupied houses and condos in McKeller
- 421 room
- 02 rooms
- 03 rooms
- 1784 rooms
- 1,9545 rooms
- 1,1326 rooms
- 4417 rooms
- 4738 rooms
- 2559+ rooms
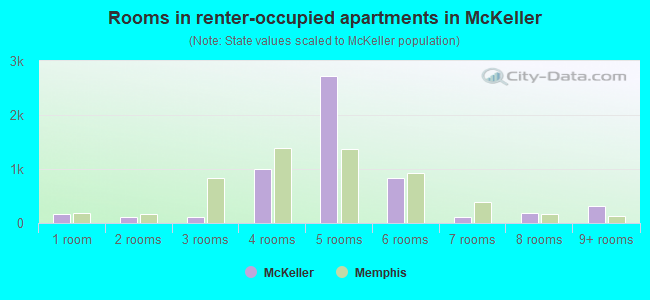
- Rooms in renter-occupied apartments in McKeller
- 1601 room
- 1132 rooms
- 1053 rooms
- 9984 rooms
- 2,7135 rooms
- 8406 rooms
- 1187 rooms
- 1818 rooms
- 3219+ rooms
Owner-occupied
Renter-occupied
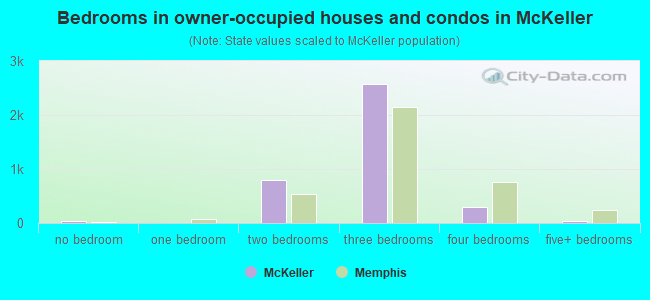
- Bedrooms in owner-occupied houses and condos in McKeller
- 42no bedroom
- 01 bedroom
- 7942 bedrooms
- 2,5653 bedrooms
- 2954 bedrooms
- 455+ bedrooms
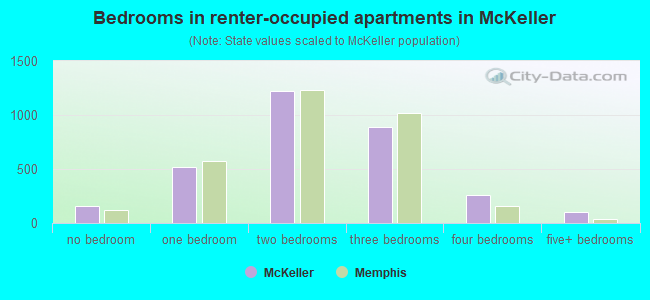
- Bedrooms in renter-occupied apartments in McKeller
- 160no bedroom
- 5141 bedroom
- 1,2192 bedrooms
- 8933 bedrooms
- 2604 bedrooms
- 1015+ bedrooms
Average number of cars or other vehicles available in houses/condos:
Average number of cars or other vehicles available in apartments:
| This neighborhood: | 1.8 |
| Memphis: | 1.9 |
Average number of cars or other vehicles available in apartments:
| Here: | 1.6 |
| city: | 1.3 |
Percentage of units with a mortgage:
| McKeller: | 16.6% |
| Memphis: | 58.8% |
Average estimated value of detached houses in 2022 (90.6% of all units):
| McKeller: | $90,109 |
| Memphis: | $212,707 |
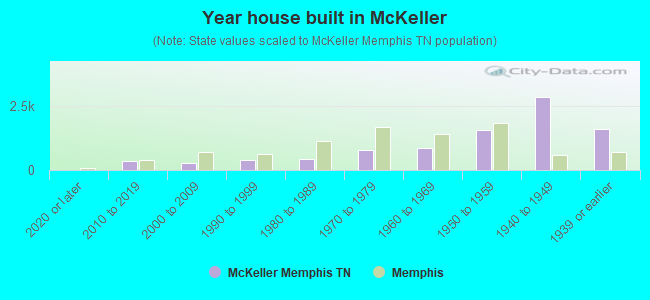
- Year house built in McKeller
- 02020 or later
- 3412010 to 2019
- 2802000 to 2009
- 4051990 to 1999
- 4311980 to 1989
- 7901970 to 1979
- 8671960 to 1969
- 1,5391950 to 1959
- 2,8201940 to 1949
- 1,5751939 or earlier
City-data.com crime index for city in 2020 (higher means more crime):
| City: | 897.5 |
| U.S. average: | 219.5 |
Travel time to work (commute)
![Travel time to work (commute)]()
- 126Less than 5 minutes
- 1365 to 9 minutes
- 27010 to 14 minutes
- 22115 to 19 minutes
- 1,96620 to 24 minutes
- 23325 to 29 minutes
- 50330 to 34 minutes
- 4535 to 39 minutes
- 4640 to 44 minutes
- 12345 to 59 minutes
- 7860 to 89 minutes
- 5990 or more minutes

Means of transportation to work
![Means of transportation to work]()
- 72.7%3,248Drove a car alone
- 33.1%1,478Carpooled
- 7.3%325Bus
- 3.2%145Taxi
- 5.7%253Walked
- 6.8%303Other means
- 2.1%92Worked at home

Time leaving home to go to work
![Time leaving home to go to work]()
- 13012:00 a.m. to 4:59 a.m.
- 1195:00 a.m. to 5:29 a.m.
- 2205:30 a.m. to 5:59 a.m.
- 2766:00 a.m. to 6:29 a.m.
- 3346:30 a.m. to 6:59 a.m.
- 5447:00 a.m. to 7:29 a.m.
- 7907:30 a.m. to 7:59 a.m.
- 1368:00 a.m. to 8:29 a.m.
- 868:30 a.m. to 8:59 a.m.
- 3029:00 a.m. to 9:59 a.m.
- 6710:00 a.m. to 10:59 a.m.
- 7911:00 a.m. to 11:59 a.m.
- 29912:00 p.m. to 3:59 p.m.
- 5094:00 p.m. to 11:59 p.m.

Occupations of males:
- Percentage of males in management occupations (except farmers):
Here: 2.8% city: 8.6%
- Percentage of males in business and financial operations occupations:
Here: 2.0% city: 3.7%
- Percentage of males in computer and mathematical occupations:
Here: 2.7% city: 2.8%
- Percentage of males in service occupations:
Here: 7.8% city: 15.9%
- Percentage of males in sales and office occupations:
Here: 9.9% city: 15.1%
- Percentage of males in farming, fishing, and forestry occupations:
Here: 9.4% city: 0.2%
- Percentage of males in construction, extraction, and maintenance occupations:
Here: 2.9% city: 8.1%
- Percentage of males in production occupations:
Here: 7.5% city: 7.6%
- Percentage of males in transportation occupations:
Here: 1.8% city: 7.7%
- Percentage of males in material moving occupations:
Here: 16.3% city: 13.5%
Occupations of females:
- Percentage of females in management occupations (except farmers):
Here: 3.0% city: 8.0%
- Percentage of females in life, physical, and social science occupations:
Here: 1.5% city: 1.0%
- Percentage of females in education, training, and library occupations:
Here: 5.3% city: 7.8%
- Percentage of females in arts, design, entertainment, sports, and media occupations:
Here: 2.6% city: 1.4%
- Percentage of females in healthcare practitioners and technical occupations:
Here: 3.3% city: 7.9%
- Percentage of females in service occupations:
Here: 36.5% city: 20.2%
- Percentage of females in sales and office occupations:
Here: 32.8% city: 28.5%
- Percentage of females in production occupations:
Here: 5.2% city: 4.8%
- Percentage of females in transportation occupations:
Here: 13.4% city: 1.6%
- Percentage of females in material moving occupations:
Here: 3.9% city: 7.8%
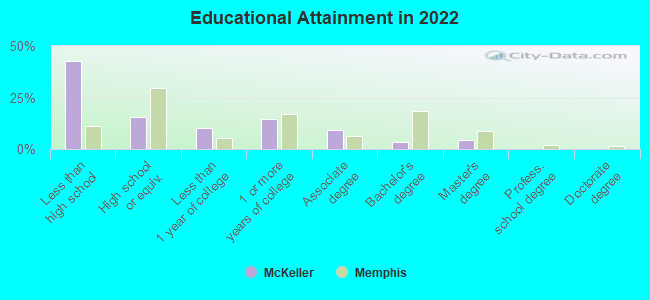
Education in this neighborhood (subdivision or community):
- Percentage of people 3 years and older in K-12 schools:
McKeller: 46.9% Memphis: 18.0%
- Percentage of people 3 years and older in undergraduate colleges:
McKeller: 4.2% Memphis: 3.5%
- Percentage of people 3 years and older in grad. or professional schools:
McKeller: 6.2% Memphis: 2.2%
- Percentage of students K-12 enrolled in private schools:
McKeller: 8.6% Memphis: 10.3%
Percentage of population below poverty level:
| McKeller: | 36.2% |
| Memphis: | 21.4% |
Median year renter moved in (as recorded in 2022):
| McKeller: | 2017 |
| Memphis: | 2020 |
Percentage of married-couple families with both working:
| McKeller: | 151.6% |
| Memphis: | 70.5% |
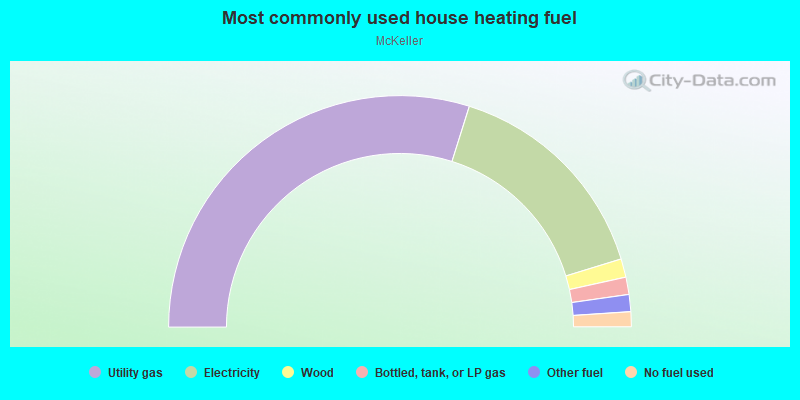
- 59.7%Utility gas
- 30.8%Electricity
- 2.6%Wood
- 2.4%Bottled, tank, or LP gas
- 2.4%Other fuel
- 2.1%No fuel used
Roads and streets:
Riverport Rd
Length: 3.99 miles
Directions: E-W, N-S, SE-NW, SW-NE
Address range: 2552 to 2999
Directions: E-W, N-S, SE-NW, SW-NE
Address range: 2552 to 2999
Paul R Lowry Rd
Length: 3.75 miles
Directions: E-W, N-S, SE-NW, SW-NE
Address range: 3500 to 4299
Directions: E-W, N-S, SE-NW, SW-NE
Address range: 3500 to 4299
Plant Rd
Length: 2.06 miles
Directions: E-W, N-S, SE-NW, SW-NE
Address range: 2400 to 3099
Directions: E-W, N-S, SE-NW, SW-NE
Address range: 2400 to 3099
Levee Rd
Length: 1.15 miles
Directions: E-W, SE-NW
Directions: E-W, SE-NW
N Rivergate Rd
Length: 0.87 miles
Directions: E-W, SE-NW, SW-NE
Address range: 490 to 570
Directions: E-W, SE-NW, SW-NE
Address range: 490 to 570
Hennington Ave
Length: 0.75 miles
Directions: E-W, SE-NW
Address range: 2211 to 2600
Directions: E-W, SE-NW
Address range: 2211 to 2600
W Mitchell Rd
Length: 0.71 miles
Directions: E-W, N-S, SW-NE
Address range: 1925 to 3911
Directions: E-W, N-S, SW-NE
Address range: 1925 to 3911
Ensley St
Length: 0.40 miles
Direction: N-S
Direction: N-S
Buoy St
Length: 0.35 miles
Directions: E-W, N-S, SE-NW, SW-NE
Directions: E-W, N-S, SE-NW, SW-NE
Rivergate Dr
Length: 0.04 miles
Direction: SE-NW
Direction: SE-NW
Paul R Lowery Rd (Riverport Rd)
Length: 0.03 miles
Directions: E-W, N-S, SW-NE
Directions: E-W, N-S, SW-NE
Railroad features:
Illinois Central RR
Length: 3.50 miles
Directions: E-W, N-S, SE-NW, SW-NE
Directions: E-W, N-S, SE-NW, SW-NE
Other features:
Horn Lake Cutoff
Length: 6.01 miles
Directions: E-W, N-S, SE-NW, SW-NE
Directions: E-W, N-S, SE-NW, SW-NE
Other features:
Horn Lake Ditch
Length: 4.45 miles
Directions: E-W, N-S, SE-NW, SW-NE
Directions: E-W, N-S, SE-NW, SW-NE
Other features:
Old Horn Lake Bend
Length: 2.90 miles
Directions: E-W, N-S, SE-NW, SW-NE
Directions: E-W, N-S, SE-NW, SW-NE
Cypress Crk
Length: 1.96 miles
Directions: E-W, N-S, SE-NW, SW-NE
Directions: E-W, N-S, SE-NW, SW-NE
Nonconnah Crk
Length: 0.24 miles
Directions: E-W, SW-NE
Directions: E-W, SW-NE