Mill Creek neighborhood in Dallas, Texas (TX), 75204, 75214, 75246 detailed profile
Settings
X


Business Search - 14 Million verified businesses
Area: 0.471 square miles
Population: 4,332
Population density:
| Mill Creek: | 9,196 people per square mile |
| Dallas: | 3,794 people per square mile |

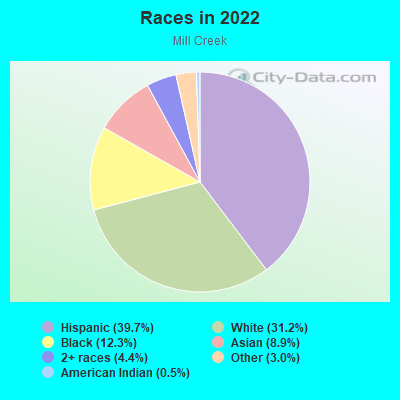
- 1,93939.7%Hispanic or Latino
- 1,52531.2%White
- 59912.3%Black
- 4378.9%Asian
- 2154.4%Two or more races
- 1483.0%Some other race
- 250.5%American Indian
Distribution of median household income
![Distribution of median household income]()
- 420Less than $10,000
- 194$10,000 to $19,999
- 254$20,000 to $29,999
- 365$30,000 to $39,999
- 368$40,000 to $49,999
- 298$50,000 to $59,999
- 212$60,000 to $74,999
- 419$75,000 to $99,999
- 123$100,000 to $124,999
- 88$125,000 to $149,999
- 159$150,000 to $199,999
- 88$200,000 or more

Distribution of owner-occupied house/condo value
![Distribution of owner-occupied house/condo value]()
- 10Less than $50,000
- 96$50,000 to $99,999
- 113$100,000 to $149,999
- 75$150,000 to $199,999
- 180$200,000 to $249,999
- 181$250,000 to $299,999
- 69$300,000 to $399,999
- 176$400,000 to $499,999
- 115$500,000 to $749,999
- 232$750,000 to $999,999
- 273$1,000,000 or more

Distribution of rent paid by renters
![Distribution of rent paid by renters]()
- 118Less than $100
- 320$200 to $299
- 68$300 to $399
- 70$400 to $499
- 306$500 to $599
- 368$600 to $699
- 278$700 to $799
- 200$800 to $899
- 335$900 to $999
- 517$1,000 to $1,249
- 242$1,250 to $1,499
- 157$1,500 to $1,999
- 207$2,000 or more

Median rent in 2022:
| Mill Creek: | $1,022 |
| Dallas: | $1,208 |
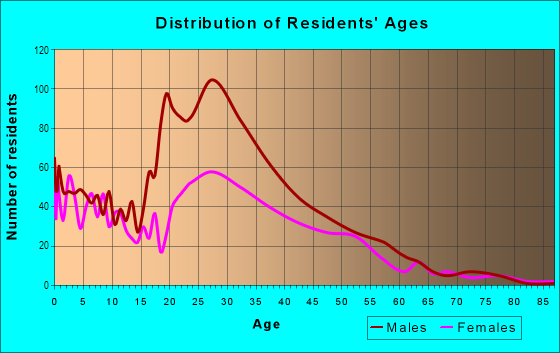
| Males: | 2,446 |
| Females: | 1,886 |
Males:
| This neighborhood: | 41.6 years |
| Whole city: | 32.8 years |
| This neighborhood: | 35.8 years |
| Whole city: | 33.4 years |
Average household size:
| Mill Creek: | 1.9 people |
| Dallas: | 2.4 people |
Percentage of family households:
| Mill Creek: | 34.1% |
| Dallas: | 42.6% |
| Here: | 27.4% |
| Dallas: | 33.8% |
Percentage of married-couple families with children (among all households):
| Mill Creek: | 18.2% |
| Dallas: | 24.8% |
Percentage of single-mother households (among all households):
| Mill Creek: | 17.9% |
| Dallas: | 13.3% |
Percentage of never married males 15 years old and over:
Percentage of never married females 15 years old and over:
| Mill Creek: | 24.7% |
| Dallas: | 22.1% |
Percentage of never married females 15 years old and over:
| Mill Creek: | 16.8% |
| city: | 21.8% |
Percentage of people that speak English not well or not at all:
| Mill Creek: | 22.1% |
| Dallas: | 10.7% |
Percentage of people born in this state:
Percentage of people born in another U.S. state:
Percentage of native residents but born outside the U.S.:
Percentage of foreign born residents:
| Here: | 57.0% |
| Dallas: | 52.8% |
Percentage of people born in another U.S. state:
| Mill Creek: | 21.5% |
| Dallas: | 22.0% |
Percentage of native residents but born outside the U.S.:
| Here: | 2.6% |
| city: | 1.3% |
Percentage of foreign born residents:
| Here: | 19.8% |
| Dallas: | 23.9% |
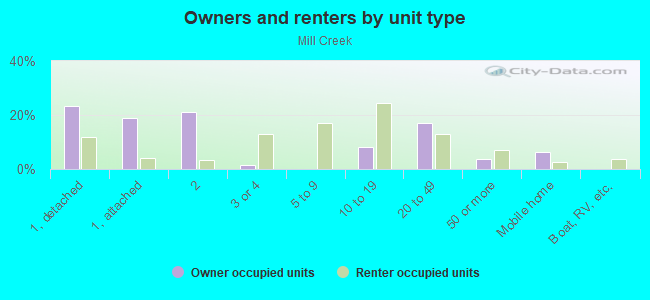
Owner-occupied
Renter-occupied

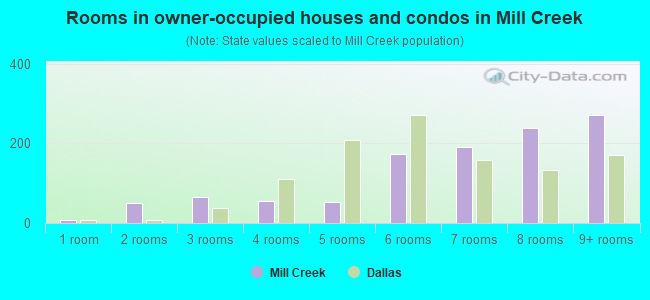
- Rooms in owner-occupied houses and condos in Mill Creek
- 81 room
- 492 rooms
- 663 rooms
- 554 rooms
- 525 rooms
- 1726 rooms
- 1917 rooms
- 2388 rooms
- 2719+ rooms
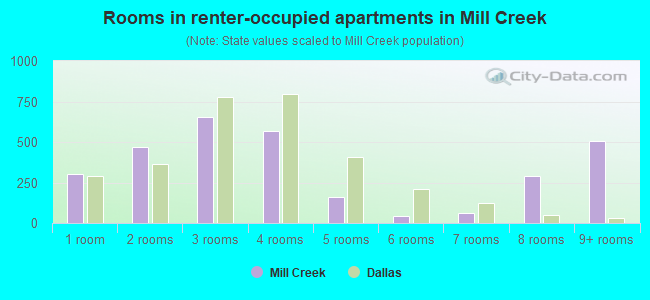
- Rooms in renter-occupied apartments in Mill Creek
- 3041 room
- 4692 rooms
- 6533 rooms
- 5704 rooms
- 1615 rooms
- 416 rooms
- 607 rooms
- 2938 rooms
- 5089+ rooms
Owner-occupied
Renter-occupied
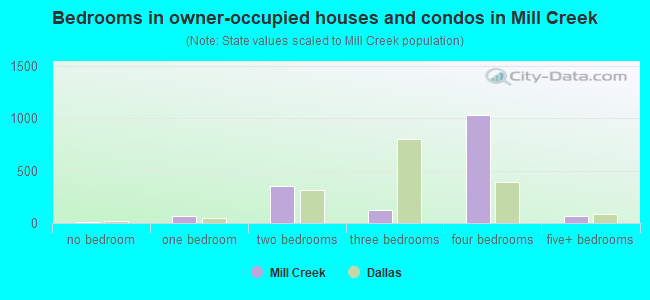
- Bedrooms in owner-occupied houses and condos in Mill Creek
- 8no bedroom
- 691 bedroom
- 3522 bedrooms
- 1263 bedrooms
- 1,0334 bedrooms
- 645+ bedrooms
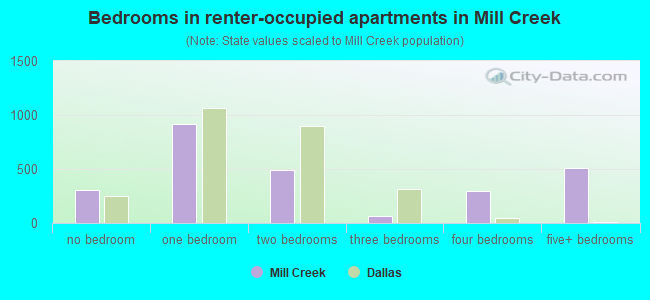
- Bedrooms in renter-occupied apartments in Mill Creek
- 306no bedroom
- 9201 bedroom
- 4892 bedrooms
- 653 bedrooms
- 2934 bedrooms
- 5085+ bedrooms
Average number of cars or other vehicles available in houses/condos:
Average number of cars or other vehicles available in apartments:
| This neighborhood: | 5.6 |
| Dallas: | 2.1 |
Average number of cars or other vehicles available in apartments:
| Here: | 1.8 |
| city: | 1.3 |
Percentage of units with a mortgage:
| Mill Creek: | 32.0% |
| Dallas: | 53.9% |
Average estimated value of detached houses in 2022 (14.9% of all units):
| Mill Creek: | $620,078 |
| Dallas: | $423,859 |
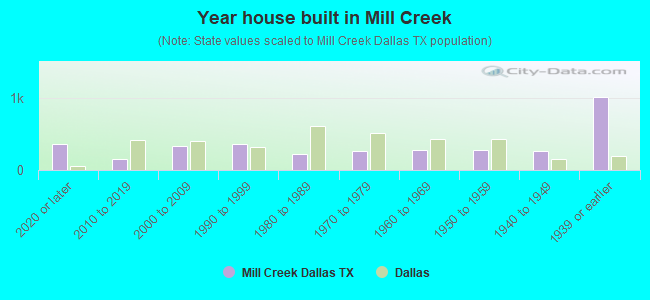
- Year house built in Mill Creek
- 3672020 or later
- 1512010 to 2019
- 3342000 to 2009
- 3611990 to 1999
- 2281980 to 1989
- 2591970 to 1979
- 2761960 to 1969
- 2801950 to 1959
- 2711940 to 1949
- 1,0161939 or earlier
City-data.com crime index for city in 2020 (higher means more crime):
| City: | 439.5 |
| U.S. average: | 219.5 |
Travel time to work (commute)
![Travel time to work (commute)]()
- 31Less than 5 minutes
- 1085 to 9 minutes
- 26610 to 14 minutes
- 33915 to 19 minutes
- 31620 to 24 minutes
- 15725 to 29 minutes
- 33730 to 34 minutes
- 10135 to 39 minutes
- 7040 to 44 minutes
- 56345 to 59 minutes
- 16060 to 89 minutes
- 6190 or more minutes

Means of transportation to work
![Means of transportation to work]()
- 57.8%1,573Drove a car alone
- 16.9%460Carpooled
- 5.4%147Bus
- 14.0%381Long-distance train or commuter rail
- 2.1%58Light rail, streetcar or trolley
- 0.6%16Taxi
- 3.0%81Motorcycle
- 5.0%136Bicycle
- 11.1%302Walked
- 28.0%763Other means
- 10.6%289Worked at home

Time leaving home to go to work
![Time leaving home to go to work]()
- 7412:00 a.m. to 4:59 a.m.
- 765:00 a.m. to 5:29 a.m.
- 645:30 a.m. to 5:59 a.m.
- 2126:00 a.m. to 6:29 a.m.
- 1166:30 a.m. to 6:59 a.m.
- 3487:00 a.m. to 7:29 a.m.
- 2797:30 a.m. to 7:59 a.m.
- 1708:00 a.m. to 8:29 a.m.
- 2048:30 a.m. to 8:59 a.m.
- 2619:00 a.m. to 9:59 a.m.
- 6610:00 a.m. to 10:59 a.m.
- 8211:00 a.m. to 11:59 a.m.
- 20112:00 p.m. to 3:59 p.m.
- 774:00 p.m. to 11:59 p.m.

Occupations of males:
- Percentage of males in management occupations (except farmers):
Here: 8.8% city: 10.9%
- Percentage of males in business and financial operations occupations:
Here: 4.9% city: 7.3%
- Percentage of males in computer and mathematical occupations:
Here: 11.2% city: 4.7%
- Percentage of males in education, training, and library occupations:
Here: 3.4% city: 2.3%
- Percentage of males in arts, design, entertainment, sports, and media occupations:
Here: 1.4% city: 2.2%
- Percentage of males in service occupations:
Here: 13.4% city: 12.3%
- Percentage of males in sales and office occupations:
Here: 7.2% city: 14.9%
- Percentage of males in construction, extraction, and maintenance occupations:
Here: 26.9% city: 15.2%
- Percentage of males in production occupations:
Here: 2.2% city: 5.0%
- Percentage of males in transportation occupations:
Here: 3.4% city: 5.9%
- Percentage of males in material moving occupations:
Here: 11.8% city: 6.2%
Occupations of females:
- Percentage of females in management occupations (except farmers):
Here: 11.1% city: 9.6%
- Percentage of females in business and financial operations occupations:
Here: 9.4% city: 8.4%
- Percentage of females in computer and mathematical occupations:
Here: 1.1% city: 2.0%
- Percentage of females in architecture and engineering occupations:
Here: 1.1% city: 0.6%
- Percentage of females in life, physical, and social science occupations:
Here: 1.4% city: 0.8%
- Percentage of females in community and social services occupations:
Here: 2.6% city: 1.8%
- Percentage of females in education, training, and library occupations:
Here: 5.1% city: 7.1%
- Percentage of females in arts, design, entertainment, sports, and media occupations:
Here: 5.6% city: 2.9%
- Percentage of females in healthcare practitioners and technical occupations:
Here: 7.6% city: 7.7%
- Percentage of females in service occupations:
Here: 18.0% city: 20.5%
- Percentage of females in sales and office occupations:
Here: 25.0% city: 27.7%
- Percentage of females in construction, extraction, and maintenance occupations:
Here: 2.3% city: 0.6%
- Percentage of females in transportation occupations:
Here: 1.8% city: 1.4%
- Percentage of females in material moving occupations:
Here: 7.9% city: 3.2%
Percentage of people 16-64 in Armed Forces:
| Mill Creek: | 0.2% |
| Dallas: | 0.2% |
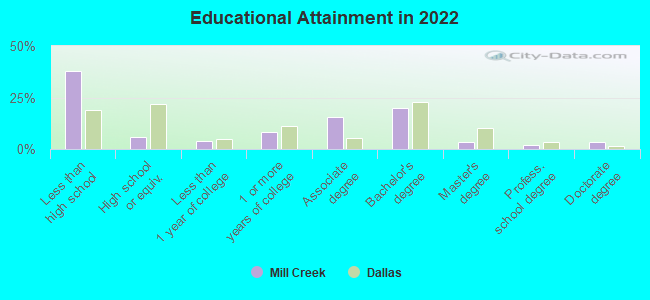
Education in this neighborhood (subdivision or community):
- Percentage of people 3 years and older in K-12 schools:
Mill Creek: 24.9% Dallas: 17.3%
- Percentage of people 3 years and older in undergraduate colleges:
Mill Creek: 7.1% Dallas: 4.1%
- Percentage of people 3 years and older in grad. or professional schools:
Mill Creek: 6.1% Dallas: 1.7%
- Percentage of students K-12 enrolled in private schools:
Mill Creek: 31.4% Dallas: 10.8%
Percentage of population below poverty level:
| Mill Creek: | 20.7% |
| Dallas: | 17.8% |
Median year renter moved in (as recorded in 2022):
| Mill Creek: | 2017 |
| Dallas: | 2020 |
Percentage of married-couple families with both working:
| Mill Creek: | 136.4% |
| Dallas: | 58.3% |
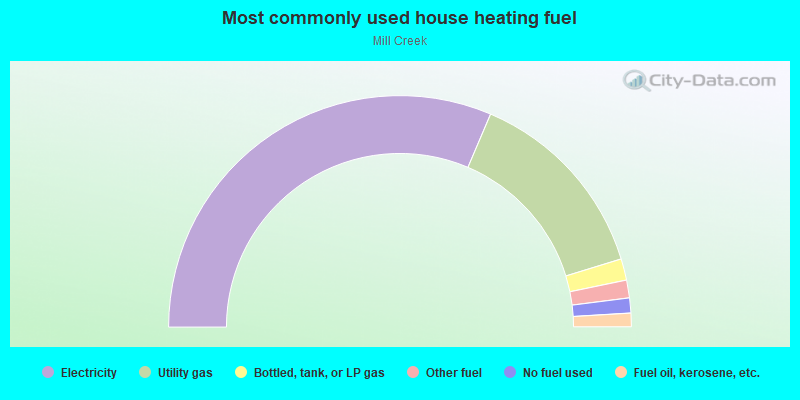
- 62.9%Electricity
- 27.7%Utility gas
- 3.0%Bottled, tank, or LP gas
- 2.5%Other fuel
- 2.1%No fuel used
- 1.9%Fuel oil, kerosene, etc.
Roads and streets:
N Fitzhugh Ave
Length: 0.79 miles
Direction: SE-NW
Address range: 100 to 1299
Direction: SE-NW
Address range: 100 to 1299
N Carroll Ave
Length: 0.79 miles
Direction: SE-NW
Address range: 100 to 1299
Direction: SE-NW
Address range: 100 to 1299
Columbia Ave
Length: 0.75 miles
Directions: E-W, N-S, SW-NE
Address range: 4501 to 4899
Directions: E-W, N-S, SW-NE
Address range: 4501 to 4899
Swiss Ave
Length: 0.68 miles
Direction: SW-NE
Address range: 4100 to 4899
Direction: SW-NE
Address range: 4100 to 4899
Gaston Ave
Length: 0.68 miles
Direction: SW-NE
Address range: 4100 to 4899
Direction: SW-NE
Address range: 4100 to 4899
Worth St
Length: 0.68 miles
Direction: SW-NE
Address range: 4100 to 4899
Direction: SW-NE
Address range: 4100 to 4899
Junius St
Length: 0.68 miles
Direction: SW-NE
Address range: 4100 to 4899
Direction: SW-NE
Address range: 4100 to 4899
Sycamore St
Length: 0.53 miles
Direction: SW-NE
Address range: 4300 to 4899
Direction: SW-NE
Address range: 4300 to 4899
Live Oak St
Length: 0.52 miles
Direction: SW-NE
Address range: 4300 to 4899
Direction: SW-NE
Address range: 4300 to 4899
N Prairie Ave
Length: 0.50 miles
Direction: SE-NW
Address range: 100 to 1299
Direction: SE-NW
Address range: 100 to 1299
N Peak St
Length: 0.46 miles
Direction: SE-NW
Address range: 600 to 1299
Direction: SE-NW
Address range: 600 to 1299
Victor St
Length: 0.45 miles
Direction: SW-NE
Address range: 4400 to 4899
Direction: SW-NE
Address range: 4400 to 4899
Elm St
Length: 0.44 miles
Direction: SW-NE
Address range: 4400 to 4899
Direction: SW-NE
Address range: 4400 to 4899
Reiger Ave
Length: 0.37 miles
Direction: SW-NE
Address range: 4500 to 4899
Direction: SW-NE
Address range: 4500 to 4899
N Haskell Ave
Length: 0.31 miles
Direction: SE-NW
Address range: 600 to 1099
Direction: SE-NW
Address range: 600 to 1099
Alcalde St
Length: 0.29 miles
Direction: SE-NW
Address range: 200 to 599
Direction: SE-NW
Address range: 200 to 599
Grigsby Ave
Length: 0.28 miles
Direction: SE-NW
Address range: 900 to 1299
Direction: SE-NW
Address range: 900 to 1299
Annex Ave
Length: 0.27 miles
Direction: SE-NW
Address range: 900 to 1299
Direction: SE-NW
Address range: 900 to 1299
Tremont St
Length: 0.22 miles
Direction: SW-NE
Address range: 4700 to 4899
Direction: SW-NE
Address range: 4700 to 4899
Moreland Ave
Length: 0.19 miles
Direction: SE-NW
Address range: 900 to 1199
Direction: SE-NW
Address range: 900 to 1199
N Colson St
Length: 0.11 miles
Direction: SE-NW
Address range: 100 to 299
Direction: SE-NW
Address range: 100 to 299
N Cisco St
Length: 0.11 miles
Direction: SE-NW
Address range: 100 to 299
Direction: SE-NW
Address range: 100 to 299
Main St
Length: 0.05 miles
Directions: N-S, SW-NE
Address range: 4413 to 4499
Directions: N-S, SW-NE
Address range: 4413 to 4499
Trellis Ct
Length: 0.05 miles
Direction: SW-NE
Address range: 4300 to 4399
Direction: SW-NE
Address range: 4300 to 4399
S Carroll Ave
Length: 0.02 miles
Direction: SE-NW
Address range: 100 to 109
Direction: SE-NW
Address range: 100 to 109
S Fitzhugh Ave
Length: 0.01 miles
Direction: SE-NW
Address range: 100 to 115
Direction: SE-NW
Address range: 100 to 115