Monica Park neighborhood in Garland, Texas (TX), 75041 detailed profile
Settings
X


Business Search - 14 Million verified businesses
Area: 0.379 square miles
Population: 2,793
Population density:
| Monica Park: | 7,364 people per square mile |
| Garland: | 4,214 people per square mile |

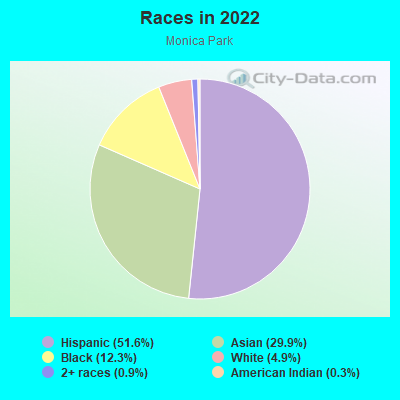
- 2,24951.6%Hispanic or Latino
- 1,30129.9%Asian
- 53712.3%Black
- 2134.9%White
- 410.9%Two or more races
- 140.3%American Indian
Median household income in 2022:
| Monica Park: | $55,797 |
| Garland: | $71,191 |
Distribution of median household income
![Distribution of median household income]()
- 31Less than $10,000
- 157$10,000 to $19,999
- 137$20,000 to $29,999
- 109$30,000 to $39,999
- 152$40,000 to $49,999
- 135$50,000 to $59,999
- 50$60,000 to $74,999
- 190$75,000 to $99,999
- 38$100,000 to $124,999
- 30$125,000 to $149,999
- 4$150,000 to $199,999
- 80$200,000 or more

Distribution of owner-occupied house/condo value
![Distribution of owner-occupied house/condo value]()
- 33Less than $50,000
- 82$50,000 to $99,999
- 149$100,000 to $149,999
- 172$150,000 to $199,999
- 14$200,000 to $249,999
- 52$250,000 to $299,999
- 232$300,000 to $399,999
- 15$400,000 to $499,999
- 20$500,000 to $749,999
- 62$1,000,000 or more

Distribution of rent paid by renters
![Distribution of rent paid by renters]()
- 17$200 to $299
- 40$400 to $499
- 46$500 to $599
- 15$700 to $799
- 103$800 to $899
- 34$900 to $999
- 74$1,000 to $1,249
- 148$1,250 to $1,499
- 21$1,500 to $1,999

Median rent in 2022:
| Monica Park: | $1,076 |
| Garland: | $1,257 |
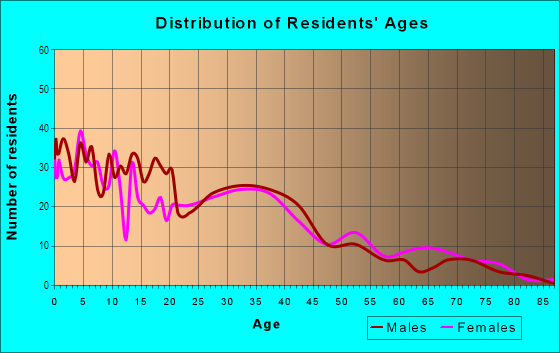
| Males: | 1,389 |
| Females: | 1,404 |
Males:
| This neighborhood: | 31.3 years |
| Whole city: | 33.8 years |
| This neighborhood: | 25.8 years |
| Whole city: | 35.1 years |
Average household size:
| Monica Park: | 3.6 people |
| Garland: | 2.9 people |
Percentage of family households:
| Monica Park: | 71.1% |
| Garland: | 56.1% |
| Here: | 41.1% |
| Garland: | 49.3% |
Percentage of married-couple families with children (among all households):
| Monica Park: | 19.5% |
| Garland: | 23.5% |
Percentage of single-mother households (among all households):
| Monica Park: | 7.9% |
| Garland: | 7.8% |
Percentage of never married males 15 years old and over:
Percentage of never married females 15 years old and over:
| Monica Park: | 28.7% |
| Garland: | 19.1% |
Percentage of never married females 15 years old and over:
| Monica Park: | 18.0% |
| city: | 15.9% |
Percentage of people that speak English not well or not at all:
| Monica Park: | 14.1% |
| Garland: | 9.6% |
Percentage of people born in this state:
Percentage of people born in another U.S. state:
Percentage of native residents but born outside the U.S.:
Percentage of foreign born residents:
| Here: | 53.8% |
| Garland: | 50.2% |
Percentage of people born in another U.S. state:
| Monica Park: | 9.7% |
| Garland: | 18.8% |
Percentage of native residents but born outside the U.S.:
| Here: | 0.3% |
| city: | 0.8% |
Percentage of foreign born residents:
| Here: | 36.3% |
| Garland: | 30.2% |
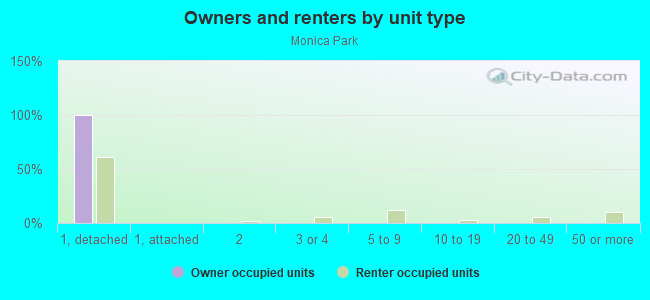
Owner-occupied
Renter-occupied

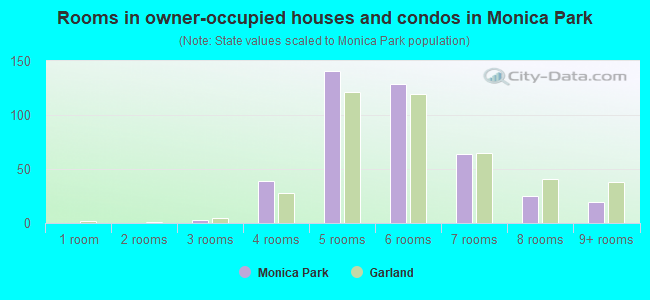
- Rooms in owner-occupied houses and condos in Monica Park
- 01 room
- 02 rooms
- 33 rooms
- 394 rooms
- 1415 rooms
- 1296 rooms
- 647 rooms
- 258 rooms
- 199+ rooms
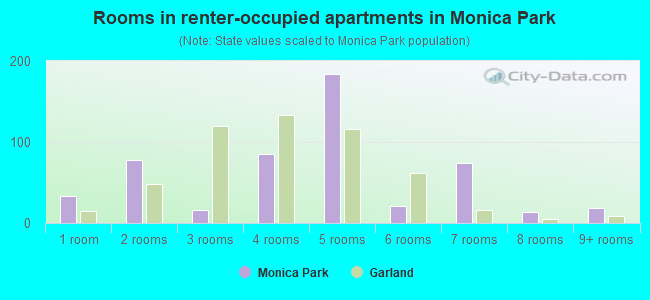
- Rooms in renter-occupied apartments in Monica Park
- 331 room
- 782 rooms
- 163 rooms
- 854 rooms
- 1845 rooms
- 216 rooms
- 747 rooms
- 148 rooms
- 199+ rooms
Owner-occupied
Renter-occupied
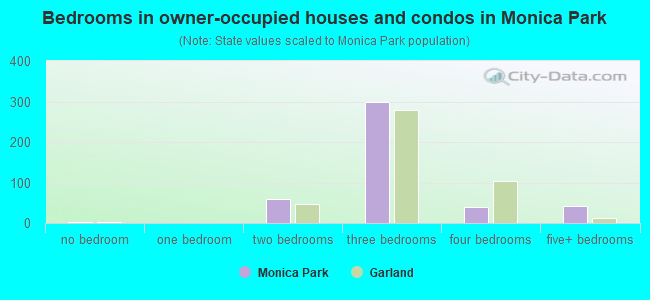
- Bedrooms in owner-occupied houses and condos in Monica Park
- 3no bedroom
- 01 bedroom
- 592 bedrooms
- 2993 bedrooms
- 404 bedrooms
- 425+ bedrooms
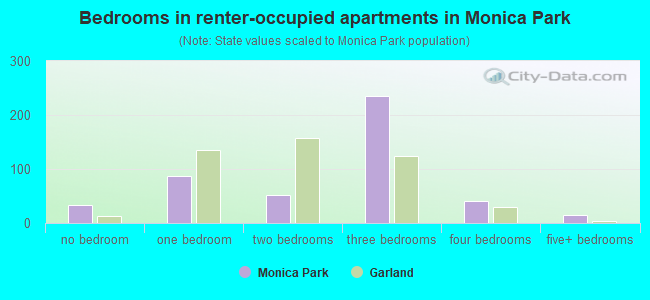
- Bedrooms in renter-occupied apartments in Monica Park
- 33no bedroom
- 871 bedroom
- 512 bedrooms
- 2363 bedrooms
- 414 bedrooms
- 145+ bedrooms
Average number of cars or other vehicles available in houses/condos:
Average number of cars or other vehicles available in apartments:
| This neighborhood: | 2.0 |
| Garland: | 2.2 |
Average number of cars or other vehicles available in apartments:
| Here: | 1.9 |
| city: | 1.6 |
Percentage of units with a mortgage:
| Monica Park: | 31.2% |
| Garland: | 59.5% |
Average estimated value of detached houses in 2022 (93.8% of all units):
| Monica Park: | $315,512 |
| Garland: | $265,641 |
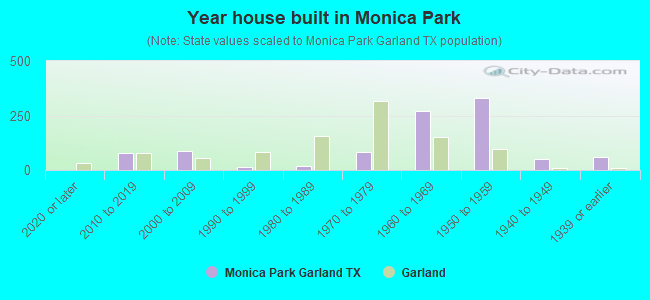
- Year house built in Monica Park
- 02020 or later
- 772010 to 2019
- 852000 to 2009
- 161990 to 1999
- 191980 to 1989
- 841970 to 1979
- 2691960 to 1969
- 3291950 to 1959
- 511940 to 1949
- 581939 or earlier
City-data.com crime index for city in 2020 (higher means more crime):
| City: | 222.1 |
| U.S. average: | 219.5 |
Travel time to work (commute)
![Travel time to work (commute)]()
- 7Less than 5 minutes
- 245 to 9 minutes
- 6710 to 14 minutes
- 8015 to 19 minutes
- 9320 to 24 minutes
- 4525 to 29 minutes
- 27230 to 34 minutes
- 135 to 39 minutes
- 2540 to 44 minutes
- 13945 to 59 minutes
- 14160 to 89 minutes
- 2290 or more minutes

Means of transportation to work
![Means of transportation to work]()
- 80.2%789Drove a car alone
- 15.3%151Carpooled
- 1.5%15Bus
- 0.7%7Walked
- 3.6%35Other means
- 5.3%52Worked at home

Time leaving home to go to work
![Time leaving home to go to work]()
- 7612:00 a.m. to 4:59 a.m.
- 205:00 a.m. to 5:29 a.m.
- 675:30 a.m. to 5:59 a.m.
- 1446:00 a.m. to 6:29 a.m.
- 1326:30 a.m. to 6:59 a.m.
- 1137:00 a.m. to 7:29 a.m.
- 1247:30 a.m. to 7:59 a.m.
- 818:00 a.m. to 8:29 a.m.
- 588:30 a.m. to 8:59 a.m.
- 649:00 a.m. to 9:59 a.m.
- 1210:00 a.m. to 10:59 a.m.
- 711:00 a.m. to 11:59 a.m.
- 4612:00 p.m. to 3:59 p.m.
- 214:00 p.m. to 11:59 p.m.

Occupations of males:
- Percentage of males in management occupations (except farmers):
Here: 2.3% city: 7.6%
- Percentage of males in business and financial operations occupations:
Here: 1.8% city: 2.9%
- Percentage of males in service occupations:
Here: 11.8% city: 14.0%
- Percentage of males in sales and office occupations:
Here: 3.0% city: 15.2%
- Percentage of males in construction, extraction, and maintenance occupations:
Here: 37.7% city: 17.9%
- Percentage of males in production occupations:
Here: 15.2% city: 8.4%
- Percentage of males in transportation occupations:
Here: 11.5% city: 6.5%
- Percentage of males in material moving occupations:
Here: 5.9% city: 4.7%
Occupations of females:
- Percentage of females in community and social services occupations:
Here: 1.2% city: 1.4%
- Percentage of females in healthcare practitioners and technical occupations:
Here: 10.1% city: 6.3%
- Percentage of females in service occupations:
Here: 28.0% city: 25.4%
- Percentage of females in sales and office occupations:
Here: 30.5% city: 30.7%
- Percentage of females in construction, extraction, and maintenance occupations:
Here: 5.1% city: 0.5%
- Percentage of females in production occupations:
Here: 15.0% city: 4.6%
- Percentage of females in transportation occupations:
Here: 7.4% city: 0.7%
- Percentage of females in material moving occupations:
Here: 2.5% city: 3.2%
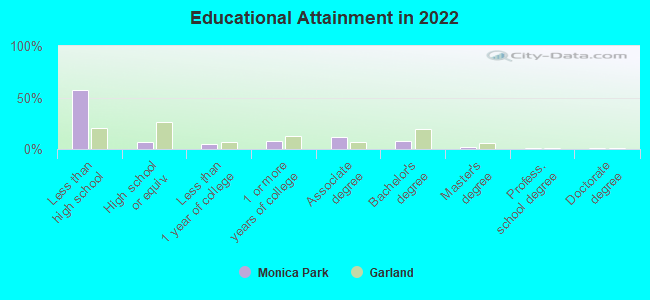
Education in this neighborhood (subdivision or community):
- Percentage of people 3 years and older in K-12 schools:
Monica Park: 31.5% Garland: 20.3%
- Percentage of people 3 years and older in undergraduate colleges:
Monica Park: 2.8% Garland: 3.5%
- Percentage of people 3 years and older in grad. or professional schools:
Monica Park: 1.5% Garland: 1.0%
- Percentage of students K-12 enrolled in private schools:
Monica Park: 5.5% Garland: 4.8%
Percentage of population below poverty level:
| Monica Park: | 21.8% |
| Garland: | 12.1% |
Median year owner moved in (as recorded in 2022):
Median year renter moved in (as recorded in 2022):
| Monica Park: | 2005 |
| Garland: | 2008 |
Median year renter moved in (as recorded in 2022):
| Monica Park: | 2018 |
| Garland: | 2020 |
Percentage of married-couple families with both working:
| Monica Park: | 13.7% |
| Garland: | 64.6% |
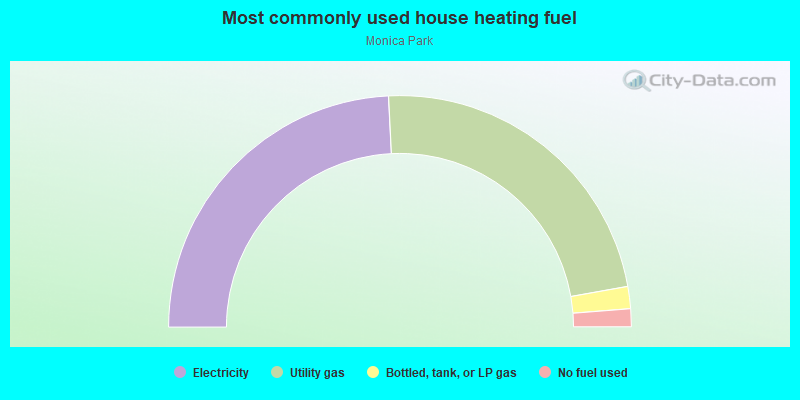
- 48.4%Electricity
- 45.9%Utility gas
- 3.1%Bottled, tank, or LP gas
- 2.5%No fuel used
Roads and streets:
Broadway Blvd
Length: 0.99 miles
Directions: N-S, SE-NW
Directions: N-S, SE-NW
Cumberland Dr
Length: 0.73 miles
Directions: N-S, SE-NW, SW-NE
Address range: 2001 to 2875
Directions: N-S, SE-NW, SW-NE
Address range: 2001 to 2875
E Vista Dr
Length: 0.67 miles
Directions: E-W, N-S
Address range: 124 to 799
Directions: E-W, N-S
Address range: 124 to 799
E Ridgewood Dr
Length: 0.60 miles
Direction: E-W
Address range: 122 to 799
Direction: E-W
Address range: 122 to 799
E Daugherty Dr
Length: 0.60 miles
Direction: E-W
Address range: 122 to 799
Direction: E-W
Address range: 122 to 799
E Linda Dr
Length: 0.60 miles
Direction: E-W
Address range: 120 to 799
Direction: E-W
Address range: 120 to 799
Wallace Dr
Length: 0.59 miles
Direction: E-W
Address range: 100 to 799
Direction: E-W
Address range: 100 to 799
Cascade Dr
Length: 0.59 miles
Direction: E-W
Address range: 118 to 799
Direction: E-W
Address range: 118 to 799
E Celeste Dr
Length: 0.56 miles
Directions: E-W, SW-NE
Address range: 115 to 799
Directions: E-W, SW-NE
Address range: 115 to 799
Dairy Rd
Length: 0.44 miles
Directions: N-S, SW-NE
Address range: 2025 to 2985
Directions: N-S, SW-NE
Address range: 2025 to 2985
Monica Dr
Length: 0.35 miles
Directions: E-W, N-S, SE-NW
Address range: 300 to 799
Directions: E-W, N-S, SE-NW
Address range: 300 to 799
Calvin Dr
Length: 0.28 miles
Direction: E-W
Address range: 500 to 799
Direction: E-W
Address range: 500 to 799
Hardy Dr
Length: 0.28 miles
Directions: E-W, SW-NE
Address range: 500 to 799
Directions: E-W, SW-NE
Address range: 500 to 799
Donald Dr
Length: 0.25 miles
Directions: E-W, SW-NE
Address range: 500 to 2663
Directions: E-W, SW-NE
Address range: 500 to 2663
Rilla Dr
Length: 0.20 miles
Directions: E-W, SW-NE
Address range: 600 to 2641
Directions: E-W, SW-NE
Address range: 600 to 2641
Dollye Dr
Length: 0.10 miles
Direction: N-S
Address range: 2100 to 2199
Direction: N-S
Address range: 2100 to 2199
Manor Dr
Length: 0.08 miles
Directions: N-S, SE-NW
Address range: 2700 to 2799
Directions: N-S, SE-NW
Address range: 2700 to 2799
Freemont Dr
Length: 0.06 miles
Direction: N-S
Address range: 2049 to 2099
Direction: N-S
Address range: 2049 to 2099
Cumberland Cir
Length: 0.05 miles
Direction: E-W
Address range: 500 to 599
Direction: E-W
Address range: 500 to 599