Mount Holly neighborhood in Baltimore, Maryland (MD), 21216 detailed profile
Settings
X


Business Search - 14 Million verified businesses
Area: 0.124 square miles
Population: 752
Population density:
| Mount Holly: | 6,050 people per square mile |
| Baltimore: | 7,053 people per square mile |

- 48764.2%Black
- 18824.8%Hispanic or Latino
- 719.4%Two or more races
- 131.7%White

Median household income in 2022:
| Mount Holly: | $79,634 |
| Baltimore: | $55,198 |
Distribution of median household income
![Distribution of median household income]()
- 107Less than $10,000
- 115$10,000 to $19,999
- 210$20,000 to $29,999
- 16$30,000 to $39,999
- 35$40,000 to $49,999
- 180$50,000 to $59,999
- 49$60,000 to $74,999
- 54$75,000 to $99,999
- 49$100,000 to $124,999
- 95$125,000 to $149,999
- 7$150,000 to $199,999
- 8$200,000 or more

Distribution of owner-occupied house/condo value
![Distribution of owner-occupied house/condo value]()
- 179Less than $50,000
- 32$50,000 to $99,999
- 64$100,000 to $149,999
- 37$150,000 to $199,999
- 55$200,000 to $249,999
- 83$250,000 to $299,999
- 23$300,000 to $399,999
- 9$400,000 to $499,999
- 16$1,000,000 or more

Distribution of rent paid by renters
![Distribution of rent paid by renters]()
- 11$100 to $199
- 155$200 to $299
- 94$300 to $399
- 4$400 to $499
- 5$500 to $599
- 26$600 to $699
- 137$700 to $799
- 19$800 to $899
- 192$900 to $999
- 52$1,000 to $1,249
- 7$1,250 to $1,499
- 14$1,500 to $1,999
- 12$2,000 or more

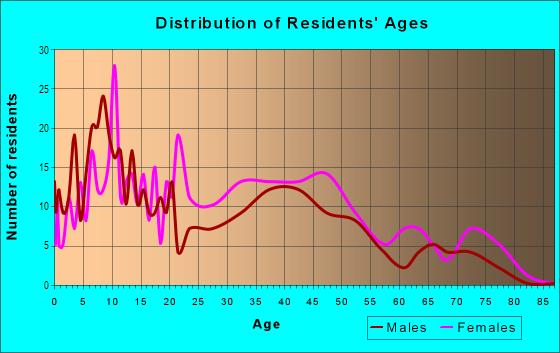
| Males: | 373 |
| Females: | 378 |
Males:
| This neighborhood: | 37.6 years |
| Whole city: | 35.0 years |
| This neighborhood: | 42.3 years |
| Whole city: | 38.2 years |
Average household size:
| Mount Holly: | 2.5 people |
| Baltimore: | 2.2 people |
Percentage of family households:
| Mount Holly: | 31.6% |
| Baltimore: | 34.2% |
| Here: | 24.0% |
| Baltimore: | 23.3% |
Percentage of married-couple families with children (among all households):
| Mount Holly: | 25.6% |
| Baltimore: | 22.4% |
Percentage of single-mother households (among all households):
| Mount Holly: | 157.3% |
| Baltimore: | 18.7% |
Percentage of never married males 15 years old and over:
Percentage of never married females 15 years old and over:
| Mount Holly: | 21.2% |
| Baltimore: | 25.1% |
Percentage of never married females 15 years old and over:
| Mount Holly: | 17.3% |
| city: | 27.5% |
Percentage of people that speak English not well or not at all:
| Mount Holly: | 0.0% |
| Baltimore: | 2.3% |
Percentage of people born in this state:
Percentage of people born in another U.S. state:
Percentage of native residents but born outside the U.S.:
Percentage of foreign born residents:
| Here: | 74.2% |
| Baltimore: | 64.4% |
Percentage of people born in another U.S. state:
| Mount Holly: | 21.5% |
| Baltimore: | 25.0% |
Percentage of native residents but born outside the U.S.:
| Here: | 1.0% |
| city: | 0.9% |
Percentage of foreign born residents:
| Here: | 4.0% |
| Baltimore: | 9.7% |

Owner-occupied
Renter-occupied


- Rooms in owner-occupied houses and condos in Mount Holly
- 01 room
- 02 rooms
- 43 rooms
- 1154 rooms
- 25 rooms
- 386 rooms
- 587 rooms
- 358 rooms
- 749+ rooms

- Rooms in renter-occupied apartments in Mount Holly
- 601 room
- 42 rooms
- 73 rooms
- 4434 rooms
- 125 rooms
- 596 rooms
- 1057 rooms
- 308 rooms
- 89+ rooms
Owner-occupied
Renter-occupied

- Bedrooms in owner-occupied houses and condos in Mount Holly
- 0no bedroom
- 41 bedroom
- 242 bedrooms
- 793 bedrooms
- 514 bedrooms
- 465+ bedrooms

- Bedrooms in renter-occupied apartments in Mount Holly
- 60no bedroom
- 501 bedroom
- 712 bedrooms
- 203 bedrooms
- 884 bedrooms
- 115+ bedrooms
Average number of cars or other vehicles available in houses/condos:
Average number of cars or other vehicles available in apartments:
| This neighborhood: | 6.3 |
| Baltimore: | 1.5 |
Average number of cars or other vehicles available in apartments:
| Here: | 3.6 |
| city: | 0.8 |
Percentage of units with a mortgage:
| Mount Holly: | 63.8% |
| Baltimore: | 64.3% |
Housing prices:
- Average estimated value of detached houses in 2022 (34.6% of all units):
Mount Holly: $237,164 Baltimore: $350,815
- Average estimated value of townhouses or other attached units in 2022 (38.4% of all units):
This neighborhood: $171,322 city: $206,258

- Year house built in Mount Holly
- 02020 or later
- 1202010 to 2019
- 922000 to 2009
- 881990 to 1999
- 71980 to 1989
- 201970 to 1979
- 461960 to 1969
- 1021950 to 1959
- 161940 to 1949
- 2231939 or earlier

Travel time to work (commute)
![Travel time to work (commute)]()
- 255 to 9 minutes
- 1010 to 14 minutes
- 12115 to 19 minutes
- 9720 to 24 minutes
- 3725 to 29 minutes
- 6530 to 34 minutes
- 1635 to 39 minutes
- 540 to 44 minutes
- 4845 to 59 minutes
- 3260 to 89 minutes
- 2190 or more minutes

Means of transportation to work
![Means of transportation to work]()
- 61.1%162Drove a car alone
- 2.3%6Carpooled
- 9.8%26Bus
- 1.9%5Subway or elevated rail
- 1.5%4Long-distance train or commuter rail
- 2.6%7Taxi
- 5.7%15Walked
- 6.8%18Other means
- 27.5%73Worked at home

Time leaving home to go to work
![Time leaving home to go to work]()
- 4912:00 a.m. to 4:59 a.m.
- 105:00 a.m. to 5:29 a.m.
- 435:30 a.m. to 5:59 a.m.
- 876:00 a.m. to 6:29 a.m.
- 586:30 a.m. to 6:59 a.m.
- 787:00 a.m. to 7:29 a.m.
- 447:30 a.m. to 7:59 a.m.
- 188:00 a.m. to 8:29 a.m.
- 68:30 a.m. to 8:59 a.m.
- 429:00 a.m. to 9:59 a.m.
- 410:00 a.m. to 10:59 a.m.
- 1212:00 p.m. to 3:59 p.m.
- 404:00 p.m. to 11:59 p.m.

Occupations of males:
- Percentage of males in management occupations (except farmers):
Here: 1.8% city: 10.7%
- Percentage of males in business and financial operations occupations:
Here: 26.2% city: 5.9%
- Percentage of males in computer and mathematical occupations:
Here: 9.8% city: 6.1%
- Percentage of males in community and social services occupations:
Here: 3.3% city: 1.6%
- Percentage of males in legal occupations:
Here: 1.6% city: 1.8%
- Percentage of males in education, training, and library occupations:
Here: 3.8% city: 5.4%
- Percentage of males in arts, design, entertainment, sports, and media occupations:
Here: 2.4% city: 2.8%
- Percentage of males in healthcare practitioners and technical occupations:
Here: 8.9% city: 4.0%
- Percentage of males in service occupations:
Here: 11.4% city: 14.7%
- Percentage of males in sales and office occupations:
Here: 13.2% city: 14.2%
- Percentage of males in construction, extraction, and maintenance occupations:
Here: 23.6% city: 5.6%
- Percentage of males in production occupations:
Here: 4.3% city: 4.2%
- Percentage of males in transportation occupations:
Here: 14.5% city: 6.8%
- Percentage of males in material moving occupations:
Here: 6.3% city: 7.0%
Occupations of females:
- Percentage of females in management occupations (except farmers):
Here: 5.3% city: 10.1%
- Percentage of females in business and financial operations occupations:
Here: 8.4% city: 6.6%
- Percentage of females in computer and mathematical occupations:
Here: 1.2% city: 2.4%
- Percentage of females in architecture and engineering occupations:
Here: 1.3% city: 0.9%
- Percentage of females in community and social services occupations:
Here: 3.0% city: 3.6%
- Percentage of females in legal occupations:
Here: 5.0% city: 1.8%
- Percentage of females in education, training, and library occupations:
Here: 3.5% city: 10.7%
- Percentage of females in healthcare practitioners and technical occupations:
Here: 9.2% city: 9.8%
- Percentage of females in service occupations:
Here: 20.1% city: 20.4%
- Percentage of females in sales and office occupations:
Here: 38.0% city: 22.3%
- Percentage of females in transportation occupations:
Here: 10.2% city: 1.7%
- Percentage of females in material moving occupations:
Here: 6.3% city: 1.9%
Education in this neighborhood (subdivision or community):
- Percentage of people 3 years and older in K-12 schools:
Mount Holly: 105.6% Baltimore: 14.7%
- Percentage of people 3 years and older in undergraduate colleges:
Mount Holly: 30.2% Baltimore: 6.0%
- Percentage of people 3 years and older in grad. or professional schools:
Mount Holly: 1.9% Baltimore: 2.8%
- Percentage of students K-12 enrolled in private schools:
Mount Holly: 5.3% Baltimore: 12.7%
Percentage of population below poverty level:
| Mount Holly: | 19.1% |
| Baltimore: | 18.5% |
Median year owner moved in (as recorded in 2022):
| Mount Holly: | 1999 |
| Baltimore: | 2009 |
Percentage of married-couple families with both working:
| Mount Holly: | 100.0% |
| Baltimore: | 79.2% |

- 52.2%Utility gas
- 20.8%Electricity
- 14.9%Bottled, tank, or LP gas
- 7.3%Fuel oil, kerosene, etc.
- 4.7%No fuel used
Roads and streets:
Gwynns Falls Pkwy
Length: 0.98 miles
Directions: E-W, SW-NE
Address range: 3400 to 3899
Directions: E-W, SW-NE
Address range: 3400 to 3899
Windsor Mill Rd
Length: 0.68 miles
Directions: E-W, SE-NW
Address range: 3500 to 4099
Directions: E-W, SE-NW
Address range: 3500 to 4099
Garrison Blvd
Length: 0.53 miles
Directions: E-W, SE-NW
Address range: 2100 to 2299
Directions: E-W, SE-NW
Address range: 2100 to 2299
Roslyn Ave
Length: 0.19 miles
Direction: SE-NW
Address range: 2200 to 2299
Direction: SE-NW
Address range: 2200 to 2299
Elsinore Ave
Length: 0.17 miles
Directions: N-S, SE-NW
Address range: 2108 to 2299
Directions: N-S, SE-NW
Address range: 2108 to 2299
Holly Ave
Length: 0.13 miles
Directions: E-W, SW-NE
Directions: E-W, SW-NE
Clifton Ave
Length: 0.12 miles
Direction: E-W
Direction: E-W
Elgin Ave
Length: 0.12 miles
Direction: E-W
Address range: 3400 to 3499
Direction: E-W
Address range: 3400 to 3499
Allendale Rd
Length: 0.10 miles
Direction: N-S
Address range: 2200 to 2299
Direction: N-S
Address range: 2200 to 2299
Knight Ct
Length: 0.08 miles
Direction: SE-NW
Address range: 2200 to 2299
Direction: SE-NW
Address range: 2200 to 2299
Chelsea Ter
Length: 0.07 miles
Direction: N-S
Address range: 2200 to 2299
Direction: N-S
Address range: 2200 to 2299
Lyndhurst Ave
Length: 0.07 miles
Direction: N-S
Address range: 2200 to 2299
Direction: N-S
Address range: 2200 to 2299
Mount Holly St
Length: 0.06 miles
Direction: N-S
Address range: 2200 to 2299
Direction: N-S
Address range: 2200 to 2299
Windsor Ave
Length: 0.05 miles
Direction: E-W
Address range: 3500 to 3599
Direction: E-W
Address range: 3500 to 3599