Proctor neighborhood in Tacoma, Washington (WA), 98406, 98407 detailed profile
Settings
X


Business Search - 14 Million verified businesses
Area: 0.037 square miles
Population: 369
Population density:
| Proctor: | 9,934 people per square mile |
| Tacoma: | 4,429 people per square mile |

- 28876.2%White
- 338.7%Two or more races
- 256.6%Black
- 246.3%Hispanic or Latino
- 82.1%Some other race

Median household income in 2022:
| Proctor: | $111,359 |
| Tacoma: | $80,784 |
Distribution of median household income
![Distribution of median household income]()
- 1Less than $10,000
- 20$10,000 to $19,999
- 8$20,000 to $29,999
- 20$30,000 to $39,999
- 3$40,000 to $49,999
- 3$50,000 to $59,999
- 21$60,000 to $74,999
- 32$75,000 to $99,999
- 54$100,000 to $124,999
- 7$125,000 to $149,999
- 19$150,000 to $199,999
- 31$200,000 or more

Distribution of owner-occupied house/condo value
![Distribution of owner-occupied house/condo value]()
- 1$50,000 to $99,999
- 1$100,000 to $149,999
- 5$150,000 to $199,999
- 3$250,000 to $299,999
- 38$300,000 to $399,999
- 30$400,000 to $499,999
- 46$500,000 to $749,999
- 13$750,000 to $999,999
- 11$1,000,000 or more

Distribution of rent paid by renters
![Distribution of rent paid by renters]()
- 1$300 to $399
- 2$500 to $599
- 1$600 to $699
- 4$700 to $799
- 1$900 to $999
- 9$1,000 to $1,249
- 3$1,250 to $1,499
- 40$1,500 to $1,999
- 23$2,000 or more

Median rent in 2022:
| Proctor: | $1,810 |
| Tacoma: | $1,426 |
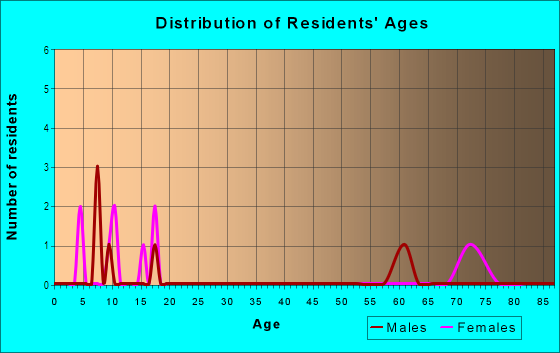
| Males: | 186 |
| Females: | 182 |
Males:
| This neighborhood: | 41.5 years |
| Whole city: | 36.0 years |
| This neighborhood: | 46.1 years |
| Whole city: | 38.1 years |
Average household size:
| Proctor: | 2.0 people |
| Tacoma: | 2.4 people |
Percentage of family households:
| Proctor: | 36.5% |
| Tacoma: | 43.7% |
| Here: | 38.0% |
| Tacoma: | 39.9% |
Percentage of married-couple families with children (among all households):
| Proctor: | 33.2% |
| Tacoma: | 27.8% |
Percentage of single-mother households (among all households):
| Proctor: | 7.5% |
| Tacoma: | 8.6% |
Percentage of never married males 15 years old and over:
Percentage of never married females 15 years old and over:
| Proctor: | 12.0% |
| Tacoma: | 20.8% |
Percentage of never married females 15 years old and over:
| Proctor: | 7.8% |
| city: | 17.5% |
Percentage of people that speak English not well or not at all:
| Proctor: | 0.0% |
| Tacoma: | 3.1% |
Percentage of people born in this state:
Percentage of people born in another U.S. state:
Percentage of native residents but born outside the U.S.:
Percentage of foreign born residents:
| Here: | 56.3% |
| Tacoma: | 48.7% |
Percentage of people born in another U.S. state:
| Proctor: | 37.9% |
| Tacoma: | 37.0% |
Percentage of native residents but born outside the U.S.:
| Here: | 2.7% |
| city: | 2.4% |
Percentage of foreign born residents:
| Here: | 3.1% |
| Tacoma: | 12.0% |

Owner-occupied
Renter-occupied


- Rooms in owner-occupied houses and condos in Proctor
- 01 room
- 02 rooms
- 163 rooms
- 134 rooms
- 95 rooms
- 226 rooms
- 107 rooms
- 228 rooms
- 299+ rooms

- Rooms in renter-occupied apartments in Proctor
- 401 room
- 42 rooms
- 23 rooms
- 94 rooms
- 85 rooms
- 166 rooms
- 27 rooms
- 108 rooms
- 19+ rooms
Owner-occupied
Renter-occupied

- Bedrooms in owner-occupied houses and condos in Proctor
- 0no bedroom
- 131 bedroom
- 272 bedrooms
- 483 bedrooms
- 314 bedrooms
- 75+ bedrooms

- Bedrooms in renter-occupied apartments in Proctor
- 40no bedroom
- 71 bedroom
- 222 bedrooms
- 83 bedrooms
- 164 bedrooms
- 05+ bedrooms
Average number of cars or other vehicles available in houses/condos:
Average number of cars or other vehicles available in apartments:
| This neighborhood: | 2.0 |
| Tacoma: | 2.2 |
Average number of cars or other vehicles available in apartments:
| Here: | 1.0 |
| city: | 1.2 |
Percentage of units with a mortgage:
| Proctor: | 82.2% |
| Tacoma: | 72.4% |
Average estimated value of detached houses in 2022 (72.7% of all units):
| Proctor: | $522,129 |
| Washington: | $734,307 |

- Year house built in Proctor
- 02020 or later
- 442010 to 2019
- 32000 to 2009
- 261990 to 1999
- 51980 to 1989
- 81970 to 1979
- 161960 to 1969
- 311950 to 1959
- 621940 to 1949
- 261939 or earlier

City-data.com crime index for city in 2020 (higher means more crime):
| City: | 532.7 |
| U.S. average: | 219.5 |
Travel time to work (commute)
![Travel time to work (commute)]()
- 2Less than 5 minutes
- 145 to 9 minutes
- 1710 to 14 minutes
- 1315 to 19 minutes
- 1220 to 24 minutes
- 225 to 29 minutes
- 1030 to 34 minutes
- 335 to 39 minutes
- 840 to 44 minutes
- 1445 to 59 minutes
- 360 to 89 minutes
- 690 or more minutes

Means of transportation to work
![Means of transportation to work]()
- 77.9%171Drove a car alone
- 5.9%13Carpooled
- 0.5%1Bus
- 1.8%4Long-distance train or commuter rail
- 0.5%1Motorcycle
- 0.5%1Walked
- 14.6%32Worked at home

Time leaving home to go to work
![Time leaving home to go to work]()
- 412:00 a.m. to 4:59 a.m.
- 35:00 a.m. to 5:29 a.m.
- 45:30 a.m. to 5:59 a.m.
- 56:00 a.m. to 6:29 a.m.
- 96:30 a.m. to 6:59 a.m.
- 207:00 a.m. to 7:29 a.m.
- 127:30 a.m. to 7:59 a.m.
- 108:00 a.m. to 8:29 a.m.
- 38:30 a.m. to 8:59 a.m.
- 79:00 a.m. to 9:59 a.m.
- 110:00 a.m. to 10:59 a.m.
- 512:00 p.m. to 3:59 p.m.
- 124:00 p.m. to 11:59 p.m.

Occupations of males:
- Percentage of males in management occupations (except farmers):
Here: 12.3% city: 9.1%
- Percentage of males in business and financial operations occupations:
Here: 7.8% city: 5.1%
- Percentage of males in computer and mathematical occupations:
Here: 2.1% city: 4.4%
- Percentage of males in community and social services occupations:
Here: 2.4% city: 1.7%
- Percentage of males in legal occupations:
Here: 6.2% city: 1.1%
- Percentage of males in education, training, and library occupations:
Here: 4.0% city: 3.2%
- Percentage of males in healthcare practitioners and technical occupations:
Here: 14.0% city: 3.5%
- Percentage of males in service occupations:
Here: 2.9% city: 15.1%
- Percentage of males in sales and office occupations:
Here: 10.6% city: 13.9%
- Percentage of males in construction, extraction, and maintenance occupations:
Here: 10.2% city: 9.4%
- Percentage of males in transportation occupations:
Here: 1.7% city: 7.7%
- Percentage of males in material moving occupations:
Here: 1.7% city: 8.1%
Occupations of females:
- Percentage of females in management occupations (except farmers):
Here: 9.6% city: 9.6%
- Percentage of females in business and financial operations occupations:
Here: 7.9% city: 7.0%
- Percentage of females in computer and mathematical occupations:
Here: 2.2% city: 1.9%
- Percentage of females in life, physical, and social science occupations:
Here: 1.2% city: 1.3%
- Percentage of females in community and social services occupations:
Here: 2.9% city: 3.4%
- Percentage of females in education, training, and library occupations:
Here: 22.1% city: 10.0%
- Percentage of females in arts, design, entertainment, sports, and media occupations:
Here: 1.1% city: 1.8%
- Percentage of females in healthcare practitioners and technical occupations:
Here: 12.4% city: 9.0%
- Percentage of females in service occupations:
Here: 13.9% city: 20.7%
- Percentage of females in sales and office occupations:
Here: 25.9% city: 25.0%
- Percentage of females in production occupations:
Here: 1.7% city: 2.5%
- Percentage of females in transportation occupations:
Here: 1.2% city: 1.7%
- Percentage of females in material moving occupations:
Here: 1.3% city: 2.5%
Percentage of people 16-64 in Armed Forces:
| Proctor: | 1.6% |
| Tacoma: | 1.4% |
Education in this neighborhood (subdivision or community):
- Percentage of people 3 years and older in K-12 schools:
Proctor: 18.2% Tacoma: 14.0%
- Percentage of people 3 years and older in undergraduate colleges:
Proctor: 0.6% Tacoma: 5.4%
- Percentage of people 3 years and older in grad. or professional schools:
Proctor: 2.5% Tacoma: 1.6%
- Percentage of students K-12 enrolled in private schools:
Proctor: 13.6% Tacoma: 12.6%
Percentage of population below poverty level:
| Proctor: | 1.7% |
| Tacoma: | 14.2% |
Median year owner moved in (as recorded in 2022):
Median year renter moved in (as recorded in 2022):
| Proctor: | 2000 |
| Tacoma: | 2013 |
Median year renter moved in (as recorded in 2022):
| Proctor: | 2019 |
| Tacoma: | 2020 |
Percentage of married-couple families with both working:
| Proctor: | 87.6% |
| Tacoma: | 65.1% |

- 62.8%Electricity
- 26.3%Utility gas
- 5.8%Fuel oil, kerosene, etc.
- 3.5%Other fuel
- 1.6%Bottled, tank, or LP gas
Roads and streets:
N Proctor St
Length: 0.19 miles
Direction: N-S
Address range: 2400 to 2699
Direction: N-S
Address range: 2400 to 2699
N Adams St
Length: 0.16 miles
Direction: N-S
Address range: 2400 to 2781
Direction: N-S
Address range: 2400 to 2781
N 26th St
Length: 0.11 miles
Direction: E-W
Address range: 3800 to 3899
Direction: E-W
Address range: 3800 to 3899
N 27th St
Length: 0.11 miles
Direction: E-W
Address range: 3713 to 3899
Direction: E-W
Address range: 3713 to 3899
N 25th St
Length: 0.11 miles
Direction: E-W
Address range: 3800 to 3899
Direction: E-W
Address range: 3800 to 3899
N 24th St
Length: 0.11 miles
Direction: E-W
Address range: 3800 to 3899
Direction: E-W
Address range: 3800 to 3899