Stonecrest Estates neighborhood in Mesquite, Texas (TX), 75150 detailed profile
Settings
X


Business Search - 14 Million verified businesses
Area: 0.108 square miles
Population: 643
Population density:
| Stonecrest Estates: | 5,961 people per square mile |
| Mesquite: | 3,403 people per square mile |

- 31148.4%Hispanic or Latino
- 21333.2%White
- 6910.7%Black
- 355.5%Asian
- 132.0%Two or more races
- 10.2%American Indian

Median household income in 2022:
| Stonecrest Estates: | $80,595 |
| Mesquite: | $68,134 |
Distribution of median household income
![Distribution of median household income]()
- 8Less than $10,000
- 21$10,000 to $19,999
- 13$20,000 to $29,999
- 16$30,000 to $39,999
- 11$40,000 to $49,999
- 12$50,000 to $59,999
- 41$60,000 to $74,999
- 42$75,000 to $99,999
- 48$100,000 to $124,999
- 18$125,000 to $149,999
- 14$150,000 to $199,999
- 12$200,000 or more

Distribution of owner-occupied house/condo value
![Distribution of owner-occupied house/condo value]()
- 1Less than $50,000
- 2$50,000 to $99,999
- 8$100,000 to $149,999
- 31$150,000 to $199,999
- 53$200,000 to $249,999
- 35$250,000 to $299,999
- 26$300,000 to $399,999
- 11$400,000 to $499,999
- 2$500,000 to $749,999
- 5$750,000 to $999,999

Distribution of rent paid by renters
![Distribution of rent paid by renters]()
- 9$500 to $599
- 4$800 to $899
- 17$900 to $999
- 41$1,000 to $1,249
- 4$1,250 to $1,499
- 11$1,500 to $1,999

Median rent in 2022:
| Stonecrest Estates: | $1,079 |
| Mesquite: | $1,156 |
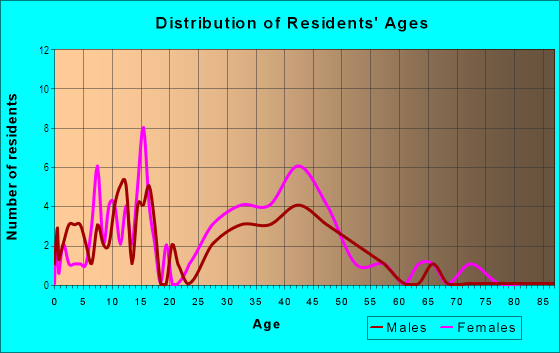
| Males: | 325 |
| Females: | 317 |
Males:
| This neighborhood: | 30.7 years |
| Whole city: | 30.8 years |
| This neighborhood: | 47.7 years |
| Whole city: | 33.8 years |
Average household size:
| Stonecrest Estates: | 2.6 people |
| Mesquite: | 2.9 people |
Percentage of family households:
| Stonecrest Estates: | 47.1% |
| Mesquite: | 55.6% |
| Here: | 43.6% |
| Mesquite: | 43.4% |
Percentage of married-couple families with children (among all households):
| Stonecrest Estates: | 18.8% |
| Mesquite: | 20.2% |
Percentage of single-mother households (among all households):
| Stonecrest Estates: | 12.1% |
| Mesquite: | 12.3% |
Percentage of never married males 15 years old and over:
Percentage of never married females 15 years old and over:
| Stonecrest Estates: | 14.9% |
| Mesquite: | 20.1% |
Percentage of never married females 15 years old and over:
| Stonecrest Estates: | 11.4% |
| city: | 18.2% |
Percentage of people that speak English not well or not at all:
| Stonecrest Estates: | 5.9% |
| Mesquite: | 8.1% |
Percentage of people born in this state:
Percentage of people born in another U.S. state:
Percentage of native residents but born outside the U.S.:
Percentage of foreign born residents:
| Here: | 60.4% |
| Mesquite: | 62.9% |
Percentage of people born in another U.S. state:
| Stonecrest Estates: | 14.9% |
| Mesquite: | 17.6% |
Percentage of native residents but born outside the U.S.:
| Here: | 0.5% |
| city: | 1.3% |
Percentage of foreign born residents:
| Here: | 24.1% |
| Mesquite: | 18.2% |

Owner-occupied
Renter-occupied


- Rooms in owner-occupied houses and condos in Stonecrest Estates
- 01 room
- 02 rooms
- 13 rooms
- 64 rooms
- 305 rooms
- 196 rooms
- 337 rooms
- 538 rooms
- 169+ rooms

- Rooms in renter-occupied apartments in Stonecrest Estates
- 71 room
- 42 rooms
- 83 rooms
- 294 rooms
- 285 rooms
- 36 rooms
- 07 rooms
- 08 rooms
- 59+ rooms
Owner-occupied
Renter-occupied

- Bedrooms in owner-occupied houses and condos in Stonecrest Estates
- 0no bedroom
- 11 bedroom
- 122 bedrooms
- 733 bedrooms
- 664 bedrooms
- 75+ bedrooms

- Bedrooms in renter-occupied apartments in Stonecrest Estates
- 7no bedroom
- 191 bedroom
- 402 bedrooms
- 83 bedrooms
- 04 bedrooms
- 55+ bedrooms
Average number of cars or other vehicles available in houses/condos:
Average number of cars or other vehicles available in apartments:
| This neighborhood: | 2.0 |
| Mesquite: | 2.2 |
Average number of cars or other vehicles available in apartments:
| Here: | 1.5 |
| city: | 1.6 |
Percentage of units with a mortgage:
| Stonecrest Estates: | 66.8% |
| Mesquite: | 62.3% |

- Year house built in Stonecrest Estates
- 82020 or later
- 102010 to 2019
- 452000 to 2009
- 371990 to 1999
- 751980 to 1989
- 1011970 to 1979
- 01960 to 1969
- 01950 to 1959
- 21940 to 1949
- 41939 or earlier

City-data.com crime index for city in 2020 (higher means more crime):
| City: | 322.7 |
| U.S. average: | 219.5 |
Travel time to work (commute)
![Travel time to work (commute)]()
- 4Less than 5 minutes
- 155 to 9 minutes
- 1010 to 14 minutes
- 1915 to 19 minutes
- 2920 to 24 minutes
- 925 to 29 minutes
- 8430 to 34 minutes
- 535 to 39 minutes
- 640 to 44 minutes
- 4445 to 59 minutes
- 1460 to 89 minutes
- 290 or more minutes

Means of transportation to work
![Means of transportation to work]()
- 79.9%276Drove a car alone
- 9.0%31Carpooled
- 2.6%9Bus
- 0.3%1Walked
- 7.8%27Worked at home

Time leaving home to go to work
![Time leaving home to go to work]()
- 1112:00 a.m. to 4:59 a.m.
- 15:00 a.m. to 5:29 a.m.
- 75:30 a.m. to 5:59 a.m.
- 96:00 a.m. to 6:29 a.m.
- 246:30 a.m. to 6:59 a.m.
- 237:00 a.m. to 7:29 a.m.
- 197:30 a.m. to 7:59 a.m.
- 298:00 a.m. to 8:29 a.m.
- 328:30 a.m. to 8:59 a.m.
- 79:00 a.m. to 9:59 a.m.
- 1310:00 a.m. to 10:59 a.m.
- 911:00 a.m. to 11:59 a.m.
- 912:00 p.m. to 3:59 p.m.
- 434:00 p.m. to 11:59 p.m.

Occupations of males:
- Percentage of males in management occupations (except farmers):
Here: 3.3% city: 7.0%
- Percentage of males in business and financial operations occupations:
Here: 1.4% city: 2.5%
- Percentage of males in architecture and engineering occupations:
Here: 2.6% city: 2.0%
- Percentage of males in community and social services occupations:
Here: 1.9% city: 1.0%
- Percentage of males in education, training, and library occupations:
Here: 7.7% city: 2.4%
- Percentage of males in arts, design, entertainment, sports, and media occupations:
Here: 1.1% city: 0.8%
- Percentage of males in healthcare practitioners and technical occupations:
Here: 8.0% city: 1.2%
- Percentage of males in service occupations:
Here: 3.6% city: 13.7%
- Percentage of males in sales and office occupations:
Here: 27.0% city: 16.2%
- Percentage of males in construction, extraction, and maintenance occupations:
Here: 12.7% city: 19.2%
- Percentage of males in production occupations:
Here: 6.4% city: 5.8%
- Percentage of males in transportation occupations:
Here: 2.2% city: 9.4%
- Percentage of males in material moving occupations:
Here: 18.0% city: 8.6%
Occupations of females:
- Percentage of females in management occupations (except farmers):
Here: 3.4% city: 7.4%
- Percentage of females in business and financial operations occupations:
Here: 22.7% city: 5.0%
- Percentage of females in life, physical, and social science occupations:
Here: 2.2% city: 0.2%
- Percentage of females in community and social services occupations:
Here: 1.4% city: 1.3%
- Percentage of females in education, training, and library occupations:
Here: 8.4% city: 7.9%
- Percentage of females in arts, design, entertainment, sports, and media occupations:
Here: 2.1% city: 0.8%
- Percentage of females in healthcare practitioners and technical occupations:
Here: 3.8% city: 6.0%
- Percentage of females in service occupations:
Here: 6.7% city: 24.6%
- Percentage of females in sales and office occupations:
Here: 39.3% city: 34.0%
- Percentage of females in production occupations:
Here: 4.8% city: 3.1%
- Percentage of females in material moving occupations:
Here: 4.8% city: 3.9%
Education in this neighborhood (subdivision or community):
- Percentage of people 3 years and older in K-12 schools:
Stonecrest Estates: 22.2% Mesquite: 23.2%
- Percentage of people 3 years and older in undergraduate colleges:
Stonecrest Estates: 2.2% Mesquite: 4.1%
- Percentage of people 3 years and older in grad. or professional schools:
Stonecrest Estates: 1.9% Mesquite: 0.7%
- Percentage of students K-12 enrolled in private schools:
Stonecrest Estates: 2.1% Mesquite: 7.3%
Percentage of population below poverty level:
| Stonecrest Estates: | 10.3% |
| Mesquite: | 11.8% |
Median year owner moved in (as recorded in 2022):
Median year renter moved in (as recorded in 2022):
| Stonecrest Estates: | 2008 |
| Mesquite: | 2010 |
Median year renter moved in (as recorded in 2022):
| Stonecrest Estates: | 2016 |
| Mesquite: | 2020 |
Percentage of married-couple families with both working:
| Stonecrest Estates: | 74.8% |
| Mesquite: | 64.1% |

- 71.9%Electricity
- 26.0%Utility gas
- 1.1%No fuel used
- 1.0%Bottled, tank, or LP gas
Roads and streets:
Bonnywood Dr
Length: 0.28 miles
Directions: N-S, SW-NE
Address range: 4500 to 4699
Directions: N-S, SW-NE
Address range: 4500 to 4699
Blue Mesa Ln
Length: 0.25 miles
Direction: N-S
Address range: 4500 to 4799
Direction: N-S
Address range: 4500 to 4799
Julian Dr
Length: 0.23 miles
Directions: E-W, N-S, SE-NW
Address range: 4419 to 4625
Directions: E-W, N-S, SE-NW
Address range: 4419 to 4625
Rockcliff Dr
Length: 0.21 miles
Direction: N-S
Address range: 4400 to 4609
Direction: N-S
Address range: 4400 to 4609
Clear Lake Ln
Length: 0.21 miles
Directions: E-W, N-S
Directions: E-W, N-S
Keswick Ln
Length: 0.18 miles
Direction: E-W
Address range: 218 to 399
Direction: E-W
Address range: 218 to 399
Baccus Dr
Length: 0.14 miles
Direction: E-W
Direction: E-W
Millridge Dr
Length: 0.14 miles
Directions: N-S, SW-NE
Address range: 4700 to 4726
Directions: N-S, SW-NE
Address range: 4700 to 4726
Carrissa Dr
Length: 0.11 miles
Directions: E-W, SE-NW
Address range: 200 to 299
Directions: E-W, SE-NW
Address range: 200 to 299
Jamilia Ct
Length: 0.04 miles
Directions: E-W, SE-NW, SW-NE
Address range: 300 to 399
Directions: E-W, SE-NW, SW-NE
Address range: 300 to 399