Sunnyside neighborhood in College Park, Zaouia Akermoud, Maryland (MD), 20705, 20740 detailed profile
Settings
X


Business Search - 14 Million verified businesses
Area: 0.500 square miles
Population: 785
Population density:
| Sunnyside: | 1,568 people per square mile |
| College Park: | 6,333 people per square mile |

- 32640.4%Hispanic or Latino
- 18923.4%Black
- 13316.5%Asian
- 12215.1%White
- 131.6%Two or more races
- 91.1%Some other race
- 81.0%Native Hawaiian and Other
Pacific Islander - 70.9%American Indian

Median household income in 2022:
| Sunnyside: | $118,232 |
| College Park: | $76,973 |
Distribution of median household income
![Distribution of median household income]()
- 9Less than $10,000
- 37$10,000 to $19,999
- 18$20,000 to $29,999
- 22$30,000 to $39,999
- 12$40,000 to $49,999
- 27$50,000 to $59,999
- 13$60,000 to $74,999
- 47$75,000 to $99,999
- 38$100,000 to $124,999
- 22$125,000 to $149,999
- 46$150,000 to $199,999
- 5$200,000 or more

Distribution of owner-occupied house/condo value
![Distribution of owner-occupied house/condo value]()
- 6Less than $50,000
- 7$50,000 to $99,999
- 25$100,000 to $149,999
- 5$150,000 to $199,999
- 117$200,000 to $249,999
- 14$250,000 to $299,999
- 45$300,000 to $399,999
- 17$400,000 to $499,999
- 35$500,000 to $749,999
- 6$750,000 to $999,999
- 18$1,000,000 or more

Distribution of rent paid by renters
![Distribution of rent paid by renters]()
- 8$600 to $699
- 11$700 to $799
- 95$900 to $999
- 12$1,000 to $1,249
- 37$1,250 to $1,499
- 49$1,500 to $1,999
- 103$2,000 or more

Median rent in 2022:
| Sunnyside: | $2,013 |
| College Park: | $1,666 |
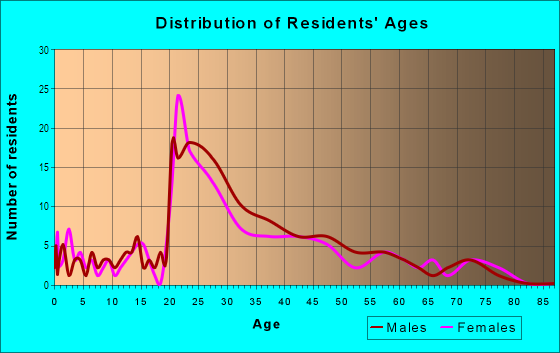
| Males: | 367 |
| Females: | 417 |
Males:
| This neighborhood: | 33.5 years |
| Whole city: | 22.0 years |
| This neighborhood: | 33.6 years |
| Whole city: | 21.2 years |
Average household size:
| Sunnyside: | 3.3 people |
| College Park: | 2.7 people |
Percentage of family households:
| Sunnyside: | 44.5% |
| College Park: | 30.6% |
| Here: | 33.4% |
| College Park: | 28.7% |
Percentage of married-couple families with children (among all households):
| Sunnyside: | 24.0% |
| College Park: | 20.4% |
Percentage of single-mother households (among all households):
| Sunnyside: | 2.3% |
| College Park: | 4.3% |
Percentage of never married males 15 years old and over:
Percentage of never married females 15 years old and over:
| Sunnyside: | 20.6% |
| College Park: | 38.3% |
Percentage of never married females 15 years old and over:
| Sunnyside: | 23.0% |
| city: | 36.3% |
Percentage of people that speak English not well or not at all:
| Sunnyside: | 13.8% |
| College Park: | 6.6% |
Percentage of people born in this state:
Percentage of people born in another U.S. state:
Percentage of native residents but born outside the U.S.:
Percentage of foreign born residents:
| Here: | 29.0% |
| College Park: | 34.2% |
Percentage of people born in another U.S. state:
| Sunnyside: | 19.6% |
| College Park: | 40.7% |
Percentage of native residents but born outside the U.S.:
| Here: | 1.4% |
| city: | 1.9% |
Percentage of foreign born residents:
| Here: | 49.9% |
| College Park: | 23.1% |

Owner-occupied
Renter-occupied


- Rooms in owner-occupied houses and condos in Sunnyside
- 01 room
- 12 rooms
- 153 rooms
- 84 rooms
- 85 rooms
- 276 rooms
- 247 rooms
- 28 rooms
- 139+ rooms

- Rooms in renter-occupied apartments in Sunnyside
- 131 room
- 112 rooms
- 483 rooms
- 194 rooms
- 75 rooms
- 206 rooms
- 147 rooms
- 128 rooms
- 89+ rooms
Owner-occupied
Renter-occupied

- Bedrooms in owner-occupied houses and condos in Sunnyside
- 0no bedroom
- 101 bedroom
- 82 bedrooms
- 503 bedrooms
- 124 bedrooms
- 135+ bedrooms

- Bedrooms in renter-occupied apartments in Sunnyside
- 13no bedroom
- 351 bedroom
- 712 bedrooms
- 203 bedrooms
- 134 bedrooms
- 35+ bedrooms
Average number of cars or other vehicles available in houses/condos:
Average number of cars or other vehicles available in apartments:
| This neighborhood: | 2.6 |
| College Park: | 2.1 |
Average number of cars or other vehicles available in apartments:
| Here: | 1.9 |
| city: | 1.4 |
Percentage of units with a mortgage:
| Sunnyside: | 63.3% |
| College Park: | 66.4% |
Average estimated value of detached houses in 2022 (45.2% of all units):
| Sunnyside: | $426,140 |
| Maryland: | $526,819 |

- Year house built in Sunnyside
- 02020 or later
- 162010 to 2019
- 152000 to 2009
- 431990 to 1999
- 781980 to 1989
- 201970 to 1979
- 291960 to 1969
- 351950 to 1959
- 251940 to 1949
- 71939 or earlier

Travel time to work (commute)
![Travel time to work (commute)]()
- 7Less than 5 minutes
- 105 to 9 minutes
- 3410 to 14 minutes
- 5915 to 19 minutes
- 4720 to 24 minutes
- 1225 to 29 minutes
- 3730 to 34 minutes
- 1035 to 39 minutes
- 2540 to 44 minutes
- 6445 to 59 minutes
- 2360 to 89 minutes
- 690 or more minutes

Means of transportation to work
![Means of transportation to work]()
- 68.0%292Drove a car alone
- 8.6%37Carpooled
- 7.9%34Bus
- 4.4%19Subway or elevated rail
- 0.9%4Long-distance train or commuter rail
- 0.2%1Light rail, streetcar or trolley
- 3.3%14Bicycle
- 0.7%3Walked
- 1.2%5Other means
- 15.4%66Worked at home

Time leaving home to go to work
![Time leaving home to go to work]()
- 912:00 a.m. to 4:59 a.m.
- 485:00 a.m. to 5:29 a.m.
- 245:30 a.m. to 5:59 a.m.
- 206:00 a.m. to 6:29 a.m.
- 226:30 a.m. to 6:59 a.m.
- 277:00 a.m. to 7:29 a.m.
- 167:30 a.m. to 7:59 a.m.
- 268:00 a.m. to 8:29 a.m.
- 368:30 a.m. to 8:59 a.m.
- 229:00 a.m. to 9:59 a.m.
- 1910:00 a.m. to 10:59 a.m.
- 4711:00 a.m. to 11:59 a.m.
- 3012:00 p.m. to 3:59 p.m.
- 164:00 p.m. to 11:59 p.m.

Occupations of males:
- Percentage of males in management occupations (except farmers):
Here: 6.3% city: 6.2%
- Percentage of males in computer and mathematical occupations:
Here: 9.3% city: 10.0%
- Percentage of males in architecture and engineering occupations:
Here: 2.0% city: 3.9%
- Percentage of males in education, training, and library occupations:
Here: 9.6% city: 12.5%
- Percentage of males in arts, design, entertainment, sports, and media occupations:
Here: 3.3% city: 2.3%
- Percentage of males in service occupations:
Here: 12.6% city: 13.5%
- Percentage of males in sales and office occupations:
Here: 20.2% city: 11.3%
- Percentage of males in construction, extraction, and maintenance occupations:
Here: 18.1% city: 18.7%
- Percentage of males in production occupations:
Here: 2.3% city: 1.8%
- Percentage of males in transportation occupations:
Here: 11.9% city: 1.9%
- Percentage of males in material moving occupations:
Here: 3.4% city: 3.8%
Occupations of females:
- Percentage of females in management occupations (except farmers):
Here: 3.1% city: 7.6%
- Percentage of females in business and financial operations occupations:
Here: 6.8% city: 2.8%
- Percentage of females in computer and mathematical occupations:
Here: 4.0% city: 3.2%
- Percentage of females in architecture and engineering occupations:
Here: 1.3% city: 0.8%
- Percentage of females in legal occupations:
Here: 3.1% city: 1.1%
- Percentage of females in education, training, and library occupations:
Here: 17.3% city: 22.3%
- Percentage of females in arts, design, entertainment, sports, and media occupations:
Here: 3.9% city: 3.4%
- Percentage of females in service occupations:
Here: 30.3% city: 17.1%
- Percentage of females in sales and office occupations:
Here: 21.6% city: 25.5%
- Percentage of females in transportation occupations:
Here: 7.9% city: 0.9%
Percentage of people 16-64 in Armed Forces:
| Sunnyside: | 0.0% |
| College Park: | 0.4% |
Education in this neighborhood (subdivision or community):
- Percentage of people 3 years and older in K-12 schools:
Sunnyside: 15.0% College Park: 5.2%
- Percentage of people 3 years and older in undergraduate colleges:
Sunnyside: 9.6% College Park: 48.1%
- Percentage of people 3 years and older in grad. or professional schools:
Sunnyside: 3.2% College Park: 4.6%
- Percentage of students K-12 enrolled in private schools:
Sunnyside: 56.9% College Park: 30.4%
Percentage of population below poverty level:
| Sunnyside: | 9.1% |
| College Park: | 27.8% |
Median year owner moved in (as recorded in 2022):
Median year renter moved in (as recorded in 2022):
| Sunnyside: | 2006 |
| College Park: | 2005 |
Median year renter moved in (as recorded in 2022):
| Sunnyside: | 2019 |
| College Park: | 2019 |
Percentage of married-couple families with both working:
| Sunnyside: | 88.3% |
| College Park: | 74.3% |

- 41.6%Utility gas
- 28.5%Electricity
- 11.0%Fuel oil, kerosene, etc.
- 8.7%Solar energy
- 4.2%Other fuel
- 3.0%No fuel used
- 1.5%Wood
- 1.4%Bottled, tank, or LP gas
Limited-access highways (interstate or state) in this neighborhood:
I- 495 (I- 95, Capital Beltway)
Length: 1.31 miles
Directions: E-W, SE-NW
Directions: E-W, SE-NW
Highways in this neighborhood:
Baltimore Ave (US Hwy 1)
Length: 1.49 miles
Directions: N-S, SW-NE
Address range: 10000 to 10398
Directions: N-S, SW-NE
Address range: 10000 to 10398
Roads and streets:
Sunnyside Ave
Length: 1.01 miles
Direction: E-W
Address range: 5000 to 5799
Direction: E-W
Address range: 5000 to 5799
Rhode Island Ave
Length: 0.50 miles
Directions: N-S, SW-NE
Address range: 10065 to 10399
Directions: N-S, SW-NE
Address range: 10065 to 10399
Odessa Rd
Length: 0.50 miles
Directions: E-W, SE-NW
Address range: 5000 to 5299
Directions: E-W, SE-NW
Address range: 5000 to 5299
Paducah Rd
Length: 0.48 miles
Directions: E-W, N-S, SE-NW
Address range: 5000 to 5299
Directions: E-W, N-S, SE-NW
Address range: 5000 to 5299
Locust Hill Dr
Length: 0.44 miles
Directions: E-W, N-S, SE-NW, SW-NE
Directions: E-W, N-S, SE-NW, SW-NE
52nd Ave
Length: 0.25 miles
Directions: E-W, N-S, SE-NW, SW-NE
Address range: 10100 to 10199
Directions: E-W, N-S, SE-NW, SW-NE
Address range: 10100 to 10199
Stewart Ct
Length: 0.14 miles
Directions: E-W, N-S, SW-NE
Address range: 5000 to 5099
Directions: E-W, N-S, SW-NE
Address range: 5000 to 5099
51st Ave
Length: 0.14 miles
Directions: N-S, SW-NE
Address range: 10024 to 10199
Directions: N-S, SW-NE
Address range: 10024 to 10199
Palco Pl
Length: 0.10 miles
Directions: E-W, N-S, SW-NE
Address range: 5200 to 5299
Directions: E-W, N-S, SW-NE
Address range: 5200 to 5299
Ikea Way
Length: 0.03 miles
Direction: E-W
Direction: E-W
Railroad features:
Csx RR
Length: 0.37 miles
Direction: N-S
Direction: N-S