Sunray Historic District neighborhood in Chesapeake, Virginia (VA), 23321 detailed profile
Settings
X


Business Search - 14 Million verified businesses
Area: 3.281 square miles
Population: 438
Population density:
| Sunray Historic District: | 134 people per square mile |
| Chesapeake: | 741 people per square mile |

- 22248.7%White
- 19342.3%Black
- 143.1%Two or more races
- 112.4%Some other race
- 92.0%Asian
- 71.5%Hispanic or Latino

Median household income in 2022:
| Sunray Historic District: | $66,444 |
| Chesapeake: | $87,749 |
Distribution of median household income
![Distribution of median household income]()
- 8Less than $10,000
- 7$10,000 to $19,999
- 5$20,000 to $29,999
- 21$30,000 to $39,999
- 30$40,000 to $49,999
- 6$50,000 to $59,999
- 25$60,000 to $74,999
- 17$75,000 to $99,999
- 19$100,000 to $124,999
- 11$125,000 to $149,999
- 3$150,000 to $199,999
- 24$200,000 or more

Distribution of owner-occupied house/condo value
![Distribution of owner-occupied house/condo value]()
- 11Less than $50,000
- 4$50,000 to $99,999
- 1$100,000 to $149,999
- 5$150,000 to $199,999
- 20$200,000 to $249,999
- 39$250,000 to $299,999
- 7$300,000 to $399,999
- 48$400,000 to $499,999
- 13$500,000 to $749,999

Distribution of rent paid by renters
![Distribution of rent paid by renters]()
- 7$900 to $999
- 7$1,000 to $1,249
- 15$1,250 to $1,499
- 5$1,500 to $1,999
- 6$2,000 or more

Median rent in 2022:
| Sunray Historic District: | $1,260 |
| Chesapeake: | $1,219 |
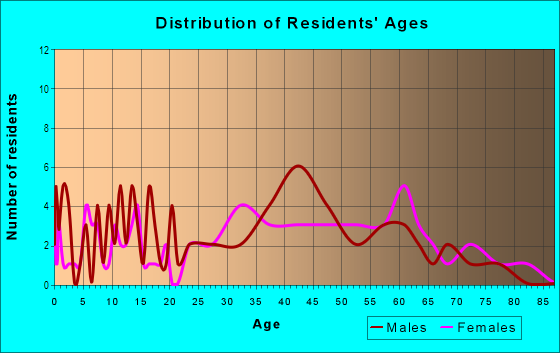
| Males: | 201 |
| Females: | 237 |
Males:
| This neighborhood: | 39.5 years |
| Whole city: | 36.0 years |
| This neighborhood: | 36.6 years |
| Whole city: | 38.9 years |
Average household size:
| Sunray Historic District: | 2.7 people |
| Chesapeake: | 2.6 people |
Percentage of family households:
| Sunray Historic District: | 59.0% |
| Chesapeake: | 52.3% |
| Here: | 74.8% |
| Chesapeake: | 52.7% |
Percentage of married-couple families with children (among all households):
| Sunray Historic District: | 37.0% |
| Chesapeake: | 26.3% |
Percentage of single-mother households (among all households):
| Sunray Historic District: | 4.3% |
| Chesapeake: | 9.7% |
Percentage of never married males 15 years old and over:
Percentage of never married females 15 years old and over:
| Sunray Historic District: | 9.7% |
| Chesapeake: | 16.3% |
Percentage of never married females 15 years old and over:
| Sunray Historic District: | 5.0% |
| city: | 14.2% |
Percentage of people that speak English not well or not at all:
| Sunray Historic District: | 0.0% |
| Chesapeake: | 1.5% |
Percentage of people born in this state:
Percentage of people born in another U.S. state:
Percentage of native residents but born outside the U.S.:
Percentage of foreign born residents:
| Here: | 42.4% |
| Chesapeake: | 50.4% |
Percentage of people born in another U.S. state:
| Sunray Historic District: | 43.9% |
| Chesapeake: | 41.9% |
Percentage of native residents but born outside the U.S.:
| Here: | 8.2% |
| city: | 2.7% |
Percentage of foreign born residents:
| Here: | 5.4% |
| Chesapeake: | 5.0% |

Owner-occupied
Renter-occupied


- Rooms in owner-occupied houses and condos in Sunray Historic District
- 01 room
- 02 rooms
- 73 rooms
- 64 rooms
- 265 rooms
- 36 rooms
- 137 rooms
- 548 rooms
- 219+ rooms

- Rooms in renter-occupied apartments in Sunray Historic District
- 01 room
- 02 rooms
- 43 rooms
- 24 rooms
- 45 rooms
- 166 rooms
- 07 rooms
- 28 rooms
- 49+ rooms
Owner-occupied
Renter-occupied

- Bedrooms in owner-occupied houses and condos in Sunray Historic District
- 0no bedroom
- 01 bedroom
- 282 bedrooms
- 433 bedrooms
- 524 bedrooms
- 95+ bedrooms

- Bedrooms in renter-occupied apartments in Sunray Historic District
- 0no bedroom
- 31 bedroom
- 42 bedrooms
- 163 bedrooms
- 24 bedrooms
- 45+ bedrooms
Average number of cars or other vehicles available in houses/condos:
Average number of cars or other vehicles available in apartments:
| This neighborhood: | 2.5 |
| Chesapeake: | 2.2 |
Average number of cars or other vehicles available in apartments:
| Here: | 1.2 |
| city: | 1.4 |
Percentage of units with a mortgage:
| Sunray Historic District: | 91.3% |
| Chesapeake: | 75.1% |

- Year house built in Sunray Historic District
- 12020 or later
- 612010 to 2019
- 212000 to 2009
- 131990 to 1999
- 311980 to 1989
- 91970 to 1979
- 201960 to 1969
- 111950 to 1959
- 121940 to 1949
- 01939 or earlier

City-data.com crime index for city in 2020 (higher means more crime):
| City: | 198.9 |
| U.S. average: | 219.5 |
Travel time to work (commute)
![Travel time to work (commute)]()
- 3Less than 5 minutes
- 65 to 9 minutes
- 1310 to 14 minutes
- 2315 to 19 minutes
- 4120 to 24 minutes
- 1925 to 29 minutes
- 4230 to 34 minutes
- 1635 to 39 minutes
- 340 to 44 minutes
- 3445 to 59 minutes
- 760 to 89 minutes

Means of transportation to work
![Means of transportation to work]()
- 80.2%185Drove a car alone
- 13.4%31Carpooled
- 0.4%1Motorcycle
- 1.7%4Walked
- 6.1%14Worked at home

Time leaving home to go to work
![Time leaving home to go to work]()
- 212:00 a.m. to 4:59 a.m.
- 145:00 a.m. to 5:29 a.m.
- 195:30 a.m. to 5:59 a.m.
- 146:00 a.m. to 6:29 a.m.
- 316:30 a.m. to 6:59 a.m.
- 357:00 a.m. to 7:29 a.m.
- 187:30 a.m. to 7:59 a.m.
- 258:00 a.m. to 8:29 a.m.
- 28:30 a.m. to 8:59 a.m.
- 99:00 a.m. to 9:59 a.m.
- 510:00 a.m. to 10:59 a.m.
- 411:00 a.m. to 11:59 a.m.
- 312:00 p.m. to 3:59 p.m.
- 194:00 p.m. to 11:59 p.m.

Occupations of males:
- Percentage of males in management occupations (except farmers):
Here: 9.5% city: 11.7%
- Percentage of males in business and financial operations occupations:
Here: 6.6% city: 5.6%
- Percentage of males in computer and mathematical occupations:
Here: 14.5% city: 7.3%
- Percentage of males in architecture and engineering occupations:
Here: 2.8% city: 5.4%
- Percentage of males in community and social services occupations:
Here: 1.7% city: 1.2%
- Percentage of males in education, training, and library occupations:
Here: 1.3% city: 2.9%
- Percentage of males in arts, design, entertainment, sports, and media occupations:
Here: 1.3% city: 1.0%
- Percentage of males in service occupations:
Here: 46.0% city: 13.8%
- Percentage of males in sales and office occupations:
Here: 3.6% city: 12.8%
- Percentage of males in construction, extraction, and maintenance occupations:
Here: 5.8% city: 8.7%
- Percentage of males in production occupations:
Here: 5.6% city: 6.3%
- Percentage of males in transportation occupations:
Here: 11.8% city: 6.1%
- Percentage of males in material moving occupations:
Here: 16.3% city: 4.9%
Occupations of females:
- Percentage of females in management occupations (except farmers):
Here: 13.4% city: 8.9%
- Percentage of females in business and financial operations occupations:
Here: 17.8% city: 7.9%
- Percentage of females in computer and mathematical occupations:
Here: 13.9% city: 2.9%
- Percentage of females in architecture and engineering occupations:
Here: 3.0% city: 1.3%
- Percentage of females in community and social services occupations:
Here: 2.5% city: 3.2%
- Percentage of females in education, training, and library occupations:
Here: 10.4% city: 10.2%
- Percentage of females in arts, design, entertainment, sports, and media occupations:
Here: 2.0% city: 2.0%
- Percentage of females in healthcare practitioners and technical occupations:
Here: 17.8% city: 10.9%
- Percentage of females in service occupations:
Here: 3.3% city: 18.3%
- Percentage of females in sales and office occupations:
Here: 13.1% city: 26.7%
- Percentage of females in production occupations:
Here: 6.8% city: 2.0%
- Percentage of females in material moving occupations:
Here: 3.6% city: 1.6%
Percentage of people 16-64 in Armed Forces:
| Sunray Historic District: | 8.1% |
| Chesapeake: | 5.7% |
Education in this neighborhood (subdivision or community):
- Percentage of people 3 years and older in K-12 schools:
Sunray Historic District: 30.1% Chesapeake: 18.0%
- Percentage of people 3 years and older in undergraduate colleges:
Sunray Historic District: 10.0% Chesapeake: 4.3%
- Percentage of people 3 years and older in grad. or professional schools:
Sunray Historic District: 8.2% Chesapeake: 2.1%
- Percentage of students K-12 enrolled in private schools:
Sunray Historic District: 11.4% Chesapeake: 11.2%
Percentage of population below poverty level:
| Sunray Historic District: | 3.0% |
| Chesapeake: | 8.4% |
Median year owner moved in (as recorded in 2022):
Median year renter moved in (as recorded in 2022):
| Sunray Historic District: | 2013 |
| Chesapeake: | 2012 |
Median year renter moved in (as recorded in 2022):
| Sunray Historic District: | 2022 |
| Chesapeake: | 2019 |
Percentage of married-couple families with both working:
| Sunray Historic District: | 82.9% |
| Chesapeake: | 77.4% |

- 65.7%Utility gas
- 21.2%Electricity
- 8.1%No fuel used
- 3.0%Bottled, tank, or LP gas
- 1.9%Fuel oil, kerosene, etc.
Roads and streets:
Peach Rd
Length: 1.87 miles
Direction: E-W
Address range: 4300 to 4799
Direction: E-W
Address range: 4300 to 4799
Apple Rd
Length: 1.86 miles
Direction: E-W
Address range: 4300 to 4899
Direction: E-W
Address range: 4300 to 4899
Sunray Ave
Length: 1.86 miles
Direction: E-W
Address range: 4300 to 4899
Direction: E-W
Address range: 4300 to 4899
Homestead Rd
Length: 1.83 miles
Directions: N-S, SW-NE
Address range: 300 to 647
Directions: N-S, SW-NE
Address range: 300 to 647
Truitt Rd
Length: 1.51 miles
Direction: N-S
Address range: 300 to 50199
Direction: N-S
Address range: 300 to 50199
Sondej Ave
Length: 1.44 miles
Direction: E-W
Address range: 4500 to 4899
Direction: E-W
Address range: 4500 to 4899
Biernot Ave
Length: 1.30 miles
Direction: N-S
Address range: 200 to 499
Direction: N-S
Address range: 200 to 499
East Rd
Length: 0.96 miles
Direction: E-W
Address range: 4200 to 4428
Direction: E-W
Address range: 4200 to 4428
Hertz Rd
Length: 0.51 miles
Direction: N-S
Address range: 300 to 399
Direction: N-S
Address range: 300 to 399
Old State Rd
Length: 0.42 miles
Direction: E-W
Address range: 4500 to 4699
Direction: E-W
Address range: 4500 to 4699
Seldon Rd
Length: 0.40 miles
Direction: SE-NW
Address range: 500 to 699
Direction: SE-NW
Address range: 500 to 699
Carlisle Rd
Length: 0.26 miles
Direction: SE-NW
Address range: 400 to 499
Direction: SE-NW
Address range: 400 to 499
Compaz Rd
Length: 0.25 miles
Direction: N-S
Address range: 300 to 399
Direction: N-S
Address range: 300 to 399
Danbury St
Length: 0.16 miles
Direction: E-W
Address range: 800 to 899
Direction: E-W
Address range: 800 to 899
Indiana Ave
Length: 0.11 miles
Direction: E-W
Address range: 4600 to 4621
Direction: E-W
Address range: 4600 to 4621
Railroad features:
Norfolk Southern Rlwy
Length: 1.70 miles
Direction: E-W
Direction: E-W