The South Lakefront neighborhood in Waukegan, Illinois (IL), 60085 detailed profile
Settings
X


Business Search - 14 Million verified businesses
Area: 0.290 square miles
Population: 1,377
Population density:
| The South Lakefront: | 4,744 people per square mile |
| Waukegan: | 3,758 people per square mile |

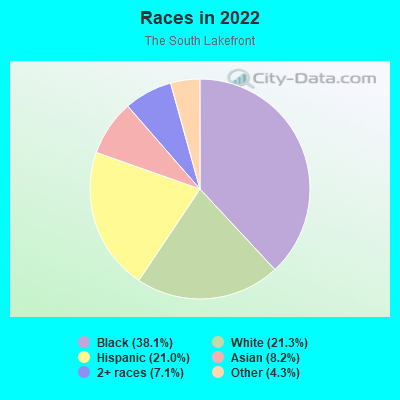
- 70138.1%Black
- 39121.3%White
- 38621.0%Hispanic or Latino
- 1518.2%Asian
- 1317.1%Two or more races
- 794.3%Some other race
Median household income in 2022:
| The South Lakefront: | $28,343 |
| Waukegan: | $64,299 |
Distribution of median household income
![Distribution of median household income]()
- 95Less than $10,000
- 96$10,000 to $19,999
- 68$20,000 to $29,999
- 249$30,000 to $39,999
- 106$40,000 to $49,999
- 35$50,000 to $59,999
- 32$60,000 to $74,999
- 17$75,000 to $99,999
- 11$100,000 to $124,999
- 40$125,000 to $149,999
- 139$150,000 to $199,999
- 45$200,000 or more

Distribution of owner-occupied house/condo value
![Distribution of owner-occupied house/condo value]()
- 18Less than $50,000
- 106$50,000 to $99,999
- 60$100,000 to $149,999
- 80$150,000 to $199,999
- 41$200,000 to $249,999
- 46$250,000 to $299,999
- 33$300,000 to $399,999
- 47$500,000 to $749,999

Distribution of rent paid by renters
![Distribution of rent paid by renters]()
- 44Less than $100
- 109$200 to $299
- 96$300 to $399
- 112$400 to $499
- 96$500 to $599
- 11$600 to $699
- 296$700 to $799
- 109$800 to $899
- 114$900 to $999
- 120$1,000 to $1,249
- 48$1,250 to $1,499

Median rent in 2022:
| The South Lakefront: | $901 |
| Waukegan: | $968 |
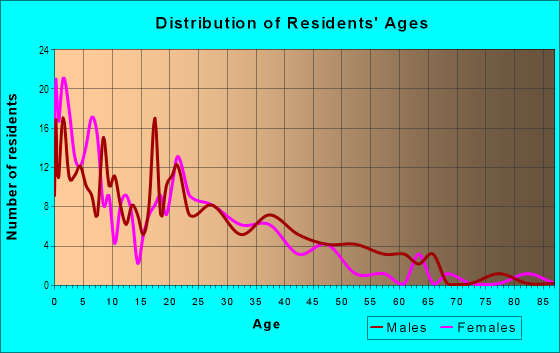
| Males: | 641 |
| Females: | 736 |
Males:
| This neighborhood: | 34.0 years |
| Whole city: | 33.0 years |
| This neighborhood: | 32.2 years |
| Whole city: | 33.9 years |
Average household size:
| The South Lakefront: | 2.6 people |
| Waukegan: | 2.6 people |
Percentage of family households:
| The South Lakefront: | 58.4% |
| Waukegan: | 46.5% |
| Here: | 18.3% |
| Waukegan: | 40.0% |
Percentage of married-couple families with children (among all households):
| The South Lakefront: | 5.9% |
| Waukegan: | 22.3% |
Percentage of single-mother households (among all households):
| The South Lakefront: | 30.2% |
| Waukegan: | 13.4% |
Percentage of never married males 15 years old and over:
Percentage of never married females 15 years old and over:
| The South Lakefront: | 20.3% |
| Waukegan: | 25.1% |
Percentage of never married females 15 years old and over:
| The South Lakefront: | 37.0% |
| city: | 19.3% |
Percentage of people that speak English not well or not at all:
| The South Lakefront: | 5.0% |
| Waukegan: | 10.3% |
Percentage of people born in this state:
Percentage of people born in another U.S. state:
Percentage of native residents but born outside the U.S.:
Percentage of foreign born residents:
| Here: | 71.2% |
| Waukegan: | 51.4% |
Percentage of people born in another U.S. state:
| The South Lakefront: | 10.5% |
| Waukegan: | 14.3% |
Percentage of native residents but born outside the U.S.:
| Here: | 0.9% |
| city: | 3.0% |
Percentage of foreign born residents:
| Here: | 17.5% |
| Waukegan: | 31.3% |
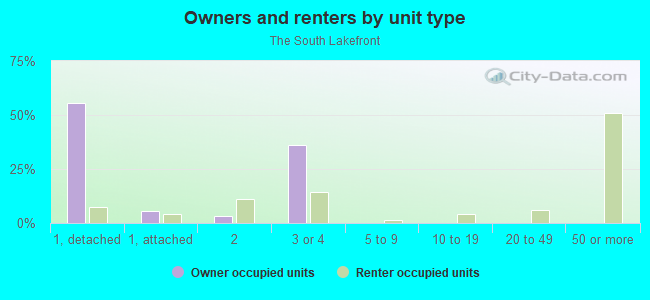
Owner-occupied
Renter-occupied

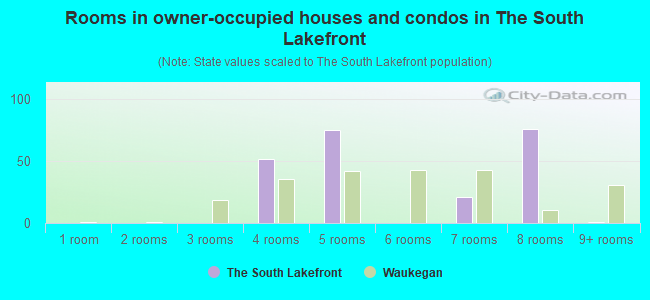
- Rooms in owner-occupied houses and condos in The South Lakefront
- 01 room
- 02 rooms
- 03 rooms
- 524 rooms
- 755 rooms
- 06 rooms
- 217 rooms
- 768 rooms
- 19+ rooms
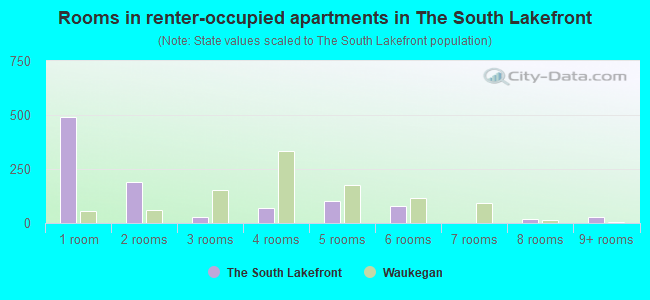
- Rooms in renter-occupied apartments in The South Lakefront
- 4931 room
- 1902 rooms
- 263 rooms
- 704 rooms
- 1035 rooms
- 776 rooms
- 07 rooms
- 198 rooms
- 269+ rooms
Owner-occupied
Renter-occupied
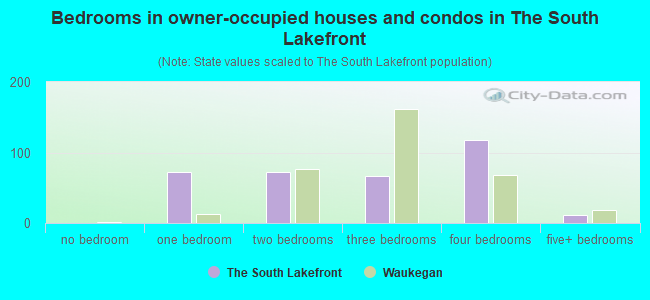
- Bedrooms in owner-occupied houses and condos in The South Lakefront
- 0no bedroom
- 721 bedroom
- 722 bedrooms
- 663 bedrooms
- 1184 bedrooms
- 115+ bedrooms
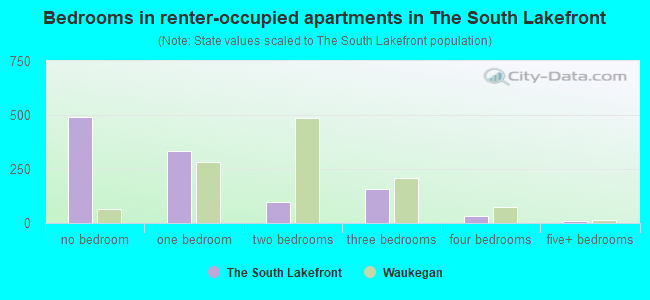
- Bedrooms in renter-occupied apartments in The South Lakefront
- 493no bedroom
- 3331 bedroom
- 982 bedrooms
- 1583 bedrooms
- 344 bedrooms
- 75+ bedrooms
Average number of cars or other vehicles available in houses/condos:
Average number of cars or other vehicles available in apartments:
| This neighborhood: | 1.9 |
| Waukegan: | 2.2 |
Average number of cars or other vehicles available in apartments:
| Here: | 0.9 |
| city: | 1.3 |
Percentage of units with a mortgage:
| The South Lakefront: | 22.4% |
| Waukegan: | 56.7% |
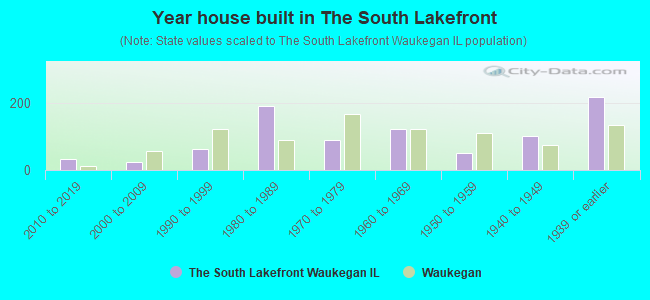
- Year house built in The South Lakefront
- 02020 or later
- 322010 to 2019
- 232000 to 2009
- 621990 to 1999
- 1901980 to 1989
- 911970 to 1979
- 1221960 to 1969
- 521950 to 1959
- 1011940 to 1949
- 2171939 or earlier
City-data.com crime index for city in 2020 (higher means more crime):
| City: | 186.3 |
| U.S. average: | 219.5 |
Travel time to work (commute)
![Travel time to work (commute)]()
- 32Less than 5 minutes
- 805 to 9 minutes
- 6710 to 14 minutes
- 12815 to 19 minutes
- 6920 to 24 minutes
- 5125 to 29 minutes
- 12230 to 34 minutes
- 4945 to 59 minutes
- 5860 to 89 minutes
- 3490 or more minutes

Means of transportation to work
![Means of transportation to work]()
- 74.9%404Drove a car alone
- 11.1%60Carpooled
- 7.0%38Bus
- 13.5%73Long-distance train or commuter rail
- 14.8%80Walked
- 40.2%217Other means

Time leaving home to go to work
![Time leaving home to go to work]()
- 2712:00 a.m. to 4:59 a.m.
- 505:00 a.m. to 5:29 a.m.
- 1075:30 a.m. to 5:59 a.m.
- 466:00 a.m. to 6:29 a.m.
- 106:30 a.m. to 6:59 a.m.
- 397:00 a.m. to 7:29 a.m.
- 887:30 a.m. to 7:59 a.m.
- 948:00 a.m. to 8:29 a.m.
- 918:30 a.m. to 8:59 a.m.
- 519:00 a.m. to 9:59 a.m.
- 510:00 a.m. to 10:59 a.m.
- 3712:00 p.m. to 3:59 p.m.
- 394:00 p.m. to 11:59 p.m.

Occupations of males:
- Percentage of males in management occupations (except farmers):
Here: 8.1% city: 5.9%
- Percentage of males in legal occupations:
Here: 3.4% city: 0.3%
- Percentage of males in healthcare practitioners and technical occupations:
Here: 9.6% city: 2.2%
- Percentage of males in service occupations:
Here: 21.0% city: 19.1%
- Percentage of males in sales and office occupations:
Here: 14.8% city: 13.1%
- Percentage of males in construction, extraction, and maintenance occupations:
Here: 10.5% city: 6.9%
- Percentage of males in production occupations:
Here: 20.4% city: 12.9%
- Percentage of males in transportation occupations:
Here: 4.1% city: 7.5%
- Percentage of males in material moving occupations:
Here: 3.0% city: 11.6%
Occupations of females:
- Percentage of females in education, training, and library occupations:
Here: 14.9% city: 6.7%
- Percentage of females in healthcare practitioners and technical occupations:
Here: 14.1% city: 8.0%
- Percentage of females in service occupations:
Here: 17.7% city: 21.7%
- Percentage of females in sales and office occupations:
Here: 42.3% city: 27.2%
- Percentage of females in production occupations:
Here: 9.3% city: 10.3%
- Percentage of females in material moving occupations:
Here: 1.8% city: 6.3%
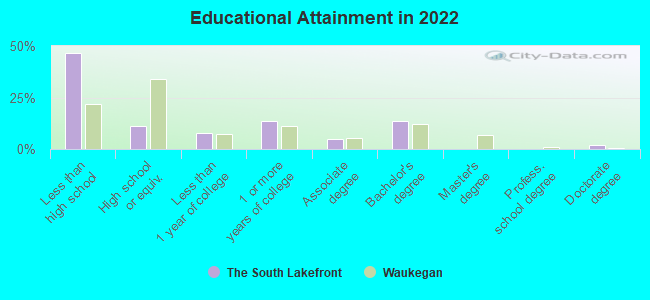
Education in this neighborhood (subdivision or community):
- Percentage of people 3 years and older in K-12 schools:
The South Lakefront: 38.1% Waukegan: 20.4%
- Percentage of people 3 years and older in undergraduate colleges:
The South Lakefront: 11.8% Waukegan: 5.1%
- Percentage of people 3 years and older in grad. or professional schools:
The South Lakefront: 0.0% Waukegan: 0.9%
- Percentage of students K-12 enrolled in private schools:
The South Lakefront: 41.6% Waukegan: 11.6%
Percentage of population below poverty level:
| The South Lakefront: | 39.1% |
| Waukegan: | 11.6% |
Median year renter moved in (as recorded in 2022):
| The South Lakefront: | 2016 |
| Waukegan: | 2019 |
Percentage of married-couple families with both working:
| The South Lakefront: | 211.7% |
| Waukegan: | 71.4% |
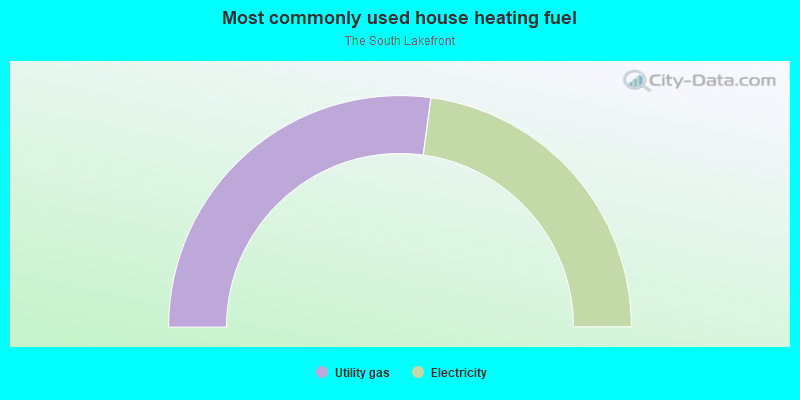
- 54.3%Utility gas
- 45.7%Electricity
Limited-access highways (interstate or state) in this neighborhood:
Melvin Amstutz Hwy (State Rte 137)
Length: 0.81 miles
Directions: E-W, N-S, SW-NE
Directions: E-W, N-S, SW-NE
Highways in this neighborhood:
S Genesee St (S Sheridan Rd, State Rte 137)
Length: 0.81 miles
Directions: N-S, SE-NW, SW-NE
Address range: 142 to 709
Directions: N-S, SE-NW, SW-NE
Address range: 142 to 709
S Sheridan Rd (State Rte 137)
Length: 0.39 miles
Directions: N-S, SW-NE
Address range: 144 to 555
Directions: N-S, SW-NE
Address range: 144 to 555
Roads and streets:
Market St
Length: 0.67 miles
Direction: N-S
Address range: 267 to 599
Direction: N-S
Address range: 267 to 599
Oak St
Length: 0.33 miles
Direction: N-S
Address range: 300 to 599
Direction: N-S
Address range: 300 to 599
South Ave
Length: 0.30 miles
Direction: E-W
Address range: 1 to 222
Direction: E-W
Address range: 1 to 222
E Belvidere Rd (Belvidere Rd, Belvidere St)
Length: 0.21 miles
Direction: E-W
Address range: 100 to 199
Direction: E-W
Address range: 100 to 199
Kennard St
Length: 0.18 miles
Directions: N-S, SW-NE
Address range: 600 to 799
Directions: N-S, SW-NE
Address range: 600 to 799
Liberty St
Length: 0.17 miles
Direction: E-W
Address range: 26 to 199
Direction: E-W
Address range: 26 to 199
McKinley Ave
Length: 0.17 miles
Direction: E-W
Address range: 1 to 199
Direction: E-W
Address range: 1 to 199
Browning Ave
Length: 0.14 miles
Direction: E-W
Address range: 100 to 199
Direction: E-W
Address range: 100 to 199
Lake St
Length: 0.13 miles
Direction: E-W
Address range: 100 to 199
Direction: E-W
Address range: 100 to 199
Lakeview Ave
Length: 0.13 miles
Direction: E-W
Address range: 101 to 199
Direction: E-W
Address range: 101 to 199
S Utica St (S Martin Luther King Jr Ave)
Length: 0.12 miles
Direction: N-S
Address range: 651 to 699
Direction: N-S
Address range: 651 to 699
Helmholz Ave
Length: 0.11 miles
Direction: E-W
Address range: 200 to 299
Direction: E-W
Address range: 200 to 299
May St
Length: 0.10 miles
Direction: E-W
Address range: 200 to 299
Direction: E-W
Address range: 200 to 299
Prospect Dr
Length: 0.09 miles
Directions: E-W, SE-NW
Address range: 100 to 149
Directions: E-W, SE-NW
Address range: 100 to 149
Hill St
Length: 0.06 miles
Direction: N-S
Address range: 600 to 699
Direction: N-S
Address range: 600 to 699
Marion Ct
Length: 0.06 miles
Direction: E-W
Direction: E-W
Clinton St
Length: 0.05 miles
Direction: N-S
Address range: 500 to 799
Direction: N-S
Address range: 500 to 799
Prospect Ct
Length: 0.04 miles
Directions: N-S, SE-NW
Address range: 123 to 129
Directions: N-S, SE-NW
Address range: 123 to 129
Railroad features:
Union Pacific RR
Length: 0.80 miles
Direction: N-S
Direction: N-S
Elgin Joliet and Eastern Rlwy
Length: 0.76 miles
Direction: N-S
Direction: N-S
Other features:
Waukegan Riv
Length: 0.39 miles
Directions: E-W, SE-NW
Directions: E-W, SE-NW