University Townhouses neighborhood in Ann Arbor, Michigan (MI), 48108 detailed profile
Settings
X


Business Search - 14 Million verified businesses
Area: 0.084 square miles
Population: 475
Population density:
| University Townhouses: | 5,630 people per square mile |
| Ann Arbor: | 4,438 people per square mile |

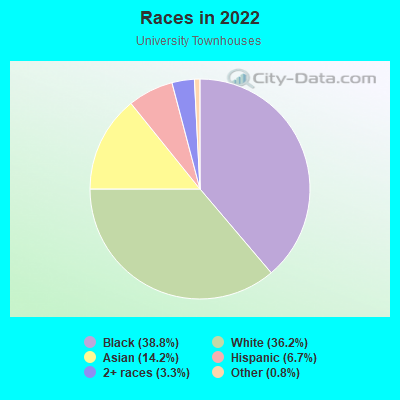
- 18638.8%Black
- 17436.2%White
- 6814.2%Asian
- 326.7%Hispanic or Latino
- 163.3%Two or more races
- 40.8%Some other race
Distribution of median household income
![Distribution of median household income]()
- 8Less than $10,000
- 19$10,000 to $19,999
- 70$20,000 to $29,999
- 28$30,000 to $39,999
- 37$40,000 to $49,999
- 44$50,000 to $59,999
- 46$60,000 to $74,999
- 34$75,000 to $99,999
- 11$100,000 to $124,999
- 9$125,000 to $149,999
- 3$150,000 to $199,999
- 2$200,000 or more

Distribution of owner-occupied house/condo value
![Distribution of owner-occupied house/condo value]()
- 6Less than $50,000
- 1$50,000 to $99,999
- 11$100,000 to $149,999
- 17$150,000 to $199,999
- 11$200,000 to $249,999
- 6$250,000 to $299,999
- 1$750,000 to $999,999

Distribution of rent paid by renters
![Distribution of rent paid by renters]()
- 5$200 to $299
- 50$500 to $599
- 200$600 to $699
- 38$700 to $799
- 120$800 to $899
- 45$900 to $999
- 156$1,000 to $1,249
- 15$1,250 to $1,499
- 3$1,500 to $1,999

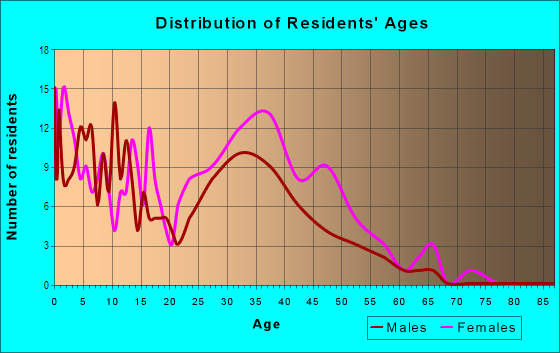
| Males: | 252 |
| Females: | 223 |
Males:
| This neighborhood: | |
| Whole city: |
| This neighborhood: | |
| Whole city: |
Percentage of family households:
| University Townhouses: | 33.4% |
| Ann Arbor: | 30.6% |
| Here: | 22.3% |
| Ann Arbor: | 33.8% |
Percentage of married-couple families with children (among all households):
| University Townhouses: | 37.9% |
| Ann Arbor: | 33.4% |
Percentage of single-mother households (among all households):
| University Townhouses: | 10.8% |
| Ann Arbor: | 5.6% |
Percentage of never married males 15 years old and over:
Percentage of never married females 15 years old and over:
| University Townhouses: | 34.9% |
| Ann Arbor: | 30.5% |
Percentage of never married females 15 years old and over:
| University Townhouses: | 28.7% |
| city: | 27.5% |
Percentage of people that speak English not well or not at all:
| University Townhouses: | 1.2% |
| Ann Arbor: | 1.5% |
Percentage of people born in this state:
Percentage of people born in another U.S. state:
Percentage of native residents but born outside the U.S.:
Percentage of foreign born residents:
| Here: | 45.9% |
| Ann Arbor: | 45.8% |
Percentage of people born in another U.S. state:
| University Townhouses: | 8.8% |
| Ann Arbor: | 34.9% |
Percentage of native residents but born outside the U.S.:
| Here: | 3.8% |
| city: | 1.6% |
Percentage of foreign born residents:
| Here: | 41.5% |
| Ann Arbor: | 17.7% |
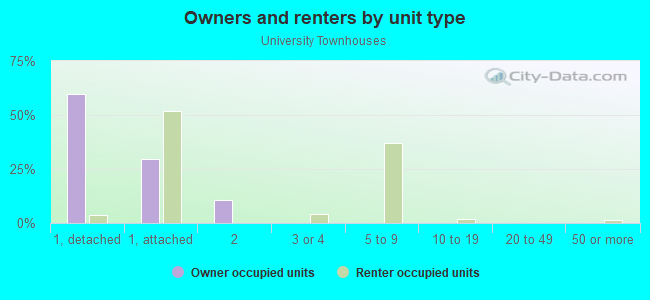
Owner-occupied
Renter-occupied

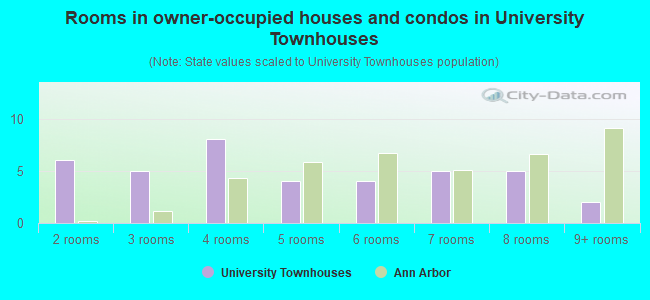
- Rooms in owner-occupied houses and condos in University Townhouses
- 01 room
- 62 rooms
- 53 rooms
- 84 rooms
- 45 rooms
- 46 rooms
- 57 rooms
- 58 rooms
- 29+ rooms
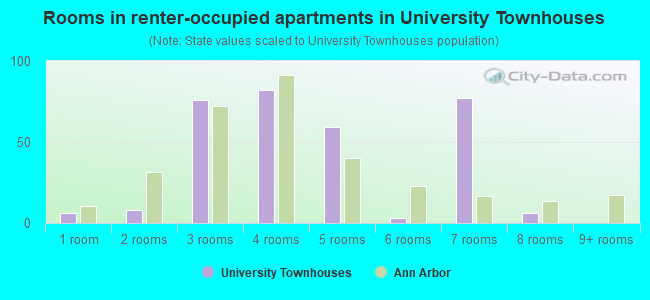
- Rooms in renter-occupied apartments in University Townhouses
- 61 room
- 82 rooms
- 763 rooms
- 824 rooms
- 595 rooms
- 36 rooms
- 777 rooms
- 68 rooms
- 09+ rooms
Owner-occupied
Renter-occupied
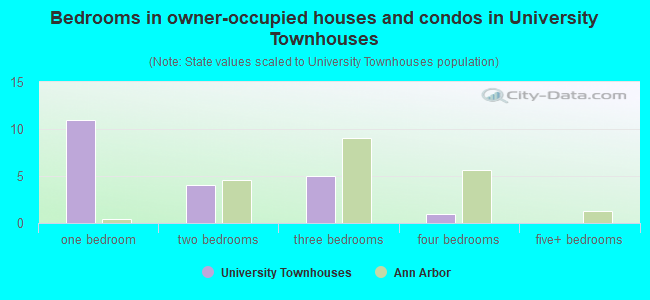
- Bedrooms in owner-occupied houses and condos in University Townhouses
- 0no bedroom
- 111 bedroom
- 42 bedrooms
- 53 bedrooms
- 14 bedrooms
- 05+ bedrooms
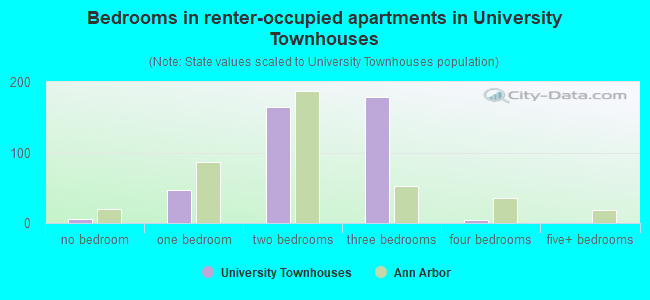
- Bedrooms in renter-occupied apartments in University Townhouses
- 6no bedroom
- 471 bedroom
- 1652 bedrooms
- 1793 bedrooms
- 44 bedrooms
- 05+ bedrooms
Average number of cars or other vehicles available in houses/condos:
Average number of cars or other vehicles available in apartments:
| This neighborhood: | |
| Ann Arbor: |
Average number of cars or other vehicles available in apartments:
| Here: | |
| city: |
Percentage of units with a mortgage:
| University Townhouses: | 24.4% |
| Ann Arbor: | 62.6% |
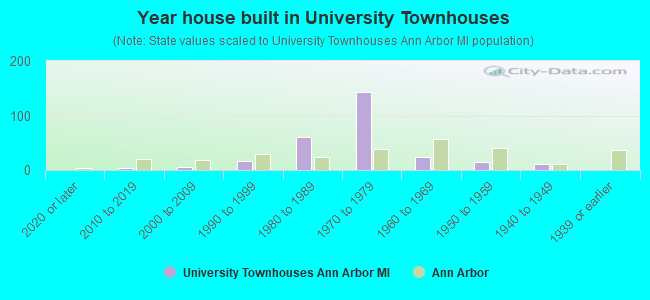
- Year house built in University Townhouses
- 02020 or later
- 42010 to 2019
- 62000 to 2009
- 161990 to 1999
- 601980 to 1989
- 1431970 to 1979
- 231960 to 1969
- 151950 to 1959
- 111940 to 1949
- 01939 or earlier
City-data.com crime index for city in 2020 (higher means more crime):
| City: | 137.0 |
| U.S. average: | 219.5 |
Travel time to work (commute)
![Travel time to work (commute)]()
- 185 to 9 minutes
- 4510 to 14 minutes
- 10115 to 19 minutes
- 4820 to 24 minutes
- 1325 to 29 minutes
- 4730 to 34 minutes
- 235 to 39 minutes
- 540 to 44 minutes
- 1945 to 59 minutes
- 460 to 89 minutes

Means of transportation to work
![Means of transportation to work]()
- 57.8%177Drove a car alone
- 13.1%40Carpooled
- 27.8%85Bus
- 12.4%38Worked at home

Time leaving home to go to work
![Time leaving home to go to work]()
- 612:00 a.m. to 4:59 a.m.
- 105:00 a.m. to 5:29 a.m.
- 135:30 a.m. to 5:59 a.m.
- 76:00 a.m. to 6:29 a.m.
- 136:30 a.m. to 6:59 a.m.
- 347:00 a.m. to 7:29 a.m.
- 227:30 a.m. to 7:59 a.m.
- 198:00 a.m. to 8:29 a.m.
- 118:30 a.m. to 8:59 a.m.
- 449:00 a.m. to 9:59 a.m.
- 410:00 a.m. to 10:59 a.m.
- 311:00 a.m. to 11:59 a.m.
- 8412:00 p.m. to 3:59 p.m.
- 194:00 p.m. to 11:59 p.m.

Occupations of males:
- Percentage of males in management occupations (except farmers):
Here: 8.8% city: 10.3%
- Percentage of males in computer and mathematical occupations:
Here: 7.2% city: 9.0%
- Percentage of males in architecture and engineering occupations:
Here: 4.7% city: 7.8%
- Percentage of males in life, physical, and social science occupations:
Here: 23.3% city: 5.8%
- Percentage of males in legal occupations:
Here: 2.9% city: 2.2%
- Percentage of males in education, training, and library occupations:
Here: 7.7% city: 19.2%
- Percentage of males in healthcare practitioners and technical occupations:
Here: 5.4% city: 6.9%
- Percentage of males in service occupations:
Here: 4.0% city: 8.2%
- Percentage of males in sales and office occupations:
Here: 6.1% city: 10.4%
- Percentage of males in production occupations:
Here: 16.0% city: 4.6%
- Percentage of males in transportation occupations:
Here: 1.1% city: 1.7%
- Percentage of males in material moving occupations:
Here: 9.3% city: 1.5%
Occupations of females:
- Percentage of females in management occupations (except farmers):
Here: 3.2% city: 8.5%
- Percentage of females in life, physical, and social science occupations:
Here: 26.2% city: 4.8%
- Percentage of females in community and social services occupations:
Here: 2.2% city: 3.5%
- Percentage of females in legal occupations:
Here: 6.4% city: 0.7%
- Percentage of females in education, training, and library occupations:
Here: 12.0% city: 20.2%
- Percentage of females in arts, design, entertainment, sports, and media occupations:
Here: 4.0% city: 4.6%
- Percentage of females in healthcare practitioners and technical occupations:
Here: 2.8% city: 11.9%
- Percentage of females in service occupations:
Here: 14.9% city: 15.5%
- Percentage of females in sales and office occupations:
Here: 19.0% city: 17.0%
- Percentage of females in production occupations:
Here: 6.8% city: 1.0%
- Percentage of females in transportation occupations:
Here: 1.6% city: 0.7%
- Percentage of females in material moving occupations:
Here: 2.0% city: 1.0%
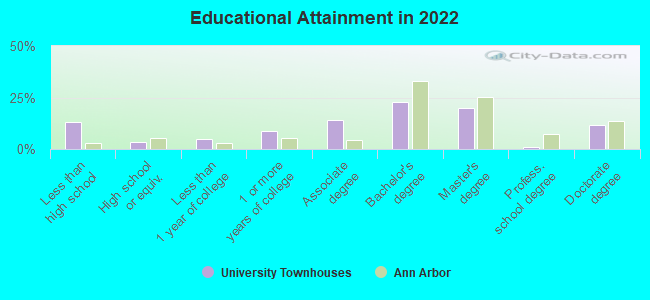
Education in this neighborhood (subdivision or community):
- Percentage of people 3 years and older in K-12 schools:
University Townhouses: 24.1% Ann Arbor: 8.7%
- Percentage of people 3 years and older in undergraduate colleges:
University Townhouses: 7.4% Ann Arbor: 25.6%
- Percentage of people 3 years and older in grad. or professional schools:
University Townhouses: 24.1% Ann Arbor: 10.8%
- Percentage of students K-12 enrolled in private schools:
University Townhouses: 12.7% Ann Arbor: 12.9%
Percentage of population below poverty level:
| University Townhouses: | 25.4% |
| Ann Arbor: | 23.1% |
Percentage of married-couple families with both working:
| University Townhouses: | 65.9% |
| Ann Arbor: | 72.2% |
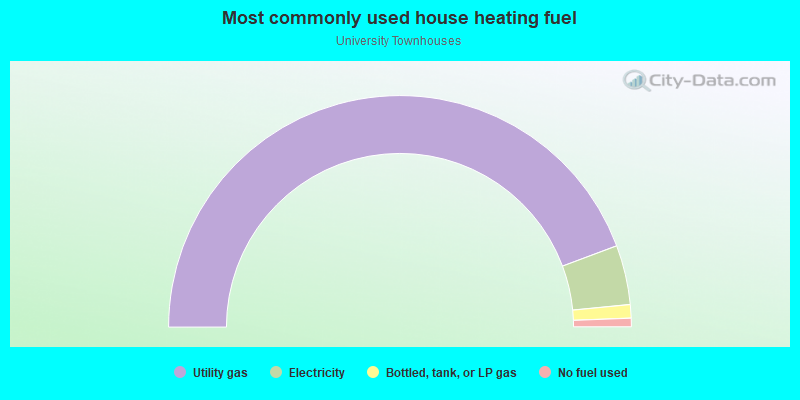
- 88.6%Utility gas
- 8.3%Electricity
- 1.9%Bottled, tank, or LP gas
- 1.2%No fuel used
Roads and streets:
Braeburn Cir
Length: 0.98 miles
Directions: E-W, N-S, SE-NW, SW-NE
Address range: 2562 to 3599
Directions: E-W, N-S, SE-NW, SW-NE
Address range: 2562 to 3599