Wallace Heights neighborhood in Midland, Texas (TX), 79707 detailed profile
Settings
X


Business Search - 14 Million verified businesses
Area: 0.211 square miles
Population: 903
Population density:
| Wallace Heights: | 4,284 people per square mile |
| Midland: | 2,018 people per square mile |

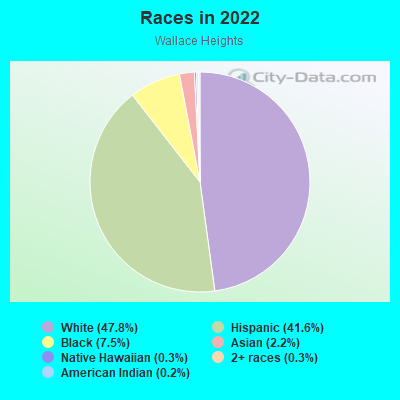
- 44547.8%White
- 38741.6%Hispanic or Latino
- 707.5%Black
- 202.2%Asian
- 30.3%Native Hawaiian and Other
Pacific Islander - 30.3%Two or more races
- 20.2%American Indian
Median household income in 2022:
| Wallace Heights: | $92,918 |
| Midland: | $80,235 |
Distribution of median household income
![Distribution of median household income]()
- 14Less than $10,000
- 31$10,000 to $19,999
- 21$20,000 to $29,999
- 100$30,000 to $39,999
- 6$40,000 to $49,999
- 142$50,000 to $59,999
- 133$60,000 to $74,999
- 103$75,000 to $99,999
- 46$100,000 to $124,999
- 51$125,000 to $149,999
- 34$150,000 to $199,999
- 30$200,000 or more

Distribution of owner-occupied house/condo value
![Distribution of owner-occupied house/condo value]()
- 6Less than $50,000
- 10$50,000 to $99,999
- 26$100,000 to $149,999
- 43$150,000 to $199,999
- 41$200,000 to $249,999
- 64$250,000 to $299,999
- 20$300,000 to $399,999
- 11$400,000 to $499,999
- 30$500,000 to $749,999

Distribution of rent paid by renters
![Distribution of rent paid by renters]()
- 3$400 to $499
- 6$500 to $599
- 5$600 to $699
- 84$700 to $799
- 8$800 to $899
- 4$900 to $999
- 71$1,000 to $1,249
- 33$1,250 to $1,499
- 133$1,500 to $1,999
- 66$2,000 or more

Median rent in 2022:
| Wallace Heights: | $1,568 |
| Midland: | $1,135 |
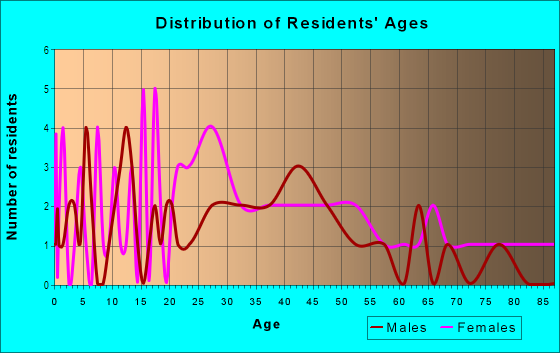
| Males: | 261 |
| Females: | 641 |
Males:
| This neighborhood: | 28.2 years |
| Whole city: | 32.3 years |
| This neighborhood: | 30.5 years |
| Whole city: | 33.3 years |
Average household size:
| Wallace Heights: | 2.3 people |
| Midland: | 2.4 people |
Percentage of family households:
| Wallace Heights: | 38.1% |
| Midland: | 52.0% |
| Here: | 34.1% |
| Midland: | 46.4% |
Percentage of married-couple families with children (among all households):
| Wallace Heights: | 7.8% |
| Midland: | 30.9% |
Percentage of single-mother households (among all households):
| Wallace Heights: | 46.3% |
| Midland: | 8.1% |
Percentage of never married males 15 years old and over:
Percentage of never married females 15 years old and over:
| Wallace Heights: | 10.3% |
| Midland: | 15.2% |
Percentage of never married females 15 years old and over:
| Wallace Heights: | 38.4% |
| city: | 14.9% |
Percentage of people that speak English not well or not at all:
| Wallace Heights: | 7.8% |
| Midland: | 5.7% |
Percentage of people born in this state:
Percentage of people born in another U.S. state:
Percentage of native residents but born outside the U.S.:
Percentage of foreign born residents:
| Here: | 72.1% |
| Midland: | 69.5% |
Percentage of people born in another U.S. state:
| Wallace Heights: | 19.5% |
| Midland: | 18.2% |
Percentage of native residents but born outside the U.S.:
| Here: | 0.9% |
| city: | 1.2% |
Percentage of foreign born residents:
| Here: | 7.5% |
| Midland: | 11.2% |
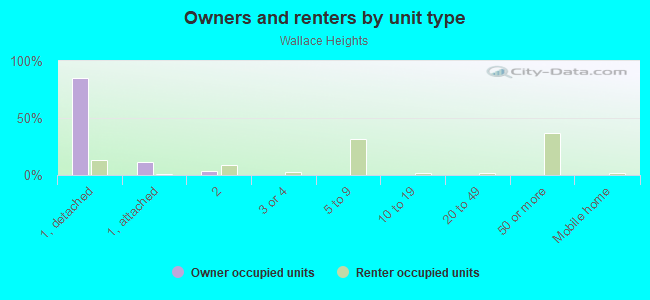
Owner-occupied
Renter-occupied

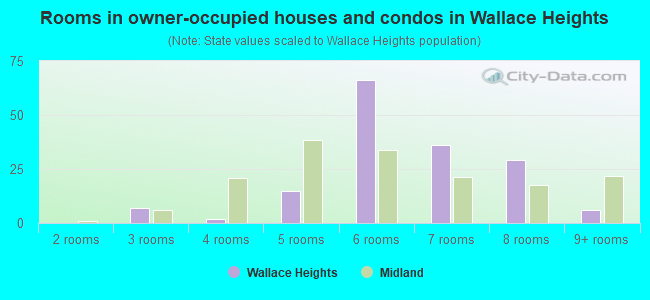
- Rooms in owner-occupied houses and condos in Wallace Heights
- 01 room
- 02 rooms
- 73 rooms
- 24 rooms
- 155 rooms
- 666 rooms
- 367 rooms
- 298 rooms
- 69+ rooms
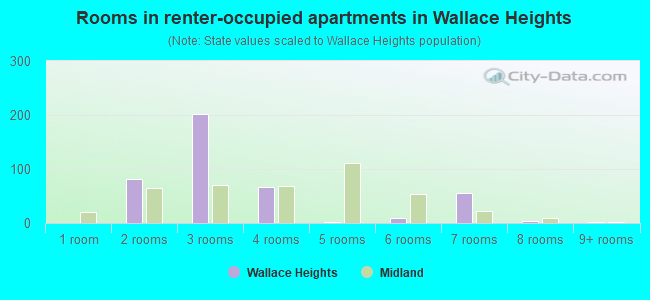
- Rooms in renter-occupied apartments in Wallace Heights
- 01 room
- 812 rooms
- 2023 rooms
- 664 rooms
- 25 rooms
- 106 rooms
- 557 rooms
- 48 rooms
- 29+ rooms
Owner-occupied
Renter-occupied
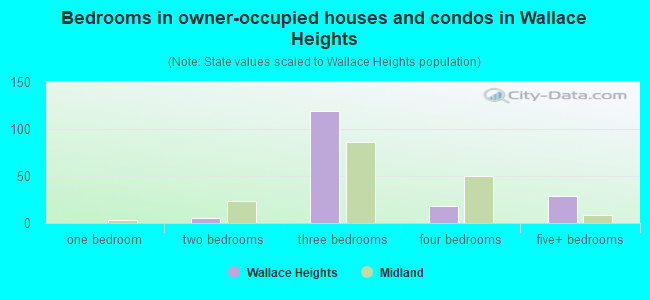
- Bedrooms in owner-occupied houses and condos in Wallace Heights
- 0no bedroom
- 01 bedroom
- 52 bedrooms
- 1193 bedrooms
- 184 bedrooms
- 295+ bedrooms
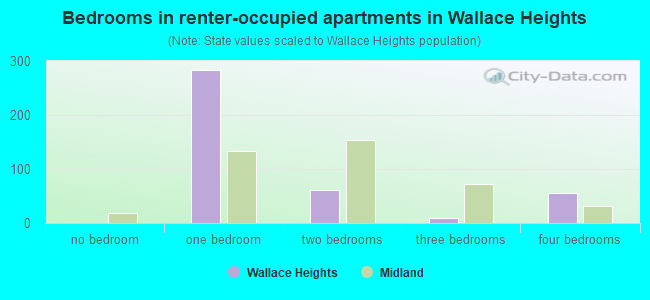
- Bedrooms in renter-occupied apartments in Wallace Heights
- 0no bedroom
- 2841 bedroom
- 622 bedrooms
- 103 bedrooms
- 554 bedrooms
- 05+ bedrooms
Average number of cars or other vehicles available in houses/condos:
Average number of cars or other vehicles available in apartments:
| This neighborhood: | 2.3 |
| Midland: | 2.1 |
Average number of cars or other vehicles available in apartments:
| Here: | 1.2 |
| city: | 1.4 |
Percentage of units with a mortgage:
| Wallace Heights: | 45.0% |
| Midland: | 58.2% |
Average estimated value of detached houses in 2022 (35.1% of all units):
| Wallace Heights: | $312,459 |
| Texas: | $369,058 |
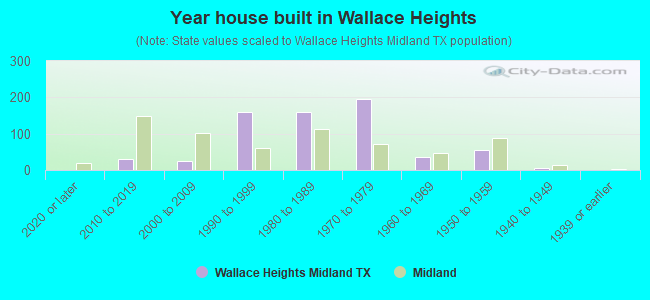
- Year house built in Wallace Heights
- 02020 or later
- 292010 to 2019
- 262000 to 2009
- 1611990 to 1999
- 1591980 to 1989
- 1951970 to 1979
- 361960 to 1969
- 551950 to 1959
- 51940 to 1949
- 01939 or earlier
City-data.com crime index for city in 2020 (higher means more crime):
| City: | 223.8 |
| U.S. average: | 219.5 |
Travel time to work (commute)
![Travel time to work (commute)]()
- 7Less than 5 minutes
- 835 to 9 minutes
- 10510 to 14 minutes
- 8415 to 19 minutes
- 5520 to 24 minutes
- 325 to 29 minutes
- 2230 to 34 minutes
- 235 to 39 minutes
- 240 to 44 minutes
- 1545 to 59 minutes
- 1760 to 89 minutes
- 1990 or more minutes

Means of transportation to work
![Means of transportation to work]()
- 89.6%579Drove a car alone
- 11.1%72Carpooled
- 1.5%10Bicycle
- 0.8%5Walked
- 10.2%66Other means
- 2.9%19Worked at home

Time leaving home to go to work
![Time leaving home to go to work]()
- 3412:00 a.m. to 4:59 a.m.
- 225:00 a.m. to 5:29 a.m.
- 45:30 a.m. to 5:59 a.m.
- 306:00 a.m. to 6:29 a.m.
- 526:30 a.m. to 6:59 a.m.
- 117:00 a.m. to 7:29 a.m.
- 507:30 a.m. to 7:59 a.m.
- 738:00 a.m. to 8:29 a.m.
- 338:30 a.m. to 8:59 a.m.
- 229:00 a.m. to 9:59 a.m.
- 210:00 a.m. to 10:59 a.m.
- 1712:00 p.m. to 3:59 p.m.
- 554:00 p.m. to 11:59 p.m.

Occupations of males:
- Percentage of males in business and financial operations occupations:
Here: 21.7% city: 3.8%
- Percentage of males in computer and mathematical occupations:
Here: 2.1% city: 1.9%
- Percentage of males in education, training, and library occupations:
Here: 5.0% city: 2.5%
- Percentage of males in service occupations:
Here: 10.1% city: 9.5%
- Percentage of males in sales and office occupations:
Here: 46.4% city: 14.8%
- Percentage of males in production occupations:
Here: 21.7% city: 7.5%
- Percentage of males in transportation occupations:
Here: 9.3% city: 5.1%
- Percentage of males in material moving occupations:
Here: 13.7% city: 4.8%
Occupations of females:
- Percentage of females in management occupations (except farmers):
Here: 33.4% city: 11.6%
- Percentage of females in community and social services occupations:
Here: 1.2% city: 1.7%
- Percentage of females in arts, design, entertainment, sports, and media occupations:
Here: 25.6% city: 1.7%
- Percentage of females in service occupations:
Here: 19.8% city: 16.8%
- Percentage of females in sales and office occupations:
Here: 21.2% city: 33.2%
- Percentage of females in material moving occupations:
Here: 11.6% city: 1.8%
Percentage of people 16-64 in Armed Forces:
| Wallace Heights: | 2.7% |
| Midland: | 0.2% |
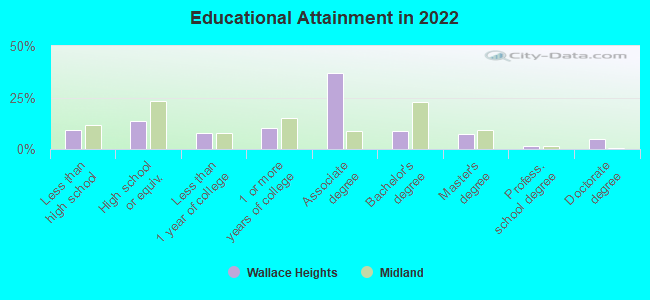
Education in this neighborhood (subdivision or community):
- Percentage of people 3 years and older in K-12 schools:
Wallace Heights: 30.7% Midland: 22.4%
- Percentage of people 3 years and older in undergraduate colleges:
Wallace Heights: 11.6% Midland: 3.0%
- Percentage of people 3 years and older in grad. or professional schools:
Wallace Heights: 1.3% Midland: 1.8%
- Percentage of students K-12 enrolled in private schools:
Wallace Heights: 5.4% Midland: 16.2%
Percentage of population below poverty level:
| Wallace Heights: | 4.9% |
| Midland: | 11.7% |
Median year owner moved in (as recorded in 2022):
| Wallace Heights: | 2005 |
| Midland: | 2015 |
Percentage of married-couple families with both working:
| Wallace Heights: | 220.1% |
| Midland: | 63.2% |
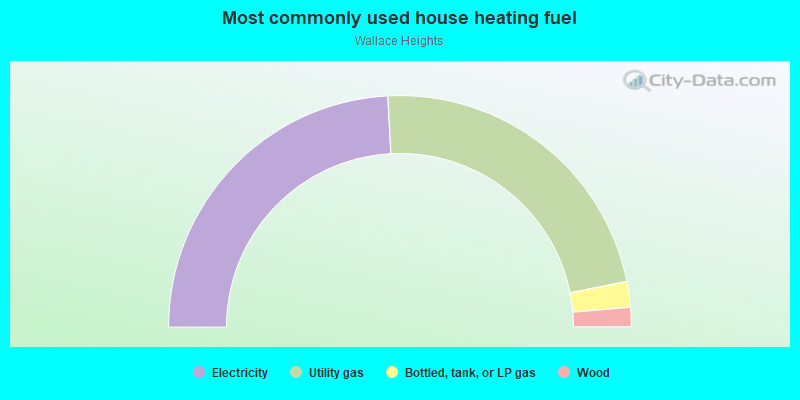
- 48.4%Electricity
- 45.4%Utility gas
- 3.6%Bottled, tank, or LP gas
- 2.7%Wood
Roads and streets:
Sinclair Ave
Length: 1.08 miles
Direction: E-W
Address range: 4501 to 5309
Direction: E-W
Address range: 4501 to 5309
Idlewilde Dr
Length: 0.20 miles
Direction: N-S
Address range: 1700 to 1899
Direction: N-S
Address range: 1700 to 1899
San Jacinto
Length: 0.07 miles
Direction: N-S
Direction: N-S