Races in Adelphi, Maryland (MD) Detailed Stats
Data:
Races - White alone (%)
Races - White alone (% change since 2000)
Races - Black alone (%)
Races - Black alone (% change since 2000)
Races - American Indian alone (%)
Races - American Indian alone (% change since 2000)
Races - Asian alone (%)
Races - Asian alone (% change since 2000)
Races - Hispanic (%)
Races - Hispanic (% change since 2000)
Races - Native Hawaiian and Other Pacific Islander alone (%)
Races - Native Hawaiian and Other Pacific Islander alone (% change since 2000)
Races - Two or more races(%)
Races - Two or more races(% change since 2000)
Races - Other race alone (%)
Races - Other race alone (% change since 2000)
Racial diversity
Place of birth - Born in state of residence (%)
Place of birth - Born in state of residence (%) - White
Place of birth - Born in state of residence (%) - Black or African American
Place of birth - Born in state of residence (%) - Asian
Place of birth - Born in state of residence (%) - Hispanic or Latino
Place of birth - Born in state of residence (%) - American Indian and Alaska Native
Place of birth - Born in state of residence (%) - Multirace
Place of birth - Born in state of residence (%) - Other Race
Place of birth - Born in other state (%)
Place of birth - Born in other state (%) - White
Place of birth - Born in other state (%) - Black or African American
Place of birth - Born in other state (%) - Asian
Place of birth - Born in other state (%) - Hispanic or Latino
Place of birth - Born in other state (%) - American Indian and Alaska Native
Place of birth - Born in other state (%) - Multirace
Place of birth - Born in other state (%) - Other Race
Place of birth - Native, outside of US (%)
Place of birth - Native, outside of US (%) - White
Place of birth - Native, outside of US (%) - Black or African American
Place of birth - Native, outside of US (%) - Asian
Place of birth - Native, outside of US (%) - Hispanic or Latino
Place of birth - Native, outside of US (%) - American Indian and Alaska Native
Place of birth - Native, outside of US (%) - Multirace
Place of birth - Native, outside of US (%) - Other Race
Place of birth - Foreign born (%)
Place of birth - Foreign born (%) - White
Place of birth - Foreign born (%) - Black or African American
Place of birth - Foreign born (%) - Asian
Place of birth - Foreign born (%) - Hispanic or Latino
Place of birth - Foreign born (%) - American Indian and Alaska Native
Place of birth - Foreign born (%) - Multirace
Place of birth - Foreign born (%) - Other Race
Residents speaking English at home (%)
Residents speaking English at home - Born in the United States (%)
Residents speaking English at home - Native, born elsewhere (%)
Residents speaking English at home - Foreign born (%)
Residents speaking Spanish at home (%)
Residents speaking Spanish at home - Born in the United States (%)
Residents speaking Spanish at home - Native, born elsewhere (%)
Residents speaking Spanish at home - Foreign born (%)
Residents speaking other language at home (%)
Residents speaking other language at home - Born in the United States (%)
Residents speaking other language at home - Native, born elsewhere (%)
Residents speaking other language at home - Foreign born (%)
Marital status - Never married (%)
Marital status - Now married (%)
Marital status - Separated (%)
Marital status - Widowed (%)
Marital status - Divorced (%)
Ancestries Reported - Arab (%)
Ancestries Reported - Czech (%)
Ancestries Reported - Danish (%)
Ancestries Reported - Dutch (%)
Ancestries Reported - English (%)
Ancestries Reported - French (%)
Ancestries Reported - French Canadian (%)
Ancestries Reported - German (%)
Ancestries Reported - Greek (%)
Ancestries Reported - Hungarian (%)
Ancestries Reported - Irish (%)
Ancestries Reported - Italian (%)
Ancestries Reported - Lithuanian (%)
Ancestries Reported - Norwegian (%)
Ancestries Reported - Polish (%)
Ancestries Reported - Portuguese (%)
Ancestries Reported - Russian (%)
Ancestries Reported - Scotch-Irish (%)
Ancestries Reported - Scottish (%)
Ancestries Reported - Slovak (%)
Ancestries Reported - Subsaharan African (%)
Ancestries Reported - Swedish (%)
Ancestries Reported - Swiss (%)
Ancestries Reported - Ukrainian (%)
Ancestries Reported - United States (%)
Ancestries Reported - Welsh (%)
Ancestries Reported - West Indian (%)
Ancestries Reported - Other (%)
Geographical mobility - Same house 1 year ago (%)
Geographical mobility - Same house 1 year ago (%) - White
Geographical mobility - Same house 1 year ago (%) - Black or African American
Geographical mobility - Same house 1 year ago (%) - Asian
Geographical mobility - Same house 1 year ago (%) - Hispanic or Latino
Geographical mobility - Same house 1 year ago (%) - American Indian and Alaska Native
Geographical mobility - Same house 1 year ago (%) - Multirace
Geographical mobility - Same house 1 year ago (%) - Other Race
Geographical mobility - Moved within same county (%)
Geographical mobility - Moved within same county (%) - White
Geographical mobility - Moved within same county (%) - Black or African American
Geographical mobility - Moved within same county (%) - Asian
Geographical mobility - Moved within same county (%) - Hispanic or Latino
Geographical mobility - Moved within same county (%) - American Indian and Alaska Native
Geographical mobility - Moved within same county (%) - Multirace
Geographical mobility - Moved within same county (%) - Other Race
Geographical mobility - Moved from different county within same state (%)
Geographical mobility - Moved from different county within same state (%) - White
Geographical mobility - Moved from different county within same state (%) - Black or African American
Geographical mobility - Moved from different county within same state (%) - Asian
Geographical mobility - Moved from different county within same state (%) - Hispanic or Latino
Geographical mobility - Moved from different county within same state (%) - American Indian and Alaska Native
Geographical mobility - Moved from different county within same state (%) - Multirace
Geographical mobility - Moved from different county within same state (%) - Other Race
Geographical mobility - Moved from different state (%)
Geographical mobility - Moved from different state (%) - White
Geographical mobility - Moved from different state (%) - Black or African American
Geographical mobility - Moved from different state (%) - Asian
Geographical mobility - Moved from different state (%) - Hispanic or Latino
Geographical mobility - Moved from different state (%) - American Indian and Alaska Native
Geographical mobility - Moved from different state (%) - Multirace
Geographical mobility - Moved from different state (%) - Other Race
Geographical mobility - Moved from abroad (%)
Geographical mobility - Moved from abroad (%) - White
Geographical mobility - Moved from abroad (%) - Black or African American
Geographical mobility - Moved from abroad (%) - Asian
Geographical mobility - Moved from abroad (%) - Hispanic or Latino
Geographical mobility - Moved from abroad (%) - American Indian and Alaska Native
Geographical mobility - Moved from abroad (%) - Multirace
Geographical mobility - Moved from abroad (%) - Other Race
Place of birth for the foreign-born population - Ireland (%)
Place of birth for the foreign-born population - Denmark (%)
Place of birth for the foreign-born population - Norway (%)
Place of birth for the foreign-born population - Sweden (%)
Place of birth for the foreign-born population - United Kingdom (%)
Place of birth for the foreign-born population - England (%)
Place of birth for the foreign-born population - Scotland (%)
Place of birth for the foreign-born population - Other Northern Europe (%)
Place of birth for the foreign-born population - Austria (%)
Place of birth for the foreign-born population - Belgium (%)
Place of birth for the foreign-born population - France (%)
Place of birth for the foreign-born population - Germany (%)
Place of birth for the foreign-born population - Netherlands (%)
Place of birth for the foreign-born population - Switzerland (%)
Place of birth for the foreign-born population - Other Western Europe (%)
Place of birth for the foreign-born population - Greece (%)
Place of birth for the foreign-born population - Italy (%)
Place of birth for the foreign-born population - Portugal (%)
Place of birth for the foreign-born population - Spain (%)
Place of birth for the foreign-born population - Other Southern Europe (%)
Place of birth for the foreign-born population - Albania (%)
Place of birth for the foreign-born population - Belarus (%)
Place of birth for the foreign-born population - Bosnia and Herzegovina (%)
Place of birth for the foreign-born population - Bulgaria (%)
Place of birth for the foreign-born population - Croatia (%)
Place of birth for the foreign-born population - Czechoslovakia (%)
Place of birth for the foreign-born population - Hungary (%)
Place of birth for the foreign-born population - Latvia (%)
Place of birth for the foreign-born population - Lithuania (%)
Place of birth for the foreign-born population - North Macedonia (Macedonia) (%)
Place of birth for the foreign-born population - Moldova (%)
Place of birth for the foreign-born population - Poland (%)
Place of birth for the foreign-born population - Romania (%)
Place of birth for the foreign-born population - Russia (%)
Place of birth for the foreign-born population - Serbia (%)
Place of birth for the foreign-born population - Ukraine (%)
Place of birth for the foreign-born population - Other Eastern Europe (%)
Place of birth for the foreign-born population - China (%)
Place of birth for the foreign-born population - Hong Kong (%)
Place of birth for the foreign-born population - Taiwan (%)
Place of birth for the foreign-born population - Japan (%)
Place of birth for the foreign-born population - Korea (%)
Place of birth for the foreign-born population - Other Eastern Asia (%)
Place of birth for the foreign-born population - Afghanistan (%)
Place of birth for the foreign-born population - Bangladesh (%)
Place of birth for the foreign-born population - India (%)
Place of birth for the foreign-born population - Iran (%)
Place of birth for the foreign-born population - Kazakhstan (%)
Place of birth for the foreign-born population - Nepal (%)
Place of birth for the foreign-born population - Pakistan (%)
Place of birth for the foreign-born population - Sri Lanka (%)
Place of birth for the foreign-born population - Uzbekistan (%)
Place of birth for the foreign-born population - Other South Central Asia (%)
Place of birth for the foreign-born population - Burma (%)
Place of birth for the foreign-born population - Cambodia (%)
Place of birth for the foreign-born population - Indonesia (%)
Place of birth for the foreign-born population - Laos (%)
Place of birth for the foreign-born population - Malaysia (%)
Place of birth for the foreign-born population - Philippines (%)
Place of birth for the foreign-born population - Singapore (%)
Place of birth for the foreign-born population - Thailand (%)
Place of birth for the foreign-born population - Vietnam (%)
Place of birth for the foreign-born population - Other South Eastern Asia (%)
Place of birth for the foreign-born population - Armenia (%)
Place of birth for the foreign-born population - Iraq (%)
Place of birth for the foreign-born population - Israel (%)
Place of birth for the foreign-born population - Jordan (%)
Place of birth for the foreign-born population - Kuwait (%)
Place of birth for the foreign-born population - Lebanon (%)
Place of birth for the foreign-born population - Saudi Arabia (%)
Place of birth for the foreign-born population - Syria (%)
Place of birth for the foreign-born population - Turkey (%)
Place of birth for the foreign-born population - Yemen (%)
Place of birth for the foreign-born population - Other Western Asia (%)
Place of birth for the foreign-born population - Eritrea (%)
Place of birth for the foreign-born population - Ethiopia (%)
Place of birth for the foreign-born population - Kenya (%)
Place of birth for the foreign-born population - Somalia (%)
Place of birth for the foreign-born population - Uganda (%)
Place of birth for the foreign-born population - Zimbabwe (%)
Place of birth for the foreign-born population - Other Eastern Africa (%)
Place of birth for the foreign-born population - Cameroon (%)
Place of birth for the foreign-born population - Congo (%)
Place of birth for the foreign-born population - Democratic Republic of Congo (Zaire) (%)
Place of birth for the foreign-born population - Other Middle Africa (%)
Place of birth for the foreign-born population - Egypt (%)
Place of birth for the foreign-born population - Morocco (%)
Place of birth for the foreign-born population - Sudan (%)
Place of birth for the foreign-born population - Other Northern Africa (%)
Place of birth for the foreign-born population - South Africa (%)
Place of birth for the foreign-born population - Other Southern Africa (%)
Place of birth for the foreign-born population - Cabo Verde (%)
Place of birth for the foreign-born population - Ghana (%)
Place of birth for the foreign-born population - Liberia (%)
Place of birth for the foreign-born population - Nigeria (%)
Place of birth for the foreign-born population - Senegal (%)
Place of birth for the foreign-born population - Sierra Leone (%)
Place of birth for the foreign-born population - Other Western Africa (%)
Place of birth for the foreign-born population - Australia (%)
Place of birth for the foreign-born population - New Zealand (%)
Place of birth for the foreign-born population - Fiji (%)
Place of birth for the foreign-born population - Micronesia (%)
Place of birth for the foreign-born population - Bahamas (%)
Place of birth for the foreign-born population - Barbados (%)
Place of birth for the foreign-born population - Cuba (%)
Place of birth for the foreign-born population - Dominica (%)
Place of birth for the foreign-born population - Dominican Republic (%)
Place of birth for the foreign-born population - Grenada (%)
Place of birth for the foreign-born population - Haiti (%)
Place of birth for the foreign-born population - Jamaica (%)
Place of birth for the foreign-born population - St. Vincent and the Grenadines (%)
Place of birth for the foreign-born population - Trinidad and Tobago (%)
Place of birth for the foreign-born population - West Indies (%)
Place of birth for the foreign-born population - Other Caribbean (%)
Place of birth for the foreign-born population - Belize (%)
Place of birth for the foreign-born population - Costa Rica (%)
Place of birth for the foreign-born population - El Salvador (%)
Place of birth for the foreign-born population - Guatemala (%)
Place of birth for the foreign-born population - Honduras (%)
Place of birth for the foreign-born population - Mexico (%)
Place of birth for the foreign-born population - Nicaragua (%)
Place of birth for the foreign-born population - Panama (%)
Place of birth for the foreign-born population - Other Central America (%)
Place of birth for the foreign-born population - Argentina (%)
Place of birth for the foreign-born population - Bolivia (%)
Place of birth for the foreign-born population - Brazil (%)
Place of birth for the foreign-born population - Chile (%)
Place of birth for the foreign-born population - Colombia (%)
Place of birth for the foreign-born population - Ecuador (%)
Place of birth for the foreign-born population - Guyana (%)
Place of birth for the foreign-born population - Peru (%)
Place of birth for the foreign-born population - Uruguay (%)
Place of birth for the foreign-born population - Venezuela (%)
Place of birth for the foreign-born population - Other South America (%)
Place of birth for the foreign-born population - Canada (%)
Place of birth for the foreign-born population - Other Northern America (%)
Place of birth for the foreign-born population - Other (%)
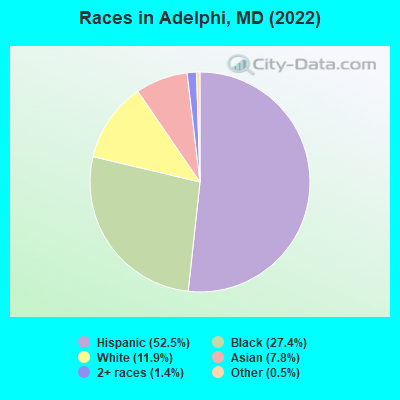
According to 2022 data, the most numerous races in Adelphi, MD are White alone (2,003 residents), Black alone (4,596 residents), and Hispanic (8,797 residents). 26.8% of Adelphi residents speak English at home. 60.5% of Adelphi, MD residents are foreign-born (34.2% born in Latin America, 13.7% born in Africa, 7.4% born in Asia), which is 73.5% greater than the foreign-born rate of 16.0% across the entire state of Maryland.
Race distribution in Adelphi
2000 2022
3,286,547 62.1% White alone 1,464,735 27.7% Black alone 227,916 4.3% Hispanic 209,738 4.0% Asian alone 82,946 1.6% Two or more races 13,312 0.3% American Indian alone 9,379 0.2% Other race alone 1,913 0.04% Native Hawaiian and Other
2,906,492 47.1% White alone 1,800,914 29.2% Black alone 705,842 11.4% Hispanic 401,818 6.5% Asian alone 291,317 4.7% Two or more races 46,930 0.8% Other race alone 8,930 0.1% American Indian alone 2,417 0.04% Native Hawaiian and Other
Income and house value in Adelphi Median household income in 2022 $79,322 White non-Hispanic householders$60,150 Black householders$51,016 Asian householders$74,226 Some other race householders$113,863 Two or more races householders$74,494 Hispanic or Latino race householdersMedian 2022 house value $453,791 White Non-Hispanic householders$458,633 Black or African American householders $564,885 Asian householders$376,052 Some other race householders$401,875 Two or more races householders$379,549 Hispanic or Latino householders
Median age by race in Adelphi
34.8 Median age for White residents30.7 37.8 37.4 Median age for Black or African American residents35.9 43.4 89.1 Median age for American Indian / Alaska Native residents-888,297,871.5 79.0 38.6 Median age for Asian residents38.0 34.3 -571,600,480.8 Median age for Native Hawaiian / Pacific Islander residents-720,061,021.4 -760,942,760.2 29.5 Median age for Other race residents33.0 26.7 26.8 Median age for Two or more races residents28.3 26.6 37.1 Median age for White alone residents29.0 40.4 29.7 Median age for Hispanic or Latino residents34.0 26.4
Owner/renter occupied households by race in Adelphi
House owners and renters - White residents 445 40.2% Owner occupied661 59.8% Renter occupiedHouse owners and renters - Black or African American residents 799 44.7% Owner occupied988 55.3% Renter occupiedHouse owners and renters - American Indian / Alaska Native residents 80 92.8% Owner occupied6 7.2% Renter occupiedHouse owners and renters - Asian residents 206 37.2% Owner occupied347 62.8% Renter occupiedHouse owners and renters - Other race residents 666 37.9% Owner occupied1,090 62.1% Renter occupiedHouse owners and renters - Two or more races residents 165 46.5% Owner occupied190 53.5% Renter occupiedHouse owners and renters - White alone residents 444 45.8% Owner occupied525 54.2% Renter occupiedHouse owners and renters - Hispanic or Latino residents 864 39.3% Owner occupied1,333 60.7% Renter occupied
Language usage in Adelphi
English speakers - Total 26.8% of residents of Adelphi speak English at home.
50.4% of residents speak Spanish at home 2,874 35.9% Speak English very well5,123 64.1% Speak English less than very well26.2% of residents speak other language at home 2,260 54.4% Speak English very well1,894 45.6% Speak English less than very well
English speakers - Born in the United States 64.9% of residents of Adelphi speak English at home.
28.1% of residents speak Spanish at home 753 78.4% Speak English very well208 21.6% Speak English less than very well8.6% of residents speak other language at home 128 43.2% Speak English very well168 56.8% Speak English less than very well
English speakers - Native, born elsewhere 60.2% of residents of Adelphi speak English at home.
38.3% of residents speak Spanish at home 19 37.3% Speak English very well32 62.7% Speak English less than very well3.0% of residents speak other language at home 4 100.0% Speak English very well
English speakers - Foreign-born 9.4% of residents of Adelphi speak English at home.
53.7% of residents speak Spanish at home 744 13.6% Speak English very well4,735 86.4% Speak English less than very well35.0% of residents speak other language at home 1,867 52.3% Speak English very well1,704 47.7% Speak English less than very well
White (Caucasian) - Speak only English Native:
77.9% (1,574)Foreign-born:
24.0% (100)
White (Caucasian) - Speak another language Native:
21.0% (425)Foreign-born:
75.9% (316)
Black or African American - Speak only English Native:
86.2% (1,361)Foreign-born:
24.9% (746)
Black or African American - Speak another language Native:
15.2% (241)Foreign-born:
76.7% (2,294)
American Indian / Alaska Native - Speak another language Native:
100.0% (38)Foreign-born:
99.9% (155)
Asian - Speak only English Native:
33.4% (63)Foreign-born:
6.2% (68)
Asian - Speak another language Native:
70.3% (134)Foreign-born:
92.2% (1,013)
Other race - Speak only English Native:
6.2% (131)Foreign-born:
0.5% (23)
Other race - Speak another language Native:
92.3% (1,961)Foreign-born:
99.9% (4,327)
Two or more races - Speak another language Native:
56.5% (318)Foreign-born:
100.0% (1,280)
White alone - Speak only English Native:
86.2% (1,411)Foreign-born:
21.7% (84)
White alone - Speak another language Native:
15.6% (256)Foreign-born:
77.7% (300)
Hispanic or Latino - Speak only English Native:
10.9% (312)Foreign-born:
0.8% (45)
Hispanic or Latino - Speak another language Native:
88.1% (2,527)Foreign-born:
99.8% (5,501)
Foreign-born residents in Adelphi 10,135 residents are foreign born (34.2% Latin America , 13.7% Africa , 7.4% Asia ).
This city:
60.5%Maryland:
15.7%
Marital status for residents in Adelphi Marital status - White (Caucasian) population 15 years and over
Males 58.8% Never married35.1% Now married0.3% Separated2.4% Widowed3.4% DivorcedFemales 39.6% Never married43.0% Now married1.0% Separated5.0% Widowed11.4% DivorcedWomen who gave birth in the past 12 months Now married:
100.0% (5)Unmarried:
0.0% (0)
Women who did not give birth in the past 12 months Now married:
34.3% (175)Unmarried:
65.7% (334)
Marital status - Black or African American population 15 years and over
Males 53.4% Never married33.9% Now married1.7% Separated2.0% Widowed9.1% DivorcedFemales 38.8% Never married35.4% Now married3.1% Separated9.7% Widowed13.1% DivorcedWomen who gave birth in the past 12 months Now married:
55.7% (32)Unmarried:
44.3% (25)
Women who did not give birth in the past 12 months Now married:
37.9% (349)Unmarried:
62.1% (571)
Marital status - American Indian / Alaska Native population 15 years and over
Males 0.0% Never married100.0% Now married0.0% Separated0.0% Widowed0.0% DivorcedFemales 10.3% Never married10.3% Now married79.4% Separated0.0% Widowed0.0% DivorcedWomen who did not give birth in the past 12 months Now married:
50.0% (10)Unmarried:
50.0% (10)
Marital status - Asian population 15 years and over
Males 64.2% Never married29.8% Now married0.0% Separated0.5% Widowed5.5% DivorcedFemales 71.2% Never married26.8% Now married0.0% Separated1.1% Widowed0.9% DivorcedWomen who gave birth in the past 12 months Now married:
0.0% (0)Unmarried:
100.0% (10)
Women who did not give birth in the past 12 months Now married:
12.5% (37)Unmarried:
87.5% (260)
Marital status - Other race population 15 years and over
Males 66.4% Never married30.6% Now married0.0% Separated1.4% Widowed1.7% DivorcedFemales 55.9% Never married36.0% Now married0.9% Separated0.4% Widowed6.8% DivorcedWomen who gave birth in the past 12 months Now married:
24.4% (11)Unmarried:
75.6% (34)
Women who did not give birth in the past 12 months Now married:
31.1% (488)Unmarried:
68.9% (1,081)
Marital status - Two or more races population 15 years and over
Males 77.3% Never married22.7% Now married0.0% Separated0.0% Widowed0.0% DivorcedFemales 48.7% Never married16.1% Now married8.8% Separated0.2% Widowed26.1% DivorcedWomen who gave birth in the past 12 months Now married:
100.0% (9)Unmarried:
0.0% (0)
Women who did not give birth in the past 12 months Now married:
26.8% (98)Unmarried:
73.2% (267)
Marital status - White alone, not Hispanic / Latino population 15 years and over
Males 55.1% Never married39.7% Now married0.4% Separated1.9% Widowed2.9% DivorcedFemales 37.0% Never married44.7% Now married1.2% Separated5.0% Widowed12.2% DivorcedWomen who did not give birth in the past 12 months Now married:
34.4% (147)Unmarried:
65.6% (280)
Marital status - Hispanic or Latino population 15 years and over
Males 67.0% Never married29.3% Now married0.0% Separated1.5% Widowed2.2% DivorcedFemales 51.6% Never married32.6% Now married4.5% Separated0.7% Widowed10.7% DivorcedWomen who gave birth in the past 12 months Now married:
43.6% (25)Unmarried:
56.4% (32)
Women who did not give birth in the past 12 months Now married:
33.2% (628)Unmarried:
66.8% (1,266)
Ancestries in Adelphi
817 6.5% Ethiopian681 5.4% African337 2.7% Egyptian266 2.1% Nigerian225 1.8% Haitian160 1.3% Jamaican117 0.9% Irish96 0.8% American93 0.7% German61 0.5% Italian46 0.4% Moroccan46 0.4% Guyanese37 0.3% Senegalese37 0.3% English32 0.3% French31 0.2% Russian30 0.2% Kenyan30 0.2% Trinidadian and Tobagonian28 0.2% Scottish28 0.2% Iranian18 0.1% Barbadian18 0.1% Romanian15 0.1% West Indian14 0.1% Turkish14 0.1% Slavic12 0.10% European11 0.09% Scotch-Irish10 0.08% Dutch8 0.06% Ghanaian8 0.06% Norwegian5 0.04% Sierra Leonean5 0.04% Greek4 0.03% Canadian4 0.03% Austrian3 0.02% Czech
Geographical mobility in Adelphi Same house 1 year ago 2,177 86.7% White (Caucasian)3,917 86.7% Black or African American142 98.9% American Indian / Alaska Native1,191 90.1% Asian6,131 90.6% Other race1,428 83.5% Two or more races1,722 85.7% White alone, not Hispanic / Latino7,837 90.3% Hispanic or LatinoMoved within same county 88 3.5% White / Caucasian281 6.2% Black or African American90 6.8% Asian373 5.5% Other race124 7.3% Two or more races91 4.5% White alone, not Hispanic / Latino452 5.2% Hispanic or LatinoMoved within same state 95 3.8% White / Caucasian239 5.3% Black or African American14 1.1% Asian76 1.1% Other race21 1.2% Two or more races78 3.9% White alone, not Hispanic / Latino113 1.3% Hispanic or LatinoMoved from different state 110 4.4% White / Caucasian53 1.2% Black or African American4 0.3% Asian26 0.4% Other race76 4.4% Two or more races86 4.3% White alone, not Hispanic / Latino87 1.0% Hispanic or LatinoMoved from abroad 34 1.4% White21 0.5% Black or African American37 2.8% Asian147 2.2% Other race35 1.7% White alone, not Hispanic / Latino181 2.1% Hispanic or Latino
Children Nativity (place of birth) in Adelphi
Children under 6 years - Living with two parents Both parents foreign-born 455 97.2% Native13 2.8% Foreign-bornOne native, one foreign-born parent 80 100.0% NativeChildren under 6 years - Living with one parent Native parent 15 97.6% Native0 2.4% Foreign-bornForeign-born parent 485 83.2% Native98 16.8% Foreign-bornChildren 6 to 17 years - Living with two parents Both parents native 1 68.1% Foreign-bornBoth parents foreign-born 1,050 84.8% Native188 15.2% Foreign-bornOne native, one foreign-born parent 75 100.0% NativeChildren 6 to 17 years - Living with one parent Native parent 9 100.0% Foreign-bornForeign-born parent 1,267 65.5% Native666 34.5% Foreign-born
Grandparents responsible for own grandchildren in Adelphi
Grandparents (30 to 59 years) White / Caucasian 6 100.0% Responsible for grandchildrenBlack or African American 80 86.8% Responsible for grandchildren12 13.2% Not responsible for grandchildrenAsian 4 100.0% Not responsible for grandchildrenOther race 57 62.2% Responsible for grandchildren34 37.8% Not responsible for grandchildrenTwo or more races 35 100.0% Not responsible for grandchildrenHispanic or Latino 61 61.0% Responsible for grandchildren39 39.0% Not responsible for grandchildrenGrandparents (60 years and over) White / Caucasian 10 21.8% Responsible for grandchildren35 78.2% Not responsible for grandchildrenBlack or African American 35 92.6% Responsible for grandchildren3 7.4% Not responsible for grandchildrenAsian 8 100.0% Not responsible for grandchildrenOther race 31 19.9% Responsible for grandchildren124 80.1% Not responsible for grandchildrenHispanic or Latino 27 14.6% Responsible for grandchildren157 85.4% Not responsible for grandchildren