Races in Alderwood Manor, Washington (WA) Detailed Stats
Data:
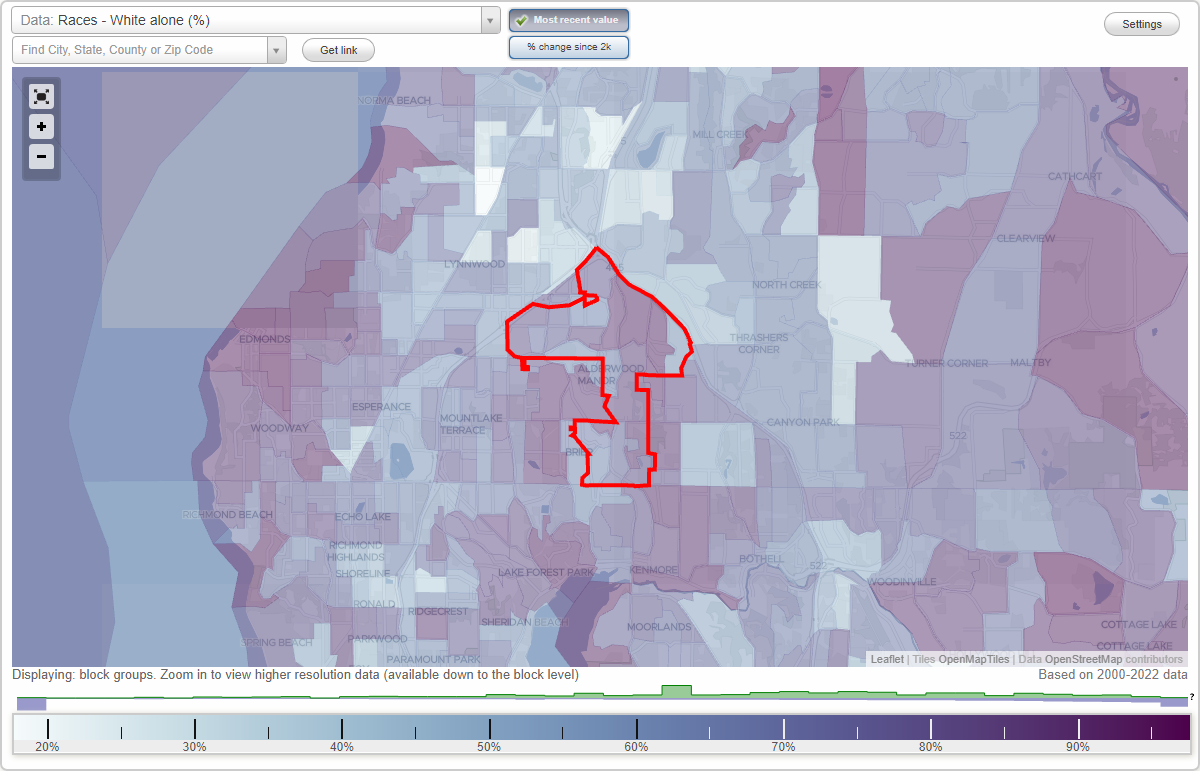
Races - White alone (%)
Races - White alone (% change since 2000)
Races - Black alone (%)
Races - Black alone (% change since 2000)
Races - American Indian alone (%)
Races - American Indian alone (% change since 2000)
Races - Asian alone (%)
Races - Asian alone (% change since 2000)
Races - Hispanic (%)
Races - Hispanic (% change since 2000)
Races - Native Hawaiian and Other Pacific Islander alone (%)
Races - Native Hawaiian and Other Pacific Islander alone (% change since 2000)
Races - Two or more races(%)
Races - Two or more races(% change since 2000)
Races - Other race alone (%)
Races - Other race alone (% change since 2000)
Racial diversity
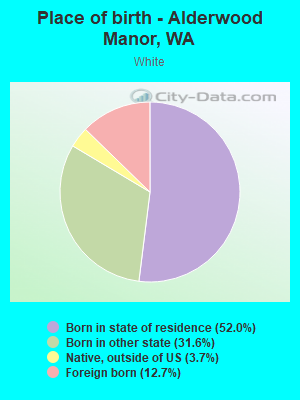
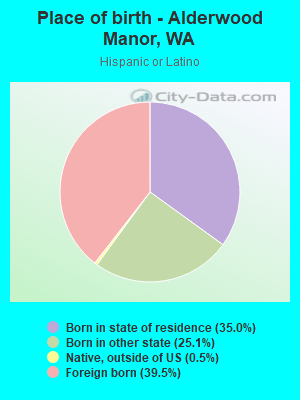
Place of birth - Born in state of residence (%)
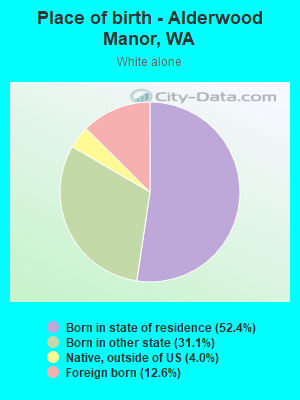
Place of birth - Born in state of residence (%) - White
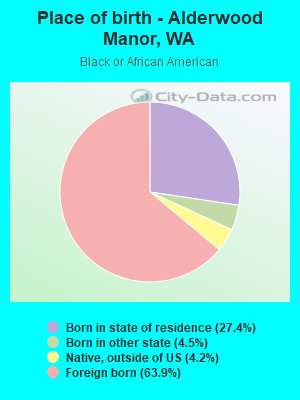
Place of birth - Born in state of residence (%) - Black or African American
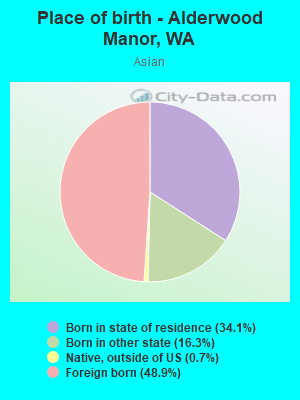
Place of birth - Born in state of residence (%) - Asian
Place of birth - Born in state of residence (%) - Hispanic or Latino
Place of birth - Born in state of residence (%) - American Indian and Alaska Native
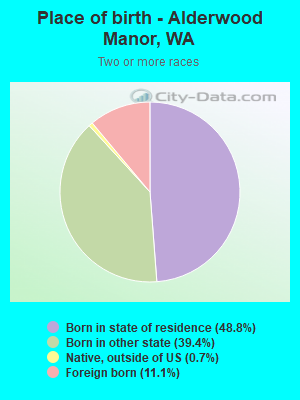
Place of birth - Born in state of residence (%) - Multirace
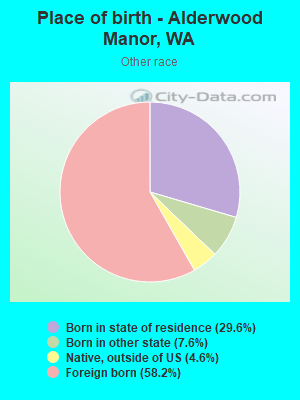
Place of birth - Born in state of residence (%) - Other Race
Place of birth - Born in other state (%)
Place of birth - Born in other state (%) - White
Place of birth - Born in other state (%) - Black or African American
Place of birth - Born in other state (%) - Asian
Place of birth - Born in other state (%) - Hispanic or Latino
Place of birth - Born in other state (%) - American Indian and Alaska Native
Place of birth - Born in other state (%) - Multirace
Place of birth - Born in other state (%) - Other Race
Place of birth - Native, outside of US (%)
Place of birth - Native, outside of US (%) - White
Place of birth - Native, outside of US (%) - Black or African American
Place of birth - Native, outside of US (%) - Asian
Place of birth - Native, outside of US (%) - Hispanic or Latino
Place of birth - Native, outside of US (%) - American Indian and Alaska Native
Place of birth - Native, outside of US (%) - Multirace
Place of birth - Native, outside of US (%) - Other Race
Place of birth - Foreign born (%)
Place of birth - Foreign born (%) - White
Place of birth - Foreign born (%) - Black or African American
Place of birth - Foreign born (%) - Asian
Place of birth - Foreign born (%) - Hispanic or Latino
Place of birth - Foreign born (%) - American Indian and Alaska Native
Place of birth - Foreign born (%) - Multirace
Place of birth - Foreign born (%) - Other Race
Residents speaking English at home (%)
Residents speaking English at home - Born in the United States (%)
Residents speaking English at home - Native, born elsewhere (%)
Residents speaking English at home - Foreign born (%)
Residents speaking Spanish at home (%)
Residents speaking Spanish at home - Born in the United States (%)
Residents speaking Spanish at home - Native, born elsewhere (%)
Residents speaking Spanish at home - Foreign born (%)
Residents speaking other language at home (%)
Residents speaking other language at home - Born in the United States (%)
Residents speaking other language at home - Native, born elsewhere (%)
Residents speaking other language at home - Foreign born (%)
Marital status - Never married (%)
Marital status - Now married (%)
Marital status - Separated (%)
Marital status - Widowed (%)
Marital status - Divorced (%)
Ancestries Reported - Arab (%)
Ancestries Reported - Czech (%)
Ancestries Reported - Danish (%)
Ancestries Reported - Dutch (%)
Ancestries Reported - English (%)
Ancestries Reported - French (%)
Ancestries Reported - French Canadian (%)
Ancestries Reported - German (%)
Ancestries Reported - Greek (%)
Ancestries Reported - Hungarian (%)
Ancestries Reported - Irish (%)
Ancestries Reported - Italian (%)
Ancestries Reported - Lithuanian (%)
Ancestries Reported - Norwegian (%)
Ancestries Reported - Polish (%)
Ancestries Reported - Portuguese (%)
Ancestries Reported - Russian (%)
Ancestries Reported - Scotch-Irish (%)
Ancestries Reported - Scottish (%)
Ancestries Reported - Slovak (%)
Ancestries Reported - Subsaharan African (%)
Ancestries Reported - Swedish (%)
Ancestries Reported - Swiss (%)
Ancestries Reported - Ukrainian (%)
Ancestries Reported - United States (%)
Ancestries Reported - Welsh (%)
Ancestries Reported - West Indian (%)
Ancestries Reported - Other (%)
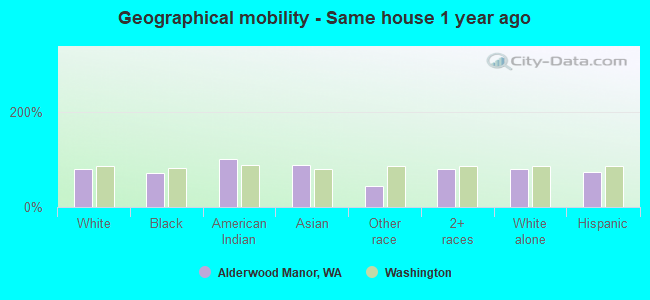
Geographical mobility - Same house 1 year ago (%)
Geographical mobility - Same house 1 year ago (%) - White
Geographical mobility - Same house 1 year ago (%) - Black or African American
Geographical mobility - Same house 1 year ago (%) - Asian
Geographical mobility - Same house 1 year ago (%) - Hispanic or Latino
Geographical mobility - Same house 1 year ago (%) - American Indian and Alaska Native
Geographical mobility - Same house 1 year ago (%) - Multirace
Geographical mobility - Same house 1 year ago (%) - Other Race
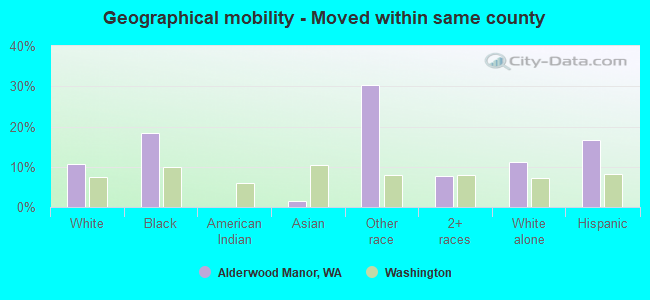
Geographical mobility - Moved within same county (%)
Geographical mobility - Moved within same county (%) - White
Geographical mobility - Moved within same county (%) - Black or African American
Geographical mobility - Moved within same county (%) - Asian
Geographical mobility - Moved within same county (%) - Hispanic or Latino
Geographical mobility - Moved within same county (%) - American Indian and Alaska Native
Geographical mobility - Moved within same county (%) - Multirace
Geographical mobility - Moved within same county (%) - Other Race
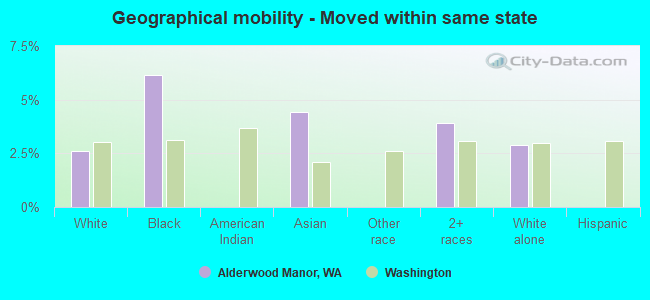
Geographical mobility - Moved from different county within same state (%)
Geographical mobility - Moved from different county within same state (%) - White
Geographical mobility - Moved from different county within same state (%) - Black or African American
Geographical mobility - Moved from different county within same state (%) - Asian
Geographical mobility - Moved from different county within same state (%) - Hispanic or Latino
Geographical mobility - Moved from different county within same state (%) - American Indian and Alaska Native
Geographical mobility - Moved from different county within same state (%) - Multirace
Geographical mobility - Moved from different county within same state (%) - Other Race
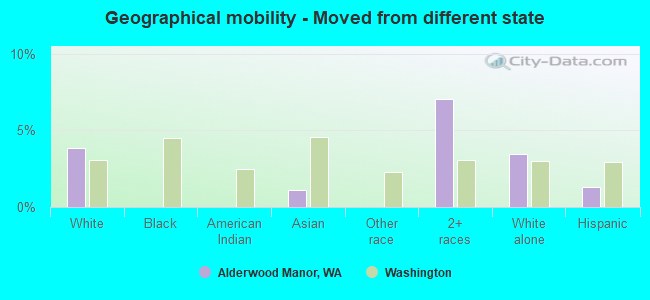
Geographical mobility - Moved from different state (%)
Geographical mobility - Moved from different state (%) - White
Geographical mobility - Moved from different state (%) - Black or African American
Geographical mobility - Moved from different state (%) - Asian
Geographical mobility - Moved from different state (%) - Hispanic or Latino
Geographical mobility - Moved from different state (%) - American Indian and Alaska Native
Geographical mobility - Moved from different state (%) - Multirace
Geographical mobility - Moved from different state (%) - Other Race
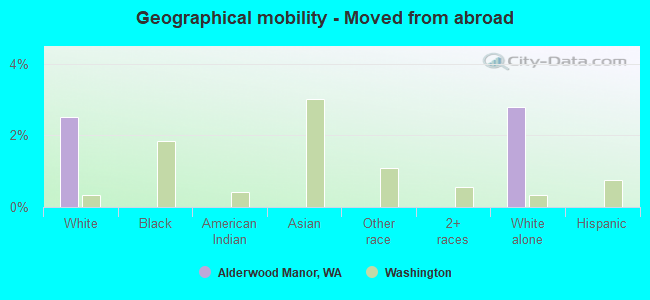
Geographical mobility - Moved from abroad (%)
Geographical mobility - Moved from abroad (%) - White
Geographical mobility - Moved from abroad (%) - Black or African American
Geographical mobility - Moved from abroad (%) - Asian
Geographical mobility - Moved from abroad (%) - Hispanic or Latino
Geographical mobility - Moved from abroad (%) - American Indian and Alaska Native
Geographical mobility - Moved from abroad (%) - Multirace
Geographical mobility - Moved from abroad (%) - Other Race
Place of birth for the foreign-born population - Ireland (%)
Place of birth for the foreign-born population - Denmark (%)
Place of birth for the foreign-born population - Norway (%)
Place of birth for the foreign-born population - Sweden (%)
Place of birth for the foreign-born population - United Kingdom (%)
Place of birth for the foreign-born population - England (%)
Place of birth for the foreign-born population - Scotland (%)
Place of birth for the foreign-born population - Other Northern Europe (%)
Place of birth for the foreign-born population - Austria (%)
Place of birth for the foreign-born population - Belgium (%)
Place of birth for the foreign-born population - France (%)
Place of birth for the foreign-born population - Germany (%)
Place of birth for the foreign-born population - Netherlands (%)
Place of birth for the foreign-born population - Switzerland (%)
Place of birth for the foreign-born population - Other Western Europe (%)
Place of birth for the foreign-born population - Greece (%)
Place of birth for the foreign-born population - Italy (%)
Place of birth for the foreign-born population - Portugal (%)
Place of birth for the foreign-born population - Spain (%)
Place of birth for the foreign-born population - Other Southern Europe (%)
Place of birth for the foreign-born population - Albania (%)
Place of birth for the foreign-born population - Belarus (%)
Place of birth for the foreign-born population - Bosnia and Herzegovina (%)
Place of birth for the foreign-born population - Bulgaria (%)
Place of birth for the foreign-born population - Croatia (%)
Place of birth for the foreign-born population - Czechoslovakia (%)
Place of birth for the foreign-born population - Hungary (%)
Place of birth for the foreign-born population - Latvia (%)
Place of birth for the foreign-born population - Lithuania (%)
Place of birth for the foreign-born population - North Macedonia (Macedonia) (%)
Place of birth for the foreign-born population - Moldova (%)
Place of birth for the foreign-born population - Poland (%)
Place of birth for the foreign-born population - Romania (%)
Place of birth for the foreign-born population - Russia (%)
Place of birth for the foreign-born population - Serbia (%)
Place of birth for the foreign-born population - Ukraine (%)
Place of birth for the foreign-born population - Other Eastern Europe (%)
Place of birth for the foreign-born population - China (%)
Place of birth for the foreign-born population - Hong Kong (%)
Place of birth for the foreign-born population - Taiwan (%)
Place of birth for the foreign-born population - Japan (%)
Place of birth for the foreign-born population - Korea (%)
Place of birth for the foreign-born population - Other Eastern Asia (%)
Place of birth for the foreign-born population - Afghanistan (%)
Place of birth for the foreign-born population - Bangladesh (%)
Place of birth for the foreign-born population - India (%)
Place of birth for the foreign-born population - Iran (%)
Place of birth for the foreign-born population - Kazakhstan (%)
Place of birth for the foreign-born population - Nepal (%)
Place of birth for the foreign-born population - Pakistan (%)
Place of birth for the foreign-born population - Sri Lanka (%)
Place of birth for the foreign-born population - Uzbekistan (%)
Place of birth for the foreign-born population - Other South Central Asia (%)
Place of birth for the foreign-born population - Burma (%)
Place of birth for the foreign-born population - Cambodia (%)
Place of birth for the foreign-born population - Indonesia (%)
Place of birth for the foreign-born population - Laos (%)
Place of birth for the foreign-born population - Malaysia (%)
Place of birth for the foreign-born population - Philippines (%)
Place of birth for the foreign-born population - Singapore (%)
Place of birth for the foreign-born population - Thailand (%)
Place of birth for the foreign-born population - Vietnam (%)
Place of birth for the foreign-born population - Other South Eastern Asia (%)
Place of birth for the foreign-born population - Armenia (%)
Place of birth for the foreign-born population - Iraq (%)
Place of birth for the foreign-born population - Israel (%)
Place of birth for the foreign-born population - Jordan (%)
Place of birth for the foreign-born population - Kuwait (%)
Place of birth for the foreign-born population - Lebanon (%)
Place of birth for the foreign-born population - Saudi Arabia (%)
Place of birth for the foreign-born population - Syria (%)
Place of birth for the foreign-born population - Turkey (%)
Place of birth for the foreign-born population - Yemen (%)
Place of birth for the foreign-born population - Other Western Asia (%)
Place of birth for the foreign-born population - Eritrea (%)
Place of birth for the foreign-born population - Ethiopia (%)
Place of birth for the foreign-born population - Kenya (%)
Place of birth for the foreign-born population - Somalia (%)
Place of birth for the foreign-born population - Uganda (%)
Place of birth for the foreign-born population - Zimbabwe (%)
Place of birth for the foreign-born population - Other Eastern Africa (%)
Place of birth for the foreign-born population - Cameroon (%)
Place of birth for the foreign-born population - Congo (%)
Place of birth for the foreign-born population - Democratic Republic of Congo (Zaire) (%)
Place of birth for the foreign-born population - Other Middle Africa (%)
Place of birth for the foreign-born population - Egypt (%)
Place of birth for the foreign-born population - Morocco (%)
Place of birth for the foreign-born population - Sudan (%)
Place of birth for the foreign-born population - Other Northern Africa (%)
Place of birth for the foreign-born population - South Africa (%)
Place of birth for the foreign-born population - Other Southern Africa (%)
Place of birth for the foreign-born population - Cabo Verde (%)
Place of birth for the foreign-born population - Ghana (%)
Place of birth for the foreign-born population - Liberia (%)
Place of birth for the foreign-born population - Nigeria (%)
Place of birth for the foreign-born population - Senegal (%)
Place of birth for the foreign-born population - Sierra Leone (%)
Place of birth for the foreign-born population - Other Western Africa (%)
Place of birth for the foreign-born population - Australia (%)
Place of birth for the foreign-born population - New Zealand (%)
Place of birth for the foreign-born population - Fiji (%)
Place of birth for the foreign-born population - Micronesia (%)
Place of birth for the foreign-born population - Bahamas (%)
Place of birth for the foreign-born population - Barbados (%)
Place of birth for the foreign-born population - Cuba (%)
Place of birth for the foreign-born population - Dominica (%)
Place of birth for the foreign-born population - Dominican Republic (%)
Place of birth for the foreign-born population - Grenada (%)
Place of birth for the foreign-born population - Haiti (%)
Place of birth for the foreign-born population - Jamaica (%)
Place of birth for the foreign-born population - St. Vincent and the Grenadines (%)
Place of birth for the foreign-born population - Trinidad and Tobago (%)
Place of birth for the foreign-born population - West Indies (%)
Place of birth for the foreign-born population - Other Caribbean (%)
Place of birth for the foreign-born population - Belize (%)
Place of birth for the foreign-born population - Costa Rica (%)
Place of birth for the foreign-born population - El Salvador (%)
Place of birth for the foreign-born population - Guatemala (%)
Place of birth for the foreign-born population - Honduras (%)
Place of birth for the foreign-born population - Mexico (%)
Place of birth for the foreign-born population - Nicaragua (%)
Place of birth for the foreign-born population - Panama (%)
Place of birth for the foreign-born population - Other Central America (%)
Place of birth for the foreign-born population - Argentina (%)
Place of birth for the foreign-born population - Bolivia (%)
Place of birth for the foreign-born population - Brazil (%)
Place of birth for the foreign-born population - Chile (%)
Place of birth for the foreign-born population - Colombia (%)
Place of birth for the foreign-born population - Ecuador (%)
Place of birth for the foreign-born population - Guyana (%)
Place of birth for the foreign-born population - Peru (%)
Place of birth for the foreign-born population - Uruguay (%)
Place of birth for the foreign-born population - Venezuela (%)
Place of birth for the foreign-born population - Other South America (%)
Place of birth for the foreign-born population - Canada (%)
Place of birth for the foreign-born population - Other Northern America (%)
Place of birth for the foreign-born population - Other (%)
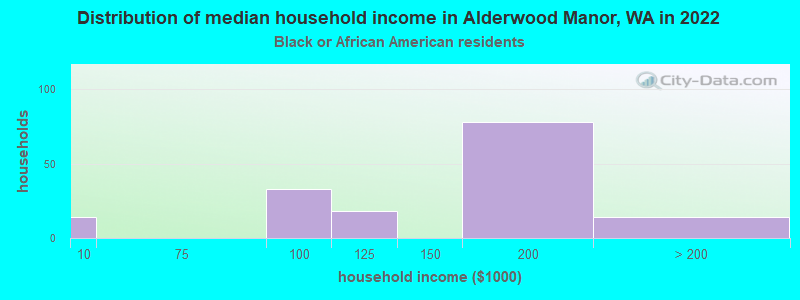
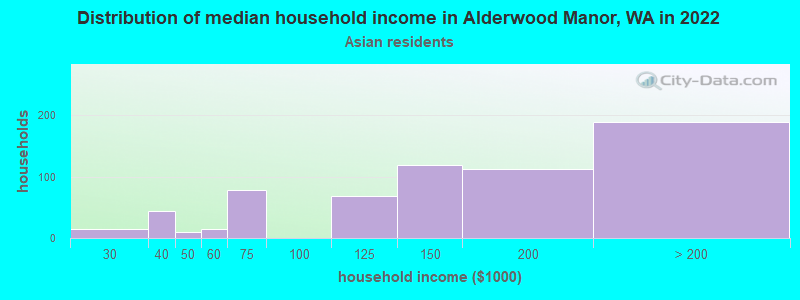
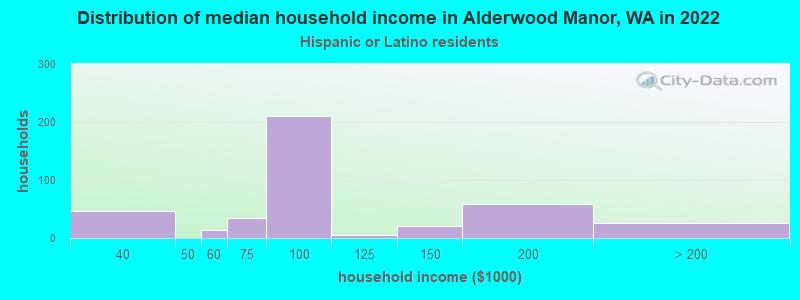
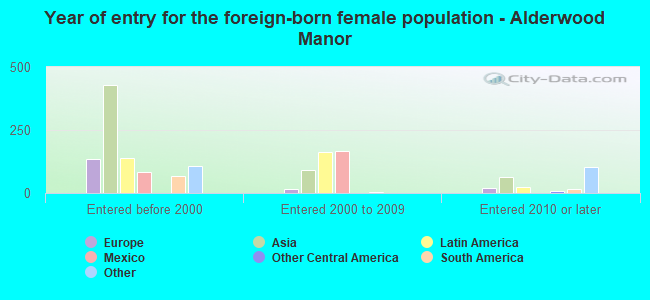
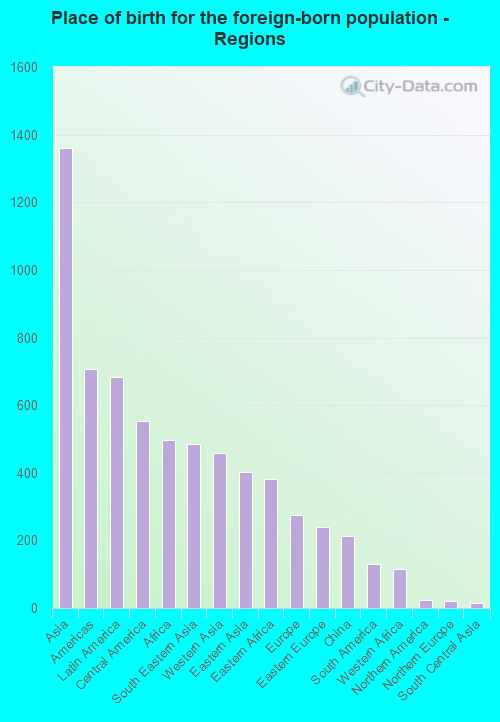
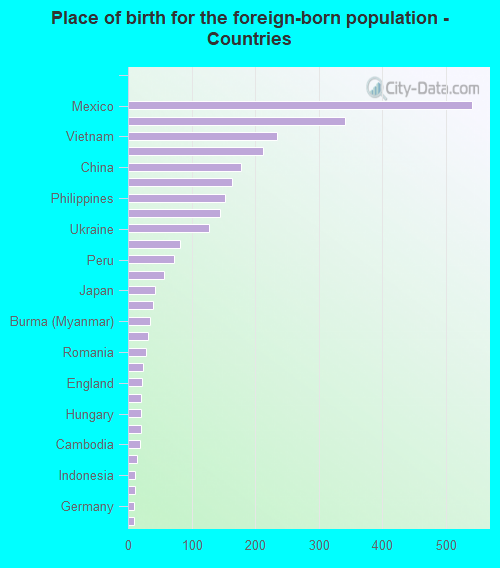
According to 2022 data, the most numerous races in Alderwood Manor, WA are White alone (5,609 residents), Hispanic (1,668 residents), and Asian alone (2,066 residents). 57.4% of Alderwood Manor residents speak English at home. 26.6% of Alderwood Manor, WA residents are foreign-born (12.4% born in Asia, 6.2% born in Latin America, 4.6% born in Africa), which is 43.6% greater than the foreign-born rate of 15.0% across the entire state of Washington.
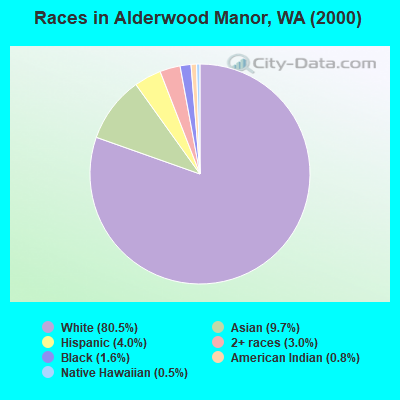
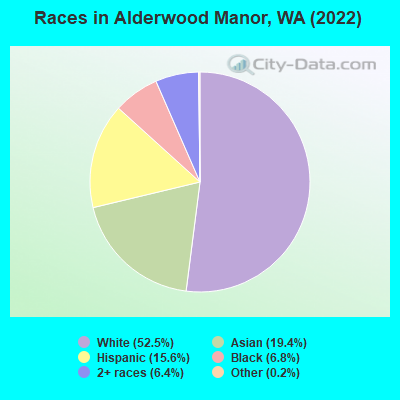
Race distribution in Alderwood Manor
2000 2022
4,652,490 78.9% White alone 441,509 7.5% Hispanic 319,401 5.4% Asian alone 184,631 3.1% Black alone 175,926 3.0% Two or more races 85,396 1.4% American Indian alone 22,779 0.4% Native Hawaiian and Other 11,989 0.2% Other race alone
4,941,456 63.5% White alone 1,093,313 14.0% Hispanic 755,832 9.7% Asian alone 523,448 6.7% Two or more races 299,537 3.8% Black alone 69,024 0.9% American Indian alone 52,231 0.7% Native Hawaiian and Other 50,945 0.7% Other race alone
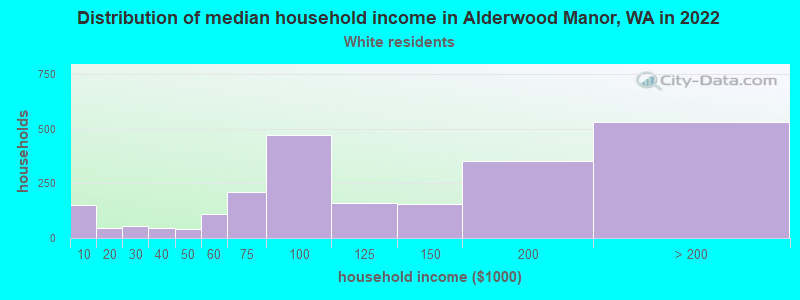
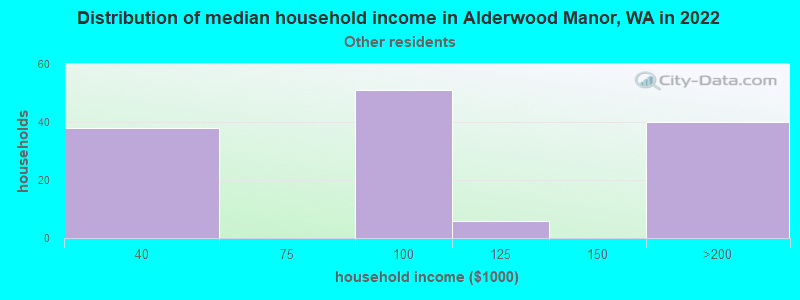
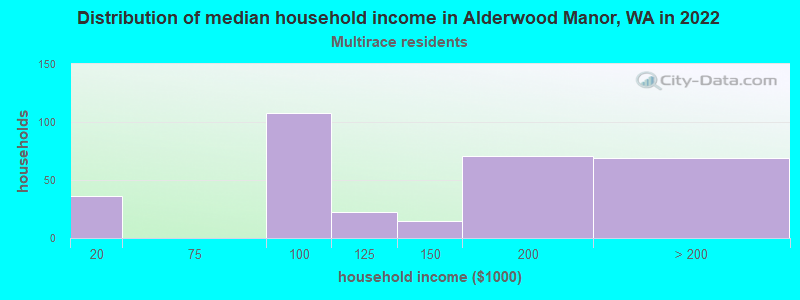
Income and house value in Alderwood Manor Median household income in 2022 $111,911 White non-Hispanic householders$145,456 Asian householders$110,159 Two or more races householders$82,682 Hispanic or Latino race householdersMedian 2022 house value $769,851 White Non-Hispanic householders$897,292 Black or African American householders$901,700 American Indian or Alaska Native householders $885,670 Asian householders$677,678 Some other race householders$829,163 Two or more races householders$827,560 Hispanic or Latino householders
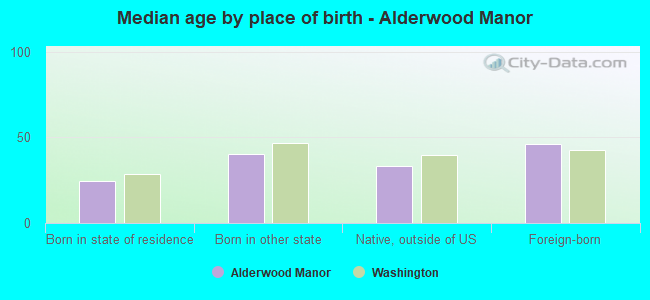
Median age by race in Alderwood Manor
38.4 Median age for White residents40.6 35.7 34.3 Median age for Black or African American residents33.3 31.4 -644,308,942.4 Median age for American Indian / Alaska Native residents-736,637,511.4 -589,658,965.3 37.4 Median age for Asian residents37.5 39.9 -677,839,850.3 Median age for Native Hawaiian / Pacific Islander residents-661,202,185.1 -844,317,095.6 28.9 Median age for Other race residents21.7 40.1 29.8 Median age for Two or more races residents28.5 32.0 40.3 Median age for White alone residents44.7 38.2 29.9 Median age for Hispanic or Latino residents28.6 31.2
Owner/renter occupied households by race in Alderwood Manor
House owners and renters - White residents 1,527 67.3% Owner occupied743 32.7% Renter occupiedHouse owners and renters - Black or African American residents 115 80.7% Owner occupied27 19.3% Renter occupiedHouse owners and renters - American Indian / Alaska Native residents 7 100.0% Owner occupiedHouse owners and renters - Asian residents 569 82.2% Owner occupied124 17.8% Renter occupiedHouse owners and renters - Other race residents 133 71.6% Owner occupied53 28.4% Renter occupiedHouse owners and renters - Two or more races residents 145 43.2% Owner occupied191 56.8% Renter occupiedHouse owners and renters - White alone residents 1,410 66.2% Owner occupied721 33.8% Renter occupiedHouse owners and renters - Hispanic or Latino residents 241 59.1% Owner occupied167 40.9% Renter occupied
Language usage in Alderwood Manor
English speakers - Total 57.4% of residents of Alderwood Manor speak English at home.
12.9% of residents speak Spanish at home 896 70.8% Speak English very well369 29.2% Speak English less than very well29.3% of residents speak other language at home 2,059 71.7% Speak English very well812 28.3% Speak English less than very well
English speakers - Born in the United States 80.3% of residents of Alderwood Manor speak English at home.
6.5% of residents speak Spanish at home 145 81.5% Speak English very well33 18.5% Speak English less than very well12.9% of residents speak other language at home 352 100.0% Speak English very well
English speakers - Native, born elsewhere 71.6% of residents of Alderwood Manor speak English at home.
8.0% of residents speak Spanish at home 21 100.0% Speak English very well23.4% of residents speak other language at home 61 100.0% Speak English very well
English speakers - Foreign-born 10.7% of residents of Alderwood Manor speak English at home.
19.4% of residents speak Spanish at home 235 42.5% Speak English very well318 57.5% Speak English less than very well68.9% of residents speak other language at home 1,200 61.2% Speak English very well761 38.8% Speak English less than very well
White (Caucasian) - Speak only English Native:
80.9% (3,893)Foreign-born:
9.2% (70)
White (Caucasian) - Speak another language Native:
16.1% (773)Foreign-born:
89.5% (679)
Black or African American - Speak another language Native:
33.0% (70)Foreign-born:
82.3% (378)
Asian - Speak only English Native:
53.5% (482)Foreign-born:
19.5% (202)
Asian - Speak another language Native:
46.5% (419)Foreign-born:
81.4% (842)
Other race - Speak another language Native:
75.8% (122)Foreign-born:
96.4% (363)
Two or more races - Speak only English Native:
87.8% (797)Foreign-born:
21.0% (25)
Two or more races - Speak another language Native:
11.9% (108)Foreign-born:
79.4% (95)
White alone - Speak only English Native:
82.4% (3,761)Foreign-born:
7.9% (56)
White alone - Speak another language Native:
17.0% (777)Foreign-born:
95.0% (667)
Hispanic or Latino - Speak only English Native:
62.4% (456)Foreign-born:
13.1% (83)
Hispanic or Latino - Speak another language Native:
37.6% (275)Foreign-born:
87.3% (555)
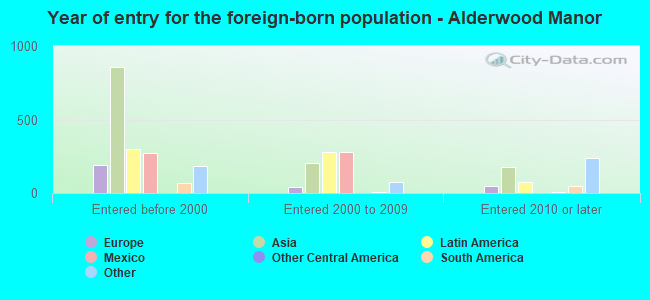
Foreign-born residents in Alderwood Manor 2,840 residents are foreign born (12.4% Asia , 6.2% Latin America , 4.6% Africa ).
This city:
26.6%Washington:
14.9%
Marital status for residents in Alderwood Manor Marital status - White (Caucasian) population 15 years and over
Males 36.9% Never married51.2% Now married0.0% Separated0.9% Widowed11.0% DivorcedFemales 25.9% Never married51.6% Now married3.0% Separated9.2% Widowed10.3% DivorcedWomen who gave birth in the past 12 months Now married:
100.0% (54)Unmarried:
0.0% (0)
Women who did not give birth in the past 12 months Now married:
51.7% (643)Unmarried:
48.3% (601)
Marital status - Black or African American population 15 years and over
Males 29.7% Never married43.4% Now married0.0% Separated22.6% Widowed4.3% DivorcedFemales 47.8% Never married39.9% Now married0.0% Separated0.0% Widowed12.3% DivorcedWomen who gave birth in the past 12 months Now married:
0.0% (0)Unmarried:
100.0% (45)
Women who did not give birth in the past 12 months Now married:
25.2% (45)Unmarried:
74.8% (133)
Marital status - Asian population 15 years and over
Males 41.3% Never married58.7% Now married0.0% Separated0.0% Widowed0.0% DivorcedFemales 34.8% Never married51.2% Now married0.0% Separated0.0% Widowed13.9% DivorcedWomen who gave birth in the past 12 months Now married:
100.0% (56)Unmarried:
0.0% (0)
Women who did not give birth in the past 12 months Now married:
39.5% (269)Unmarried:
60.5% (412)
Marital status - Other race population 15 years and over
Males 56.7% Never married39.3% Now married0.0% Separated0.0% Widowed3.9% DivorcedFemales 26.4% Never married65.1% Now married0.0% Separated0.0% Widowed8.5% DivorcedWomen who did not give birth in the past 12 months Now married:
67.8% (166)Unmarried:
32.2% (79)
Marital status - Two or more races population 15 years and over
Males 50.0% Never married48.6% Now married0.0% Separated0.0% Widowed1.4% DivorcedFemales 47.4% Never married35.8% Now married0.0% Separated16.8% Widowed0.0% DivorcedWomen who gave birth in the past 12 months Now married:
100.0% (21)Unmarried:
0.0% (0)
Women who did not give birth in the past 12 months Now married:
28.1% (118)Unmarried:
71.9% (302)
Marital status - White alone, not Hispanic / Latino population 15 years and over
Males 37.0% Never married50.4% Now married0.0% Separated1.0% Widowed11.6% DivorcedFemales 25.8% Never married49.7% Now married3.3% Separated10.0% Widowed11.2% DivorcedWomen who gave birth in the past 12 months Now married:
100.0% (56)Unmarried:
0.0% (0)
Women who did not give birth in the past 12 months Now married:
49.7% (558)Unmarried:
50.3% (565)
Marital status - Hispanic or Latino population 15 years and over
Males 52.7% Never married44.0% Now married0.0% Separated0.0% Widowed3.3% DivorcedFemales 32.7% Never married55.7% Now married0.0% Separated11.7% Widowed0.0% DivorcedWomen who did not give birth in the past 12 months Now married:
51.8% (327)Unmarried:
48.2% (305)
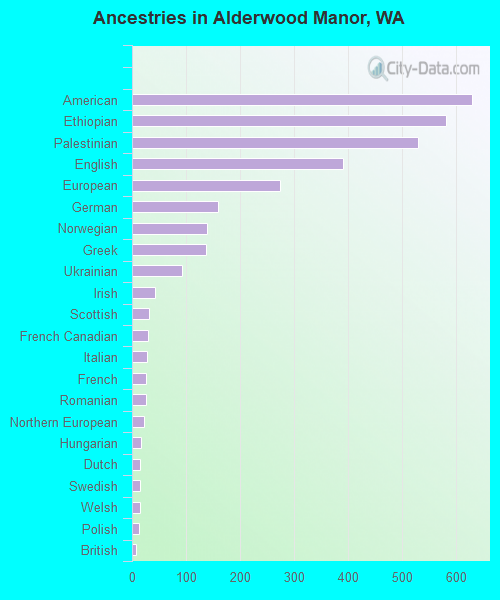
Ancestries in Alderwood Manor
629 10.2% American580 9.4% Ethiopian530 8.6% Palestinian391 6.4% English273 4.4% European159 2.6% German138 2.2% Norwegian136 2.2% Greek92 1.5% Ukrainian43 0.7% Irish32 0.5% Scottish29 0.5% French Canadian27 0.4% Italian26 0.4% French25 0.4% Romanian23 0.4% Northern European17 0.3% Hungarian15 0.2% Dutch15 0.2% Swedish15 0.2% Welsh13 0.2% Polish7 0.1% British5 0.08% Afghan
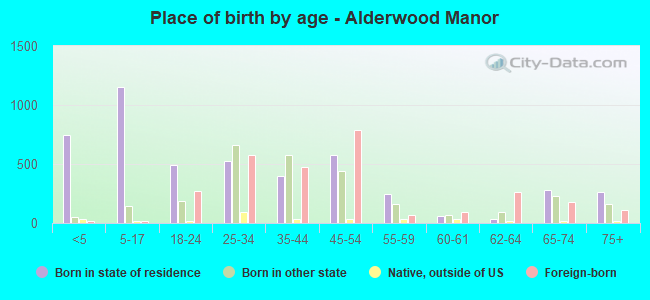
Children Nativity (place of birth) in Alderwood Manor
Children under 6 years - Living with two parents Both parents native 528 100.0% NativeBoth parents foreign-born 305 93.9% Native20 6.1% Foreign-bornOne native, one foreign-born parent 58 100.0% NativeChildren under 6 years - Living with one parent Native parent 56 100.0% NativeForeign-born parent 45 100.0% NativeChildren 6 to 17 years - Living with two parents Both parents native 210 100.0% NativeBoth parents foreign-born 331 100.0% NativeOne native, one foreign-born parent 421 100.0% NativeChildren 6 to 17 years - Living with one parent Native parent 63 100.0% NativeForeign-born parent 93 49.1% Native96 50.9% Foreign-born
Grandparents responsible for own grandchildren in Alderwood Manor
Grandparents (30 to 59 years) White / Caucasian 8 17.9% Responsible for grandchildren37 82.1% Not responsible for grandchildrenTwo or more races 13 100.0% Not responsible for grandchildrenWhite alone, not Hispanic / Latino 9 18.0% Responsible for grandchildren39 82.0% Not responsible for grandchildrenHispanic or Latino 12 100.0% Not responsible for grandchildren
Grandparents (60 years and over) White / Caucasian 86 100.0% Not responsible for grandchildrenWhite alone, not Hispanic / Latino 89 100.0% Not responsible for grandchildren